27 Sep 2012 Creating basic reports with APEX
Some of you may not even realize that by installing Oracle database will also install a free tool to build web applications. The name of that tool is APEX (stands for Application Express) and I will try to show you some of its basic functionalities. Just by looking at the Sample Application (created by default during the creation of the development environment) you can see what APEX is. I will show you how to build a basic chart using APEX’s wizards, and how to choose a checklist as a filter for report’s parameters. You will also see how to overcome one of APEX’s issues. We will start from the point that you already have a new application with one empty page created.
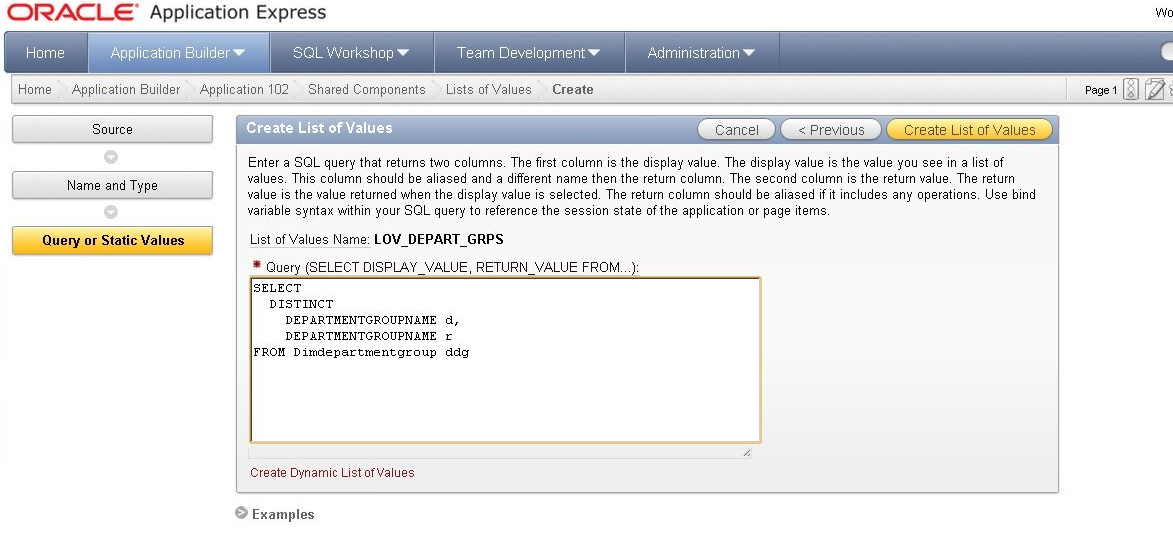
So firstly, we need to create ‘list of values’ that will be used later for chart parameterization. To do that, we have to log into APEX workspace, choose our application from apps list and then edit the page where we want to create the chart. Then we add a new ‘list of values’ by clicking ‘create’ in the ‘List of Values’ section of the page. At the first screen we choose ‘From Scratch’ option, at the next we give it a name and we choose ‘Dynamic’ option. In the next step we define SQL query (remember to add proper aliases to the columns you want to select in the query – clicking ‘Examples’ link below the box where you type SQL query isn’t a bad idea in case you have any problems) – that will be used for creation of our list and finally we click ‘Create List of Values’ button.
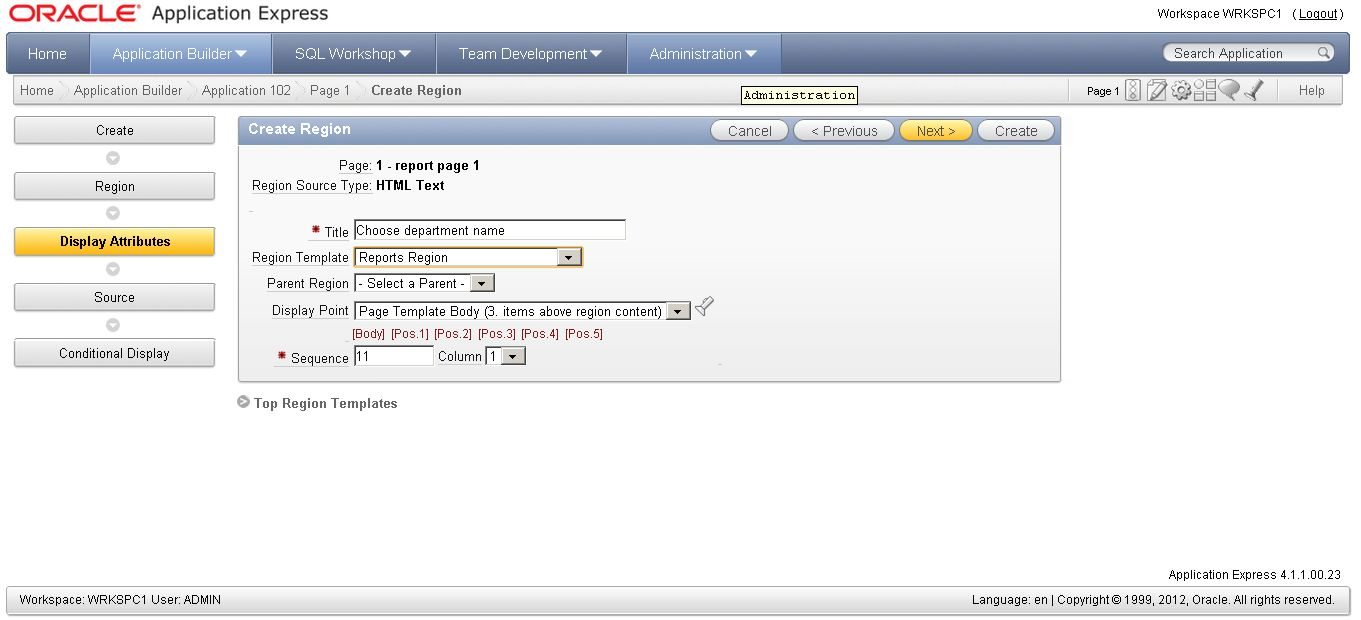
Of course, in some cases it may be convenient to use a static list of values; it depends on your needs. So now that our list has been created, however it’s still not displayed at our application – it’s just available to be shown on our application. Therefore in the next step we will put it on the screen. Before we actually add the list to the screen, we need to add a region where the list will be shown. To do that, we click ‘Create’ icon in ‘Regions’ section, we choose ‘HTML’ region from list of available regions, then we choose ‘HTML’, then we set region’s parameters and then we may click ‘Create’ button as there is no need to go through two remaining screens as we would use default values on both of them anyway.
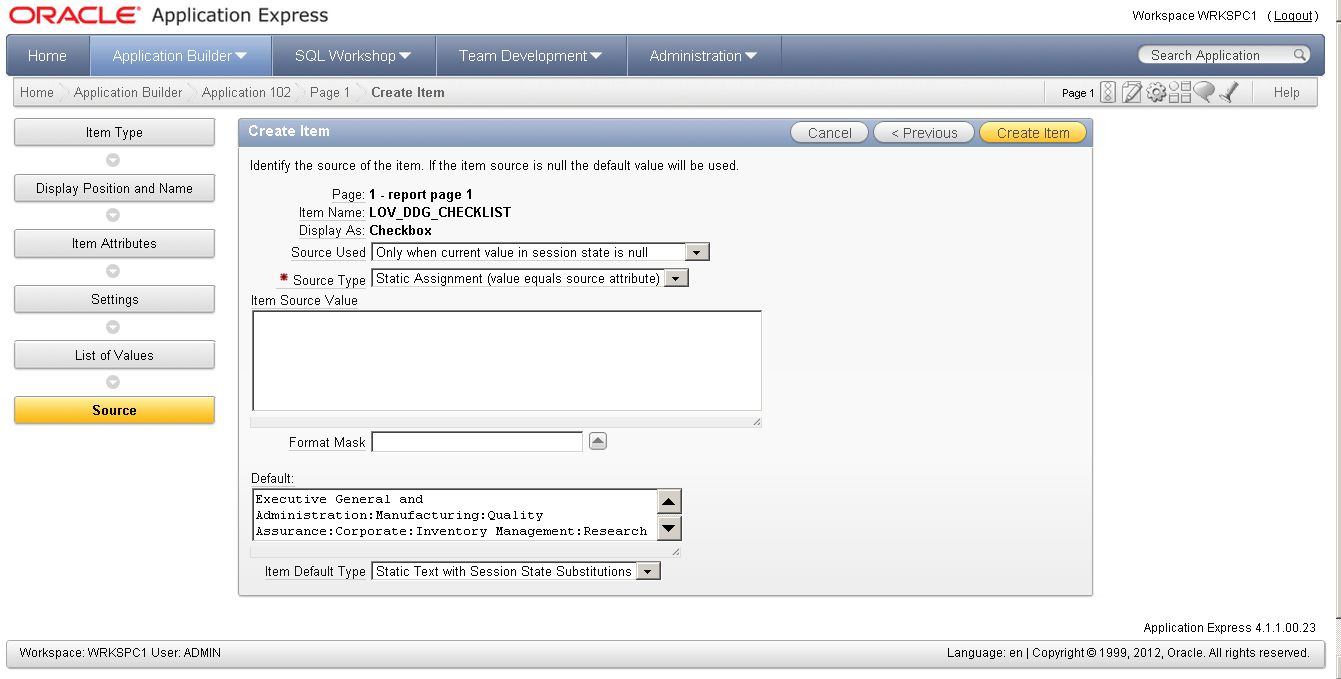
To finally visualize the checklist on the page we go to the page edition menu again and this time we click ‘Create’ button in ‘Items’ section. We choose ‘Check Box’ in the next step, then on the next screen we give it a name, and we choose previously created region from ‘region’ drop-down list. At ‘Item Attributes’ screen we set list’s visual options. At ‘Settings’ screen we enable ‘Value Required’ option. Then, at ‘List of Values’ screen, as a ‘Named LOV’ we choose previously created value list and we may use default values for other options. Finally, at ‘Source’ screen we choose default values, except for the ‘default’ box. There we put a value of all possible values from our list separated by a colon. We use colon because values of array-like variables are being passed internally between APEX pages as string values but separated but colon.
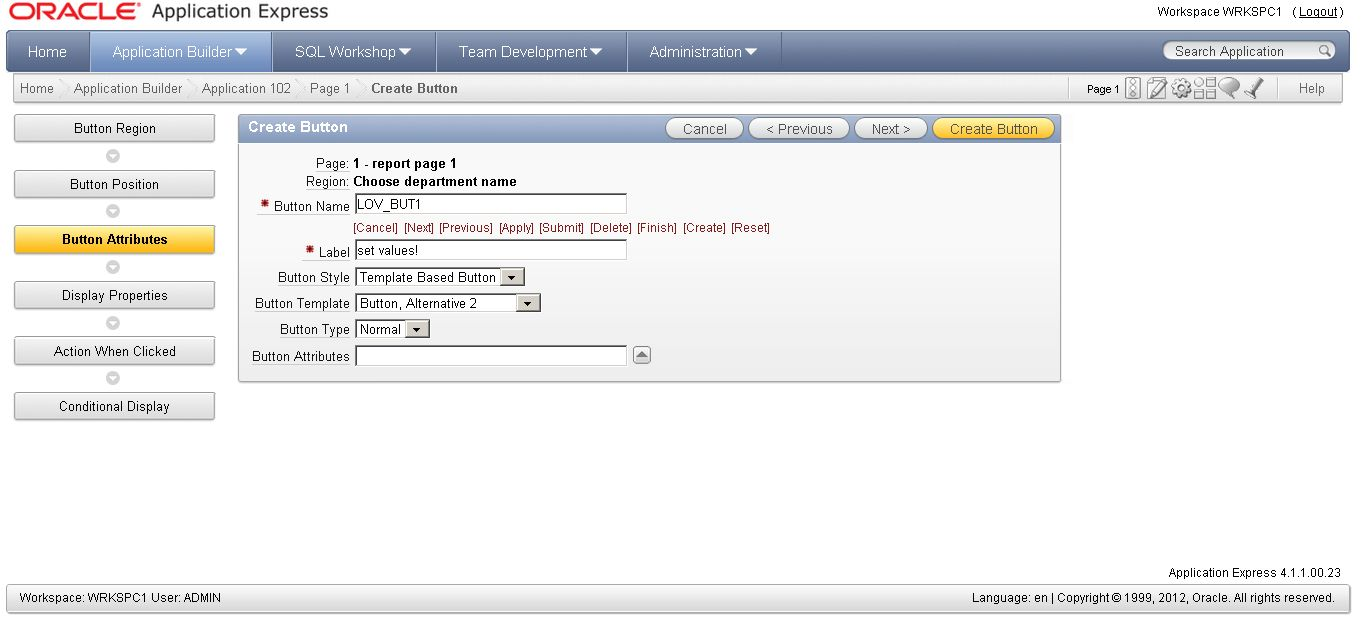
As the last step of creating the checklist, we must add the button which, when clicked, will apply checks/unchecks on the list. To do that, we click ‘Create’ button in ‘Buttons’ section. At ‘Button Region’ subpage, we choose the region that we previously created for the checklist, at ‘button position’ subpage we choose ‘…Among this region’s items’ option, in ‘Button attributes’ we type button’s name, label (that will be written on the button) and we choose other visual attributes.
At ‘Display properties’ subpage we set some more visual properties of the button. At ‘Action When Clicked’ section we choose ‘Submit Validations’ as an ‘Action’ and, in this stage we can already click ‘Create button’ button. Ok, now the only remaining task is to add the chart. To do that we click ‘Create’ button in ‘Regions’ section, then we choose ‘Chart’ / ‘Flash Chart’ / ‘Pie & Doughnut’ / ‘2D Pie’ (well, this is how I do it in this example, of course you don’t have to follow it strictly, there is so many kinds of graphs & charts in APEX). Then, in ‘Display properties’ you display properties of a chart (of course), and in ‘Source’ you create the SQL query that will be visualized by the chart. You can use a wizard to build the query (by clicking a button) or you can just type or paste SQL query (no semicolon at the end) to the ‘Enter SQL query…’ box. So let’s say that we have our SQL query already prepared:
SELECT     ddg.departmentgroupname,
 cast (SUM(AMOUNT) as DECIMAL (12,1) )
 FROM       FactFinance ff
 INNER JOIN
 Dimdepartmentgroup ddg
 ON         ff.departmentgroupkey = ddg.departmentgroupkey
 GROUP BY   ddg.departmentgroupname
We can paste it and click ‘Next’ … which will return an error. As you could see if you clicked ‘Chart Query Example for [ Your chart type]‘, the first selected column of a query is ‘NULL LINK’ – there is an option to add a link to each row / piece / bar of data, and if we don’t want to use it, we can just put NULL value there. So we have to add it to our query so that it passes validation. So actually our report would already work, yet we still didn’t add the possibility of its parameterization. To do that, we have to add one more line to our query, and this will be:
WHERE INSTR(:name_of_apex_value_list_item_we_created,name_of_filtered_column) > 0
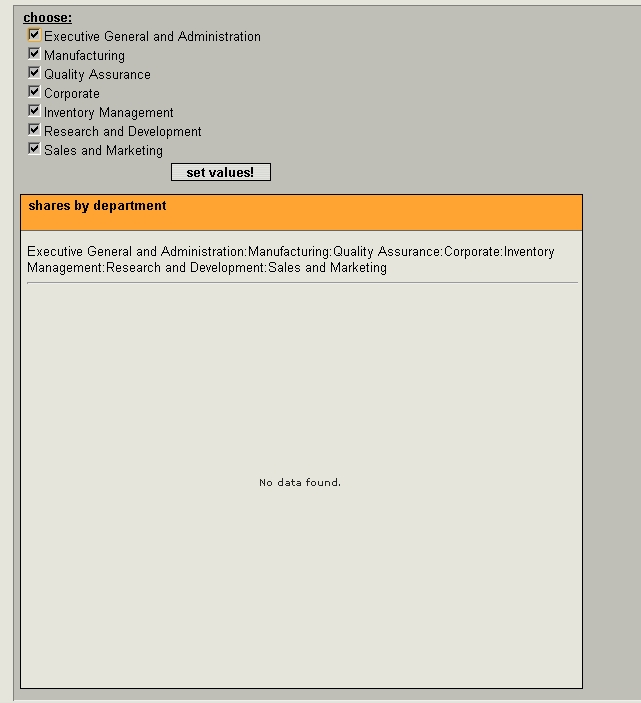
…just after the join conditions. We use INSTR SQL function to check if value of ‘name_of_filtered_column’ is included in the list of parameters we want to use in the current execution of the report. We add colon sign before using the APEX item name because this is obligatory when using APEX’s items in SQL queries. So, our parameterized chart should already work….unfortunately, in most cases it doesn’t. The problem is that there is an issue in APEX with passing default values so after launching page with chart for the first time (before clicking ‘set values!’ button ), instead of our chart we – or our client – would see NO DATA FOUND string.
Actually I didn’t find any classy solution for that, so what I personally do is to use NVL function in the WHERE condition with INSTR function I showed above, entering values that we put as default values for the checklist few paragraphs before. So, in my case, that line looks like that:
WHERE INSTR(NVL(:LOV_DDG_CHECKLIST, 'Executive General and Administration:Manufacturing:Quality Assurance:Corporate:Inventory Management:Research and Development:Sales and Marketing' ) ,ddg.departmentgroupname) > 0 …and finally our SQL query is:
 SELECT NULL LINK,
 ddg.departmentgroupname,
 cast (SUM(AMOUNT) as DECIMAL (12,1) )
 FROM   FactFinance ff
 INNER JOIN
 Dimdepartmentgroup ddg
 ON     ff.departmentgroupkey = ddg.departmentgroupkey
 WHERE
 INSTR(NVL(:LOV_DDG_CHECKLIST, 'Executive General and Administration:Manufacturing:Quality Assurance:Corporate:Inventory Management:Research and Development:Sales and Marketing' ),ddg.departmentgroupname) > 0
 GROUP BY ddg.departmentgroupname
Well, finally the chart should work well and, in case you followed my steps, it should more or less look like that:
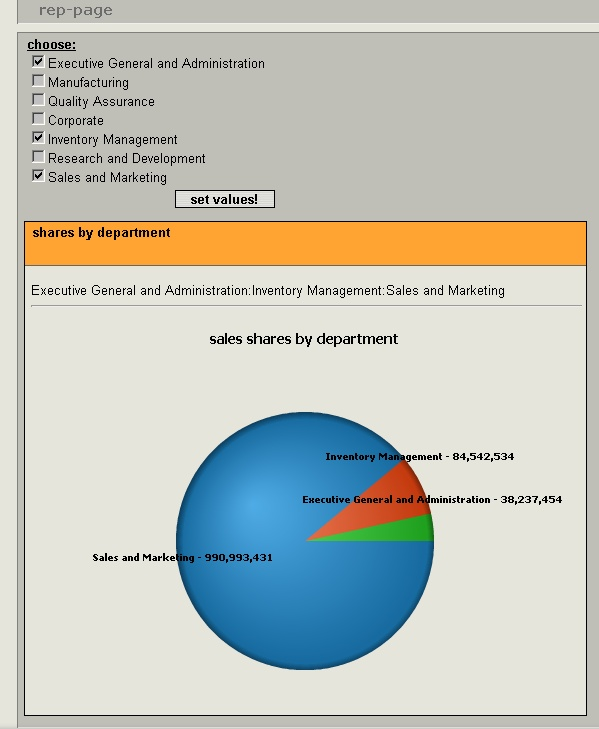
As you can see, above the chart I added the reference to our checklist, in order to see if its value changes correctly. To do that, you just need to put a piece of HTML code:
&LOV_DDG_CHECKLIST. <hr>
…to ‘Source’ box in properties of the region that contains the chart. This time we used the ampersand sign before the item name and a dot (and a space) after it – when used in HTML code, APEX items should be referenced like that.
Conclusion
As you could see, creating reports is relatively easy with APEX. Of course I showed here only its basic functionality, but even using the wizards you could see that there is a huge number of charts available. I also showed the possibility to use SQL as well as HTML – of course there is much more components you can implement – PL/SQL to interact with stored data or JavaScript & AJAX at web-design level. Considering that APEX is a free tool, I would strongly recommend at least familiarize with it!