18 Nov 2026 Data Visualisation Best Practices: A Guide to Designing Better Dashboards
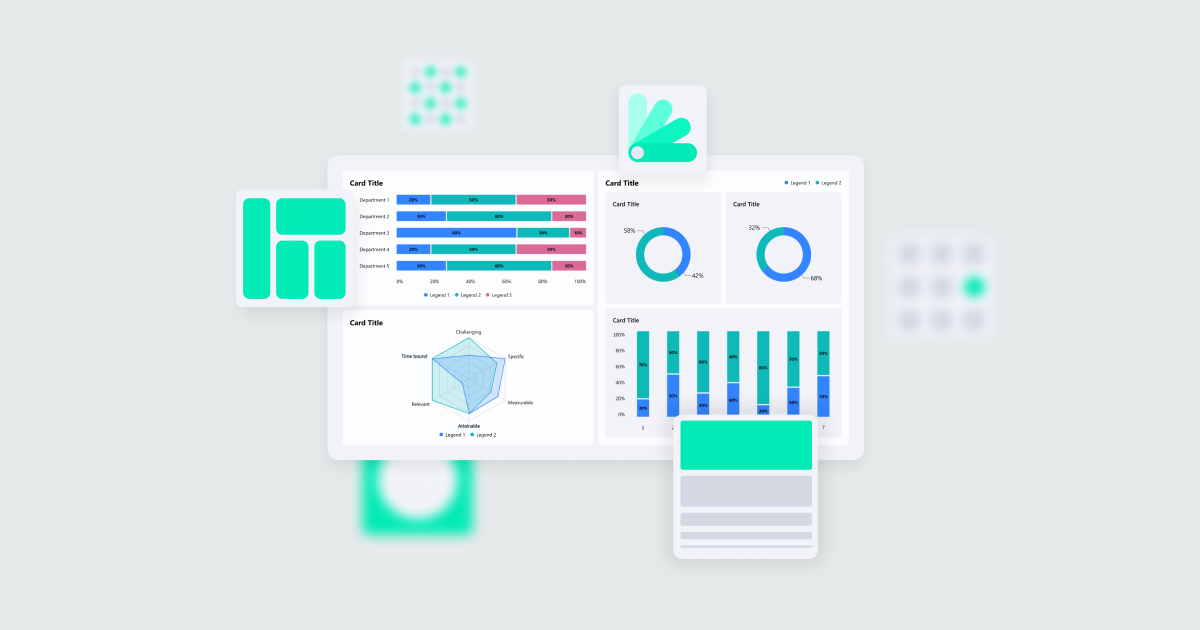
Numbers are fundamental to BI, but without proper presentation they can lose their impact. This is where data visualisation steps in, bringing analysis, design, and communication together. Every visual choice, from chart selection and the use of colour to the hierarchy of elements, influences how users interpret information.
Our goal is not simply to display data, but to make it understandable and highlight the insights users need. A fundamental knowledge of data visualisation helps designers to create clear, accurate, and usable visuals.
In this blog post, we’ll cover the core principles, help you to choose the right type of chart, and examine best practices for effective data-driven visuals.
Design Principles
Good dashboard design goes beyond aesthetics: it relies on clear principles that support effective communication and decision-making. Here at ClearPeaks, we follow these key dashboard design principles:
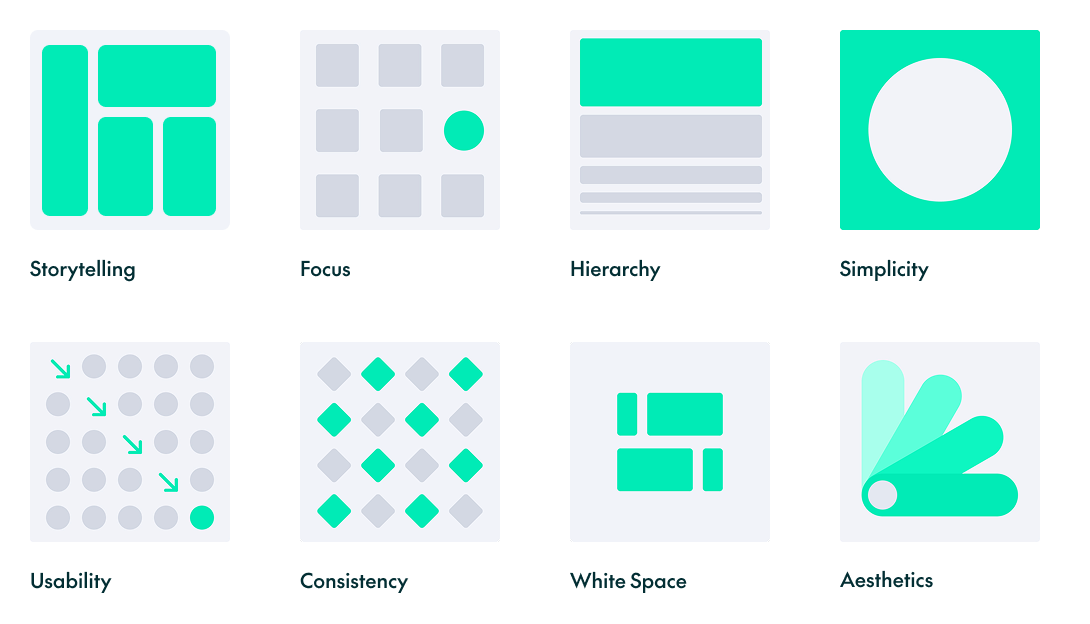
Storytelling: Communicate a clear and engaging narrative
Every element should contribute to conveying a meaningful story that resonates with users.
Focus: Highlight what’s most important
Eliminate distractions and guide users towards key elements or actions to ensure clarity and impact.
Hierarchy: Arrange for intuitive scanning
Place the most critical information at the dashboard’s primary focal point, typically in the top-left corner for left-to-right (LTR) languages or the top-right corner for right-to-left (RTL) languages; guide the remaining content downward to mirror the user’s natural reading flow. Use font size, weight, spacing, and contrast to reinforce this hierarchy and direct the user’s attention.
Simplicity: Keep it clean and straightforward
Remove unnecessary elements and focus on what the user needs to see.
Usability: Make it effortless
Design with the user’s goals in mind, prioritising accessibility and a seamless, interactive experience.
Consistency: Maintain uniformity across elements
Repeated patterns and cohesive styles create familiarity, making dashboards easier to scan and enhancing user confidence.
White Space: Use white space to improve clarity and reduce distractions
Use sufficient spacing between elements to group related information, making the dashboard more intuitive and easier to navigate.
Aesthetics: Make it visually appealing
The thoughtful use of colours, typography, layout, iconography, and imagery improves user satisfaction and creates a memorable experience.
Choosing the Right Chart
Once the foundations are in place, the next step is to choose the chart type that best tells your data story.
We’ve grouped the main chart types according to their purpose, helping you to select the most effective visualisation for the information you want to communicate:
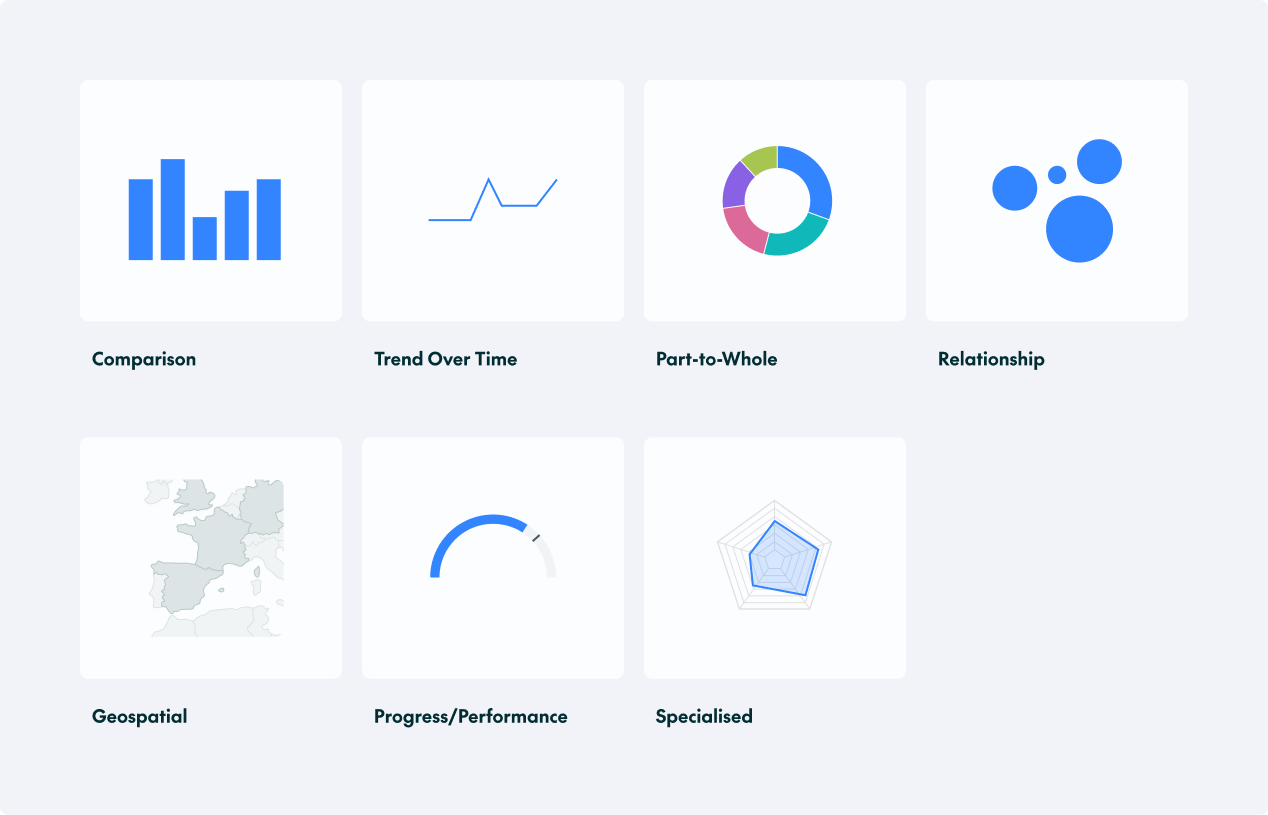
Comparison Charts
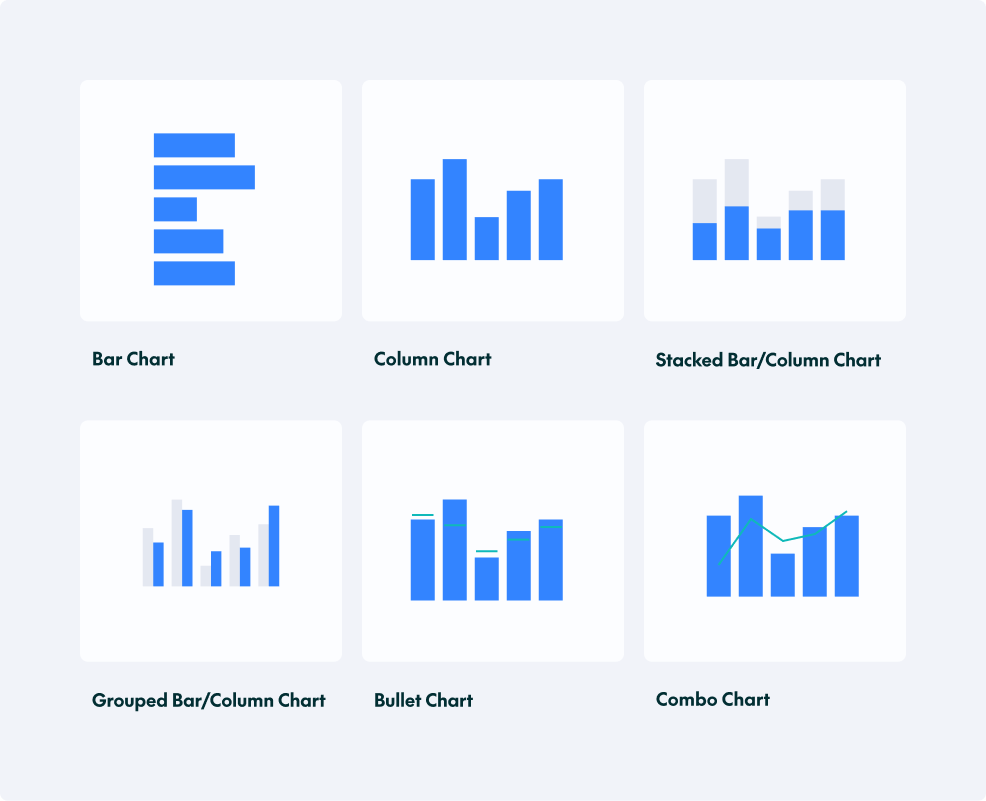
These charts are used to compare values across different categories or groups: for example, to compare performance across teams and departments, or to identify top or bottom-performing categories. The main comparison charts are:
- Bar Chart: Compares data across categories using rectangular bars.
- Column Chart: Similar to a bar chart but with vertical bars.
- Stacked Bar/Column Chart: Shows the composition of each bar, breaking it down into parts.
- Grouped Bar/Column Chart: Displays multiple datasets side by side for comparison.
- Bullet Chart: Compares performance against a target or range.
- Combo Chart: Combines two chart types to compare related measures within the same visual.
Best Practices for Comparisons
- Use column charts for time-based data and comparisons.
- Start the value axis at zero in bar and column charts to avoid exaggerating differences.
- Arrange categories in a logical order (for example, by descending value, alphabetically, or chronologically).
- Use appropriate spacing: leave enough space between bars for clarity but not so much that they seem unrelated.
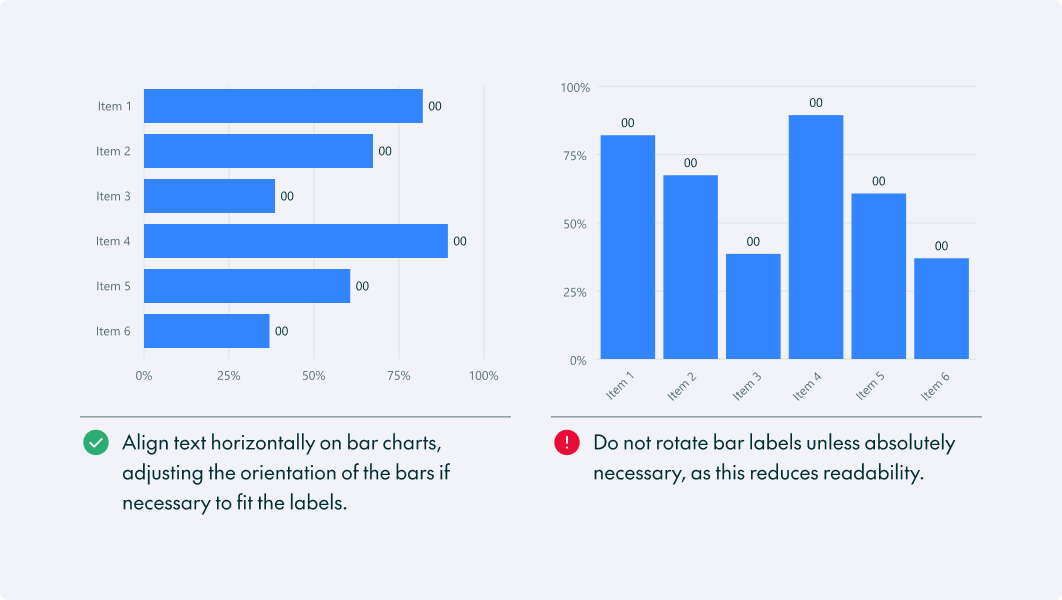
- If your categories have long names, use a horizontal bar chart. This keeps the text readable and avoids rotating the text.
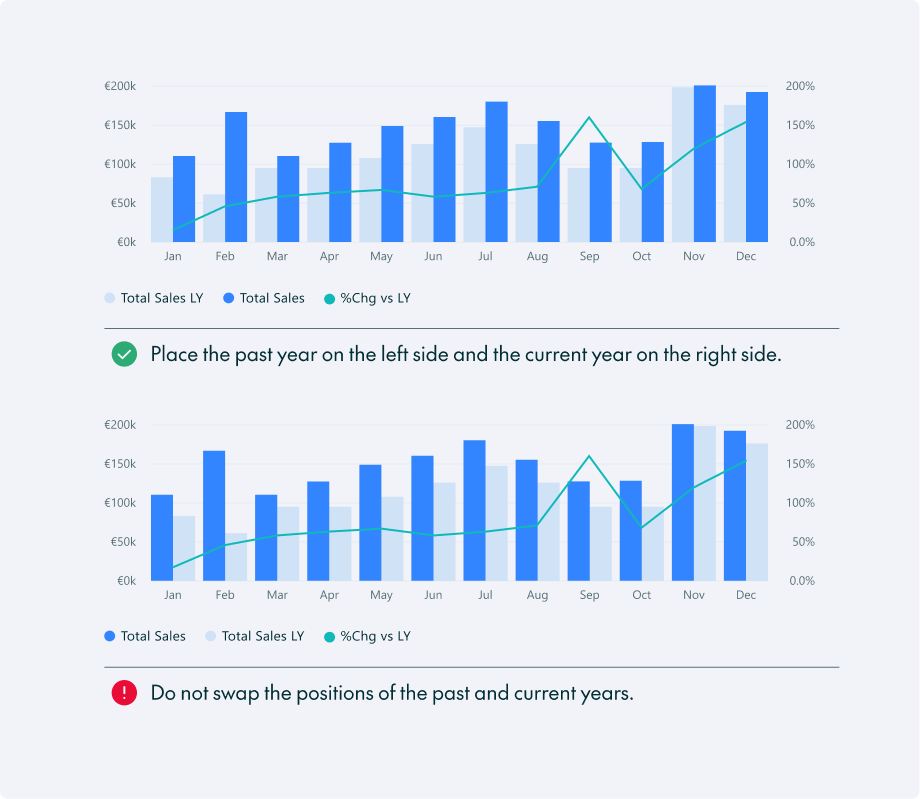
- When designing a year-on-year (YoY) comparison graph, use a grouped column chart with the previous year’s value on the left and the current year’s value on the right. Use a lighter colour for historical data and a darker or more prominent colour for the current year:
Trend-over-Time Charts
These charts are ideal for visualising changes over time, whether you’re tracking performance across days, months, or years, or monitoring pipeline growth.
The main chart types are:
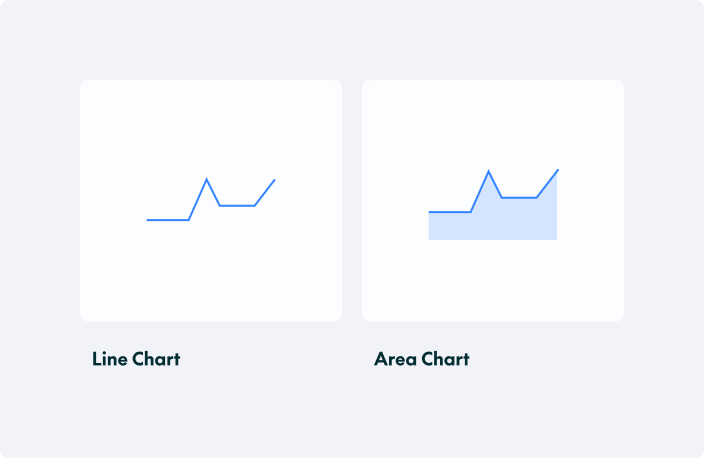
- Line Chart: Displays trends over time with data points connected by lines.
- Area Chart: Like a line chart but with shaded areas under the lines.
Best Practices
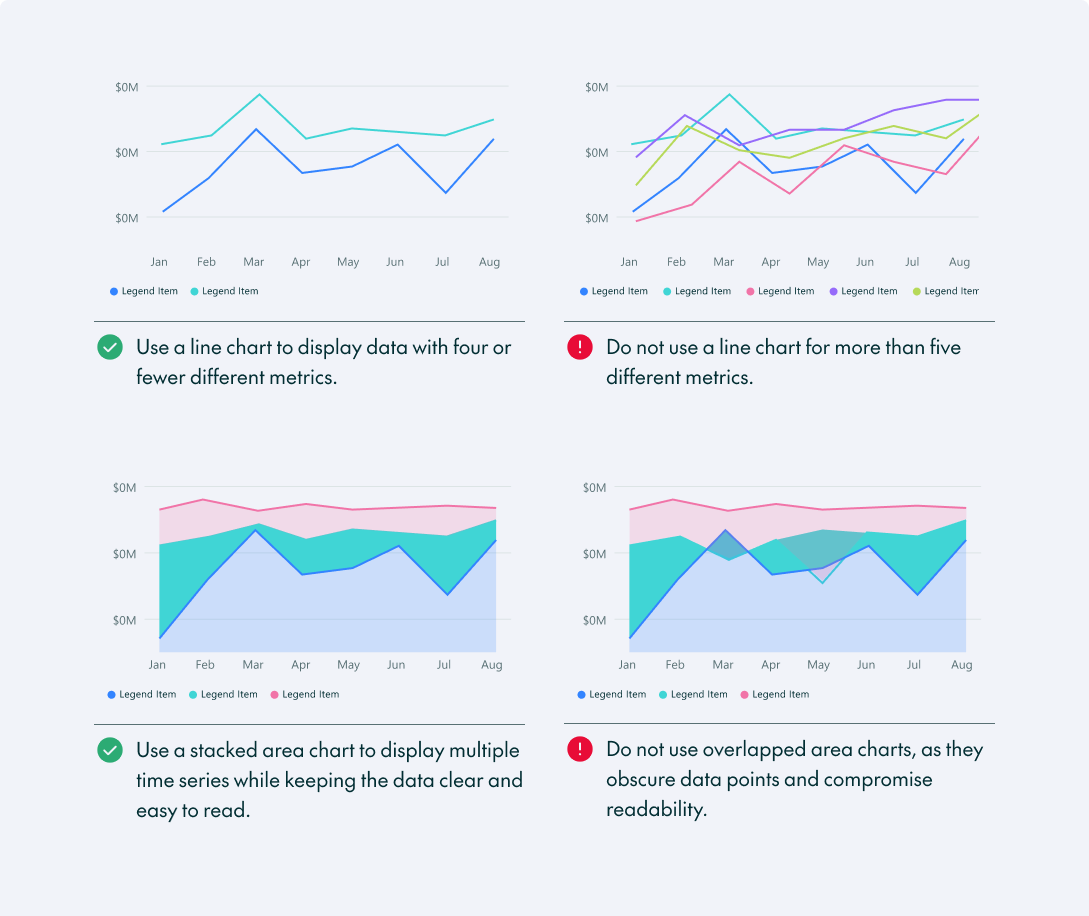
- Use contrasting colours, line styles, or patterns to distinguish the individual series when displaying multiple datasets.
- Highlight the most important line. If your goal is to show how your company is performing compared to your competitors, make your company’s line thicker and the competitors’ lines thinner: this tells the reader exactly where to look.
- Avoid clutter with too many lines or excessive design elements; limit the chart to 5 lines if possible.
- Avoid using line charts for discrete, non-sequential categories.
Many of these principles also apply to area charts, although additional considerations are necessary:
- When using multiple areas, make sure the colours are distinct enough to distinguish each segment or category.
- Avoid using area charts when the differences between data points are very small, as the visual area can exaggerate minor fluctuations.
- Overlapping area charts can obscure data, making it hard to distinguish trends and values.
Part-to-Whole Charts
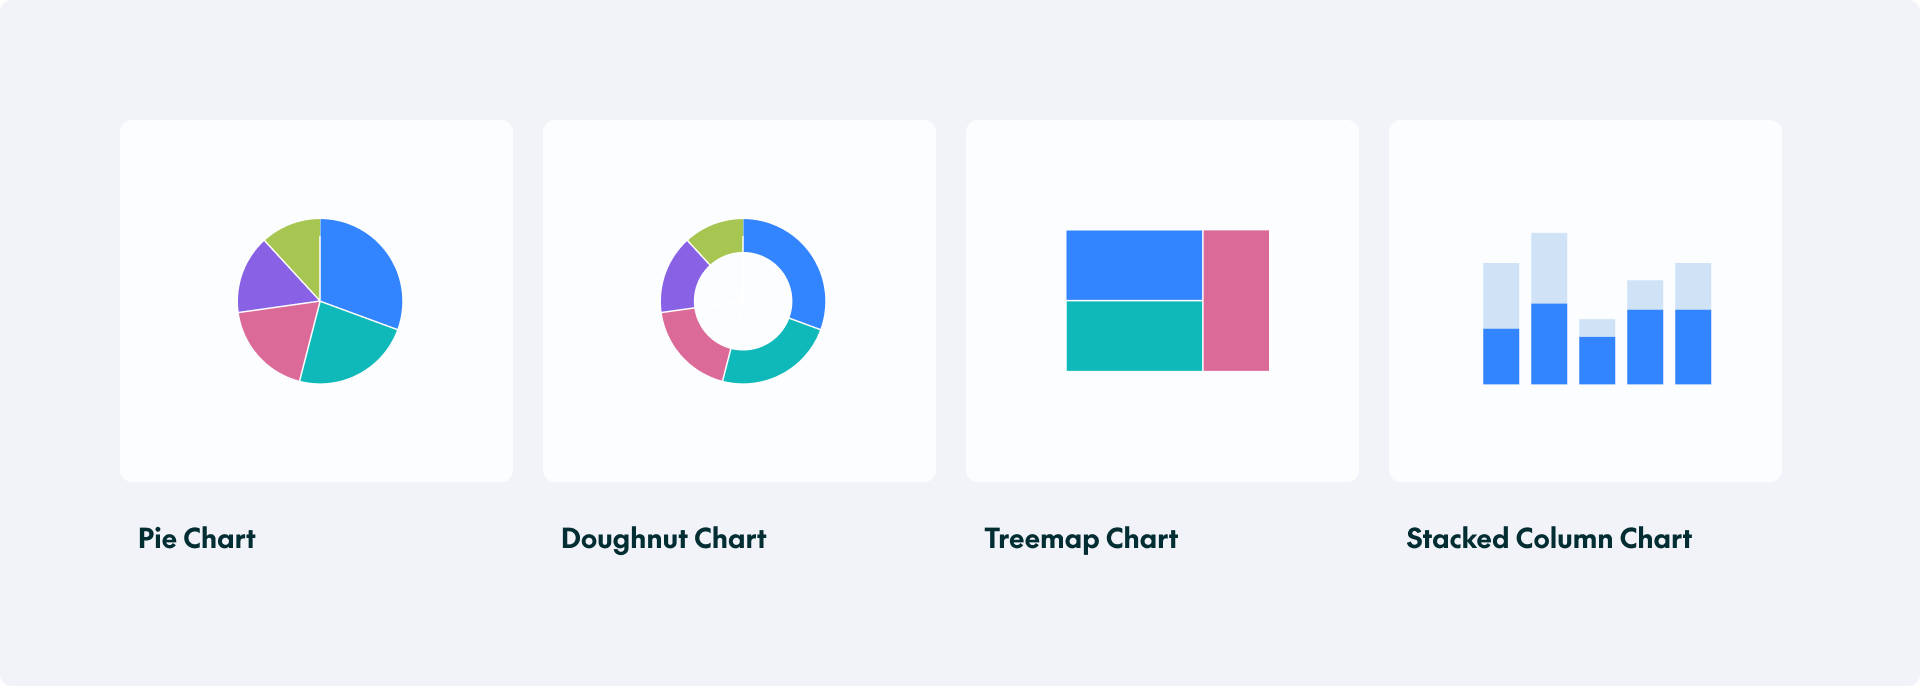
Use these charts to show how individual components contribute to an overall total, helping users to understand the proportions represented by different categories or segments.
- Pie Chart: Represents proportions as slices of a circle.
- Doughnut Chart: A variation of the pie chart with a hole in the centre.
- Treemap Chart: Uses nested rectangles to represent part-to-whole relationships.
- Stacked Column/Bar Chart: Shows the composition of each column/bar, breaking it down into parts.
Best Practices
Pie and Doughnut Charts
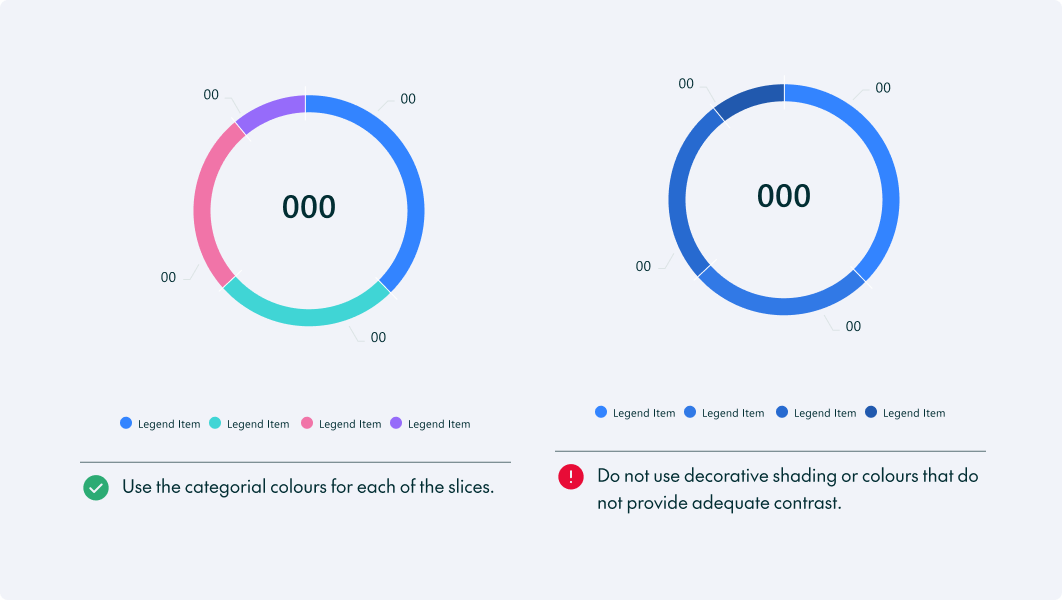
- Limit pie or doughnut charts to a manageable number of slices, ideally no more than five or six. Too many slices make it hard to read and interpret.
- Arrange the slices in descending order of size (largest to smallest) or by importance, starting from the top.
- Pie and doughnut charts aren’t well-suited to precise comparisons between similar-sized slices.
- Use the doughnut hole to display the most critical takeaway, for example, total revenue.
- Use contrasting colours to make the slices easily distinguishable. Avoid too many similar or overly bright colours that can confuse viewers.
Treemap Chart
- Limit the number of categories. Avoid too many small rectangles, as they make the chart harder to read and compare.
- Keep labels readable. Display labels only when there is enough space and use tooltips to provide details for smaller areas.
Stacked Area Chart
- Use a consistent stacking order: keep categories in the same order throughout the chart to make changes easier to follow.
- Limit the number of series: too many stacked layers make it difficult to distinguish categories and identify trends.
Relationship Charts
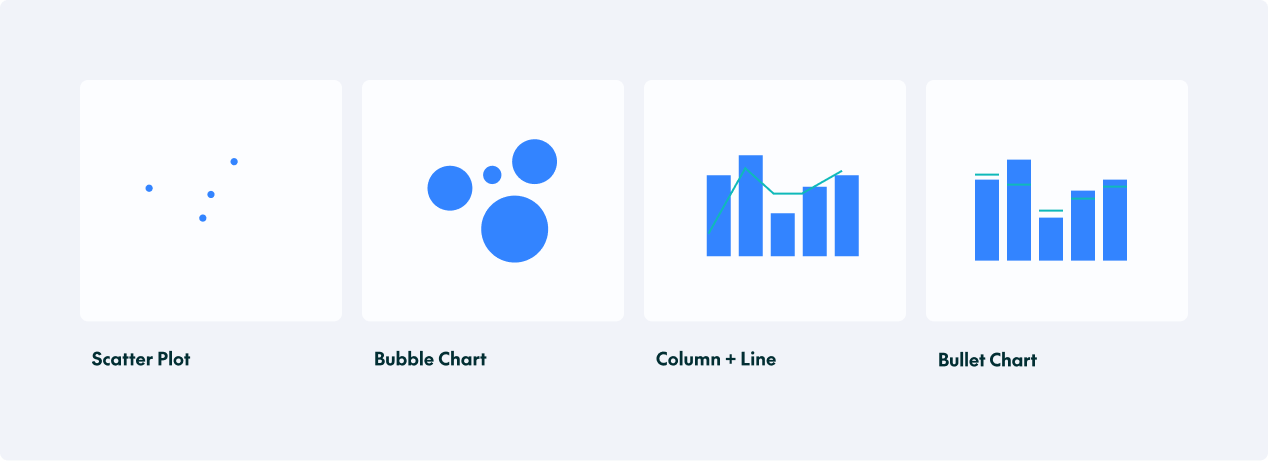
Relationship charts help reveal connections and correlations between variables, making it easier to identify patterns, trends, and potential relationships within the data.
- Scatter Chart: Displays relationships between two variables.
- Bubble Chart: Adds a third dimension using the size of the bubbles.
- Column and Line Chart: Enables comparisons between two related datasets or perspectives.
- Bullet Chart: Compares performance against a target or range.
Best Practices
- When using scatter and bubble charts, use transparent or smaller markers to reduce overlap and improve readability, especially in large datasets.
- Apply colour strategically to differentiate categories and spotlight key data points without cluttering the visual.
- When using a column and line chart, compare complementary metrics (such as actual performance against targets) over the same time period.
- For bullet charts, include data labels for actual and target values to make performance comparisons easier and more precise.
Geospatial Charts
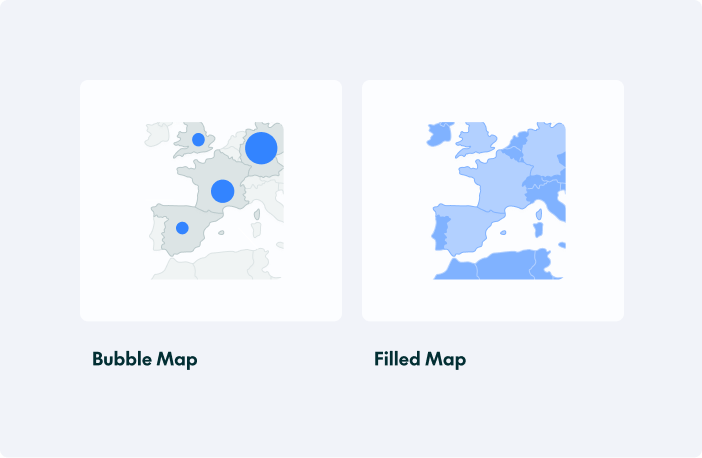
These charts display data in relation to geographic locations, helping users to identify trends, patterns, and variations in density or distribution across different regions.
- Bubble Map: Displays data using bubble size and location on a map.
- Filled Map: Uses colour shading to represent values across a geographical area.
Progress / Performance Charts
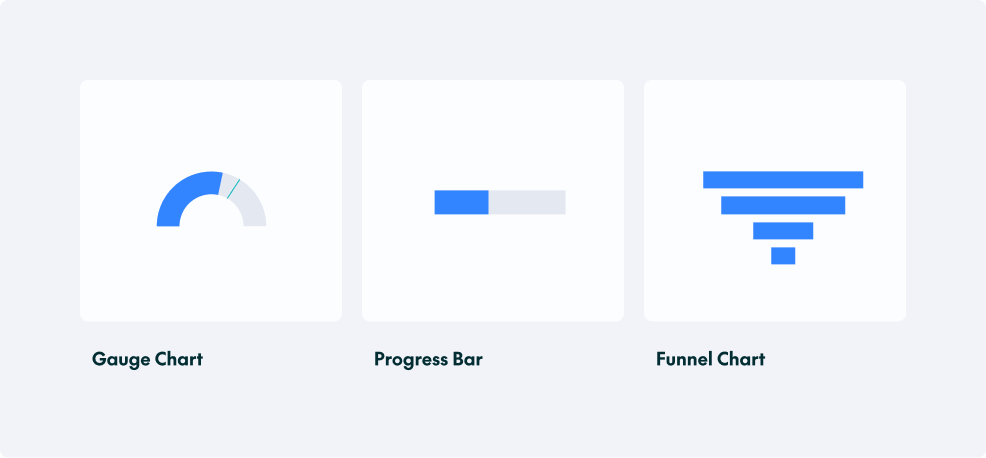
These charts measure progress towards a goal, assess performance, or track different stages of a process.
- Gauge Chart: Shows progress towards a goal.
- Progress Bar: Displays completion levels of a task or metric.
- Funnel Chart: Visualises stages in a process and conversion rates.
Specialised Charts
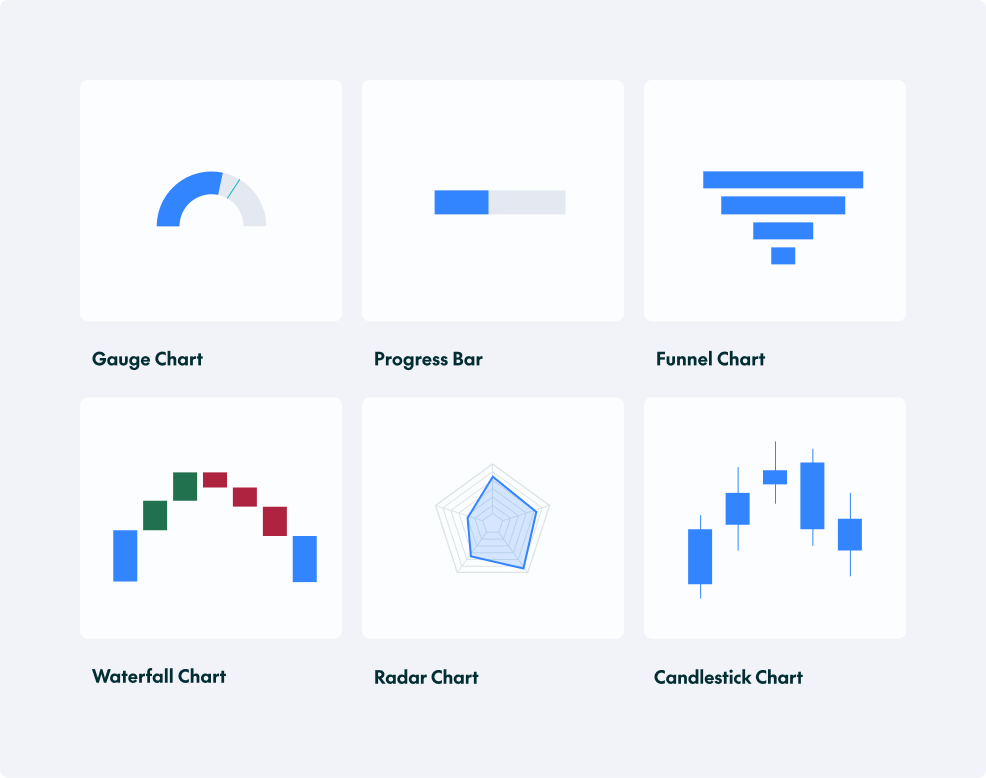
Specialised charts are designed to visualise specific types of data or complex relationships that standard charts cannot represent easily, helping to communicate insights more clearly and effectively.
Some of the most common examples that we use here at ClearPeaks are:
- Waterfall Chart: Displays cumulative effects of sequential data points.
- Radar Chart: Compares multiple variables using axes that radiate from a central point.
- Candlestick Chart: Displays open, high, low, and close values to track price movements over time.
Best Practices for Waterfall Charts
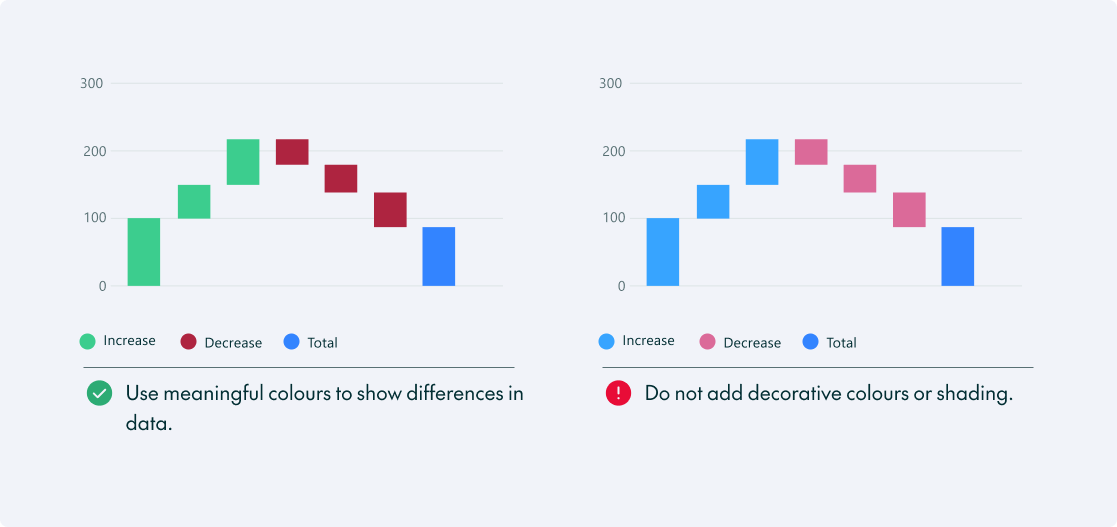
A waterfall chart shows how a series of changes transforms an initial value into a final value, highlighting the contribution of each step.
Waterfall charts are complex, so we need to take these best practices into account:
- Use contrasting colours to distinguish positive and negative contributions and highlight significant changes.
- Avoid overcrowding with too many stages; focus on the most relevant.
- Clearly indicate initial and final values for context.
- Arrange stages logically to maintain the process flow.
Tables
When presenting large amounts of detailed data, tables are often the most practical option. Although they generally require more careful reading than charts, they allow users to examine individual values and make precise comparisons.
We could write a whole blog post about guidelines for tables, but here are the most important ones:
- Readability and Alignment: In left-to-right reading contexts, text should be left-aligned, except for numbers, which should align to the right to allow easier comparison of values.
- Formatting and Design: Disable autosize and set consistent column widths for a cleaner, professional appearance.
- Highlight Key Metrics: Place totals and summaries prominently, ensuring they are visually distinct (e.g., bold or shaded).
- Desktop vs Mobile: Designing for mobile screens requires a flexible approach, and options include enabling horizontal scrolling, creating a responsive layout, showing only the most important information, or using collapsible columns. To enhance usability, the first column should be fixed, ensuring its content remains visible even as users scroll horizontally.
KPI Cards
KPI cards are amongst the most widely used dashboard elements, especially for C-level executives, as they present key information at a glance.
When building KPI cards, we need to:
- Display only one key metric per card to avoid overwhelming users; keep it simple and direct.
- Add labels and timeframes, together with relevant comparisons (e.g., “vs last month”), to provide context.
- Use large, legible fonts for key numbers and maintain sufficient contrast to ensure readability.
- Ensure all KPI cards follow a uniform size, style, and alignment for a polished look.
Best Practices for Impactful Visuals
Now that we’ve seen the main visualisation options, let’s dive into some best practices that apply to all of them:
- Know your audience: As we mentioned in our previous dashboard design post, it’s crucial to understand your users and their needs. Executives might need high-level summaries with KPIs and easy-to-read charts, whilst analysts might want deep dives with detailed tables.
- Keep it simple: Remove non-essential elements like heavy grids, borders, or labels that are redundant; the focus needs to be on the important data.
- Avoid 3D charts: 3D effects can distort proportions and make it difficult to compare values.
- Design for accessibility: We need to consider users with colour vision deficiencies and design accordingly.
- Sort your data: Unless there is a natural order (such as dates), sort bar charts from highest to lowest to make comparisons instantly readable.
- Combine different chart types: Rather than relying exclusively on bar and column charts, consider using different chart types where appropriate, as variety can make the dashboard more engaging and help insights to stand out.
Now that we’ve covered general best practices, let’s take a detailed look at the important guidelines for some of the core visual elements:
Best Practices for Colours
Consistent use of colour helps users to recognise patterns, make comparisons, and follow trends across dashboards.
It’s not only the brand colours that we need to focus on when choosing palettes for our dashboards.
Primary Brand Colour: This is the core visual identifier, reserved for logos, primary buttons, and high-priority calls to action.
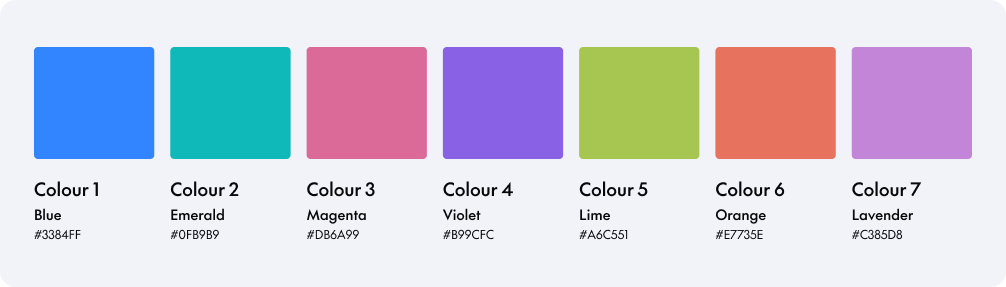
Categorical Colours: These distinguish unrelated data categories, helping users to identify and compare them quickly. The colours should be applied in the specified order shown below to maximise contrast between neighbouring colours:
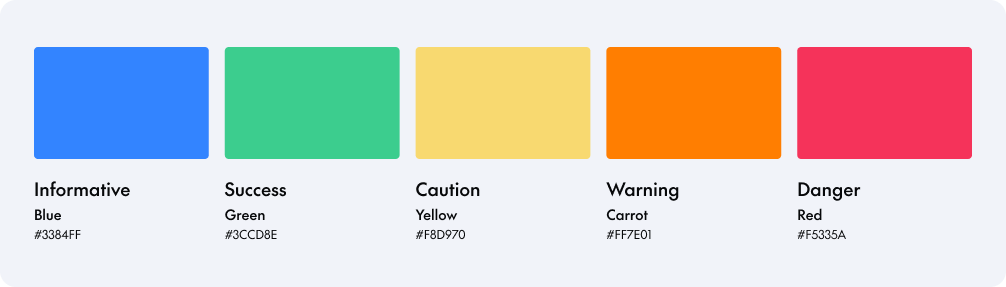
Semantic Colours: These colours communicate the meaning or urgency of different statuses: informative (blue), success (green), caution (yellow), warning (orange), and danger (red). Use them consistently in charts, KPI cards, and other dashboard elements to help users to interpret performance, alerts, and outcomes:
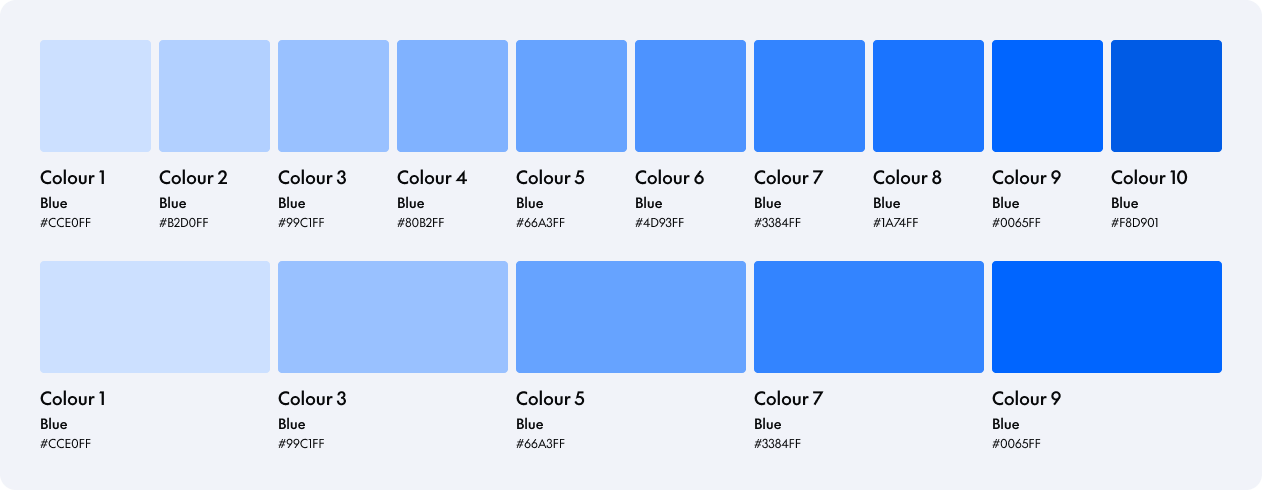
Sequential Colours: These colours are used to represent ordered or continuous data, where the progression of colour intensity reflects changes in value or magnitude. They help users to understand how data increases or decreases by applying a consistent gradient, typically moving from lighter tones for lower values to darker tones for higher ones. They should be used in visuals such as charts, heat maps, or KPIs when displaying numerical ranges, trends, or distributions. Their use can enhance data storytelling by providing intuitive visual cues about scale, intensity, and progression.
The palette contains 10 tones. If fewer tones are required, select every other colour to maintain a consistent progression, as in the example below:
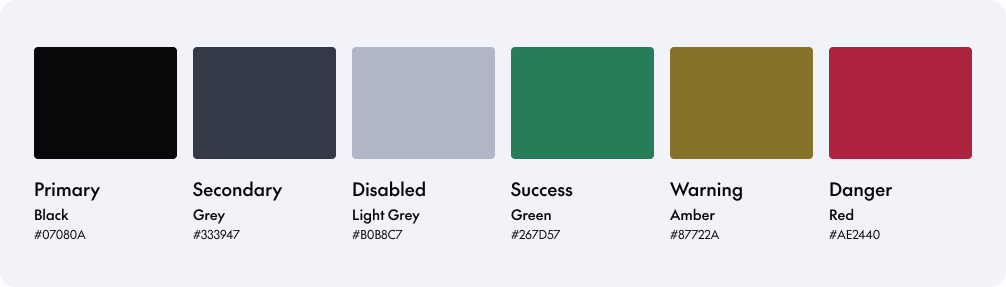
Text Colours: Text colours are used exclusively to style written elements within the dashboard, ensuring clarity, hierarchy, and accessibility. The palette includes primary, secondary, and disabled text colours, together with variants for success, warning, and danger messages. These provide alternatives to the semantic colours used in charts, which may not offer sufficient contrast when applied to text. These colours are intentionally subtle and functional, designed to support readability without distracting from key data visuals:
Now that we’ve reviewed these concepts, let’s continue looking at best practices when working with colours in dashboards.
- Choose the palette intentionally: Select colours with a clear purpose in mind, not just for decoration. Colour is fundamental when we want to highlight information or when there’s an alert that the user needs to see as soon as possible.
- Don’t rely only on colours: Ensure the charts remain understandable if printed in black and white, as well as for users with colour vision deficiencies, by incorporating labels or other indicators.
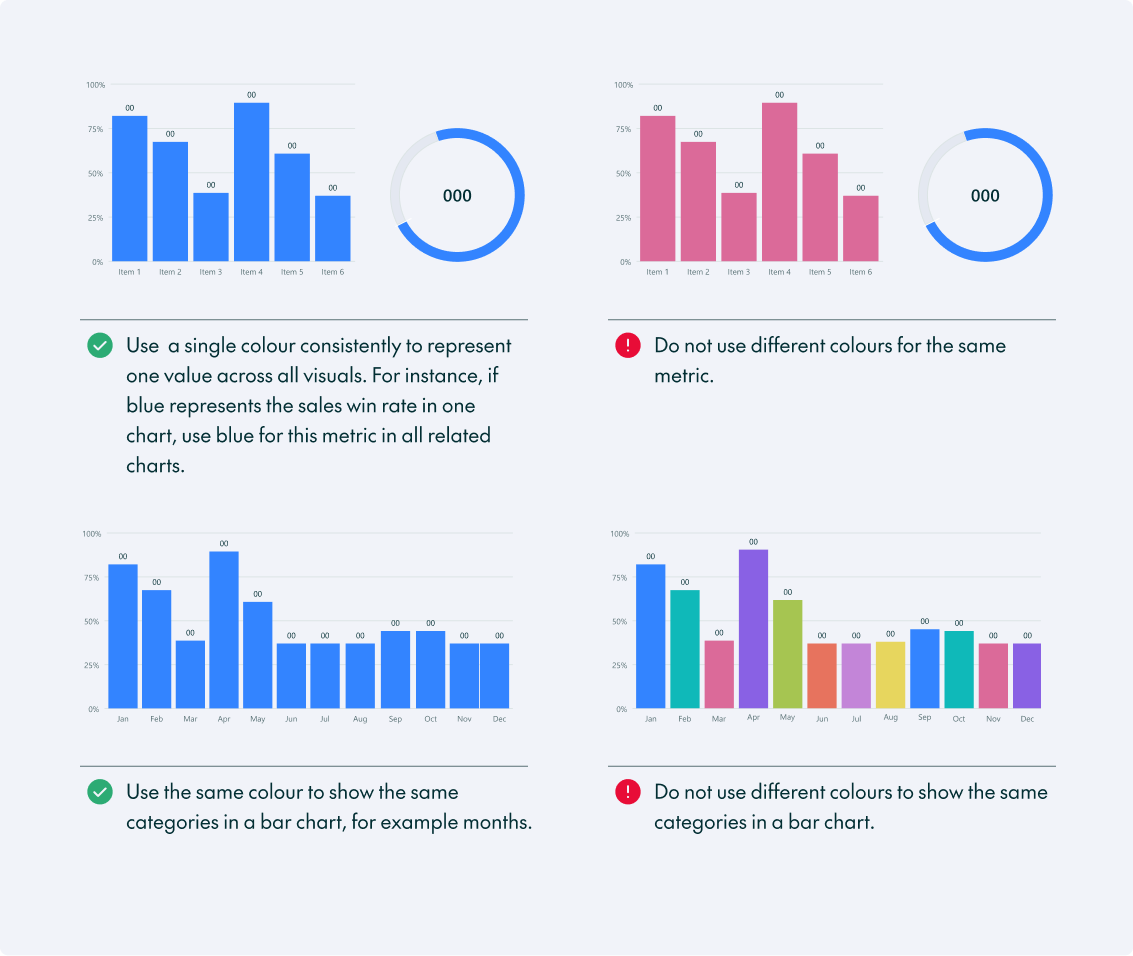
- Be consistent: Standardise colour choices across all dashboards so that users can instantly recognise key metrics.
- Assign one colour per metric: Use the same colour consistently to represent a specific metric across all charts. For example, if you choose blue for “total revenue”, this metric should always be blue.
- Limit colour variations for categories: Use a single colour when comparing the same metric across different categories, such as regions or sales representatives.
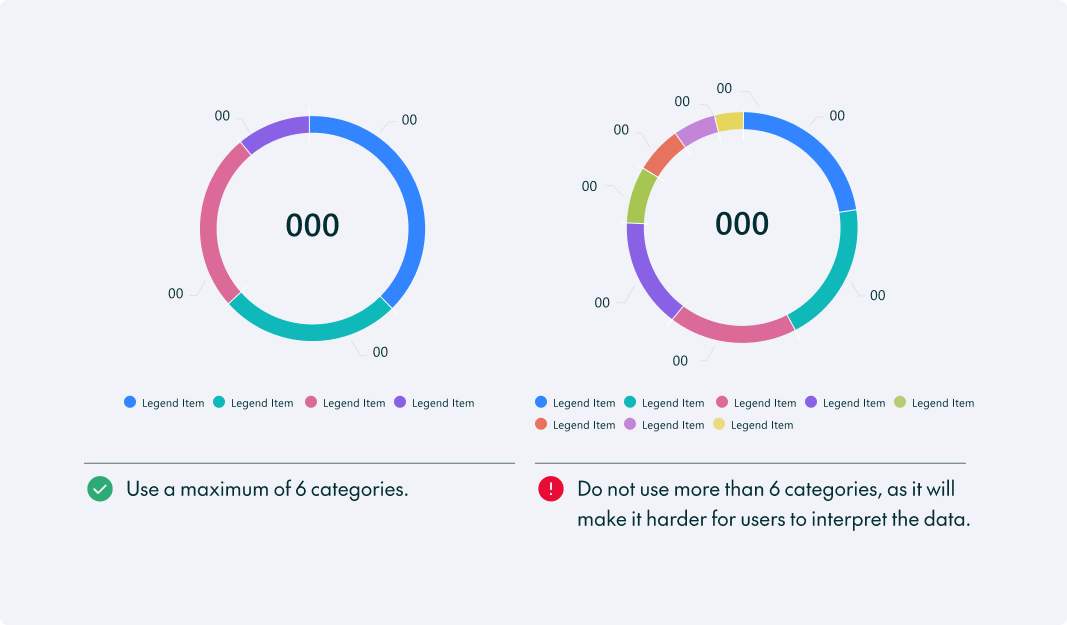
- Use a maximum of six categorical colours per chart: more than six can make the chart harder to understand, but if you need more, consider using other visual cues, for example positioning or additional labels.
Best Practices for Text
Whilst charts may seem like the most important elements of a dashboard, text plays an equally important role in making data accessible and understandable.
- Make it clear: Choose chart titles and headings that clearly communicate the information being presented.
- Keep labels concise: Use short, descriptive labels for charts and metrics to avoid clutter.
- Prioritise readability: Choose appropriate font sizes. Headings should be larger than data labels; avoid overly decorative fonts that reduce readability.
- Use consistent terminology: Apply the same terms across all elements to prevent confusion and promote familiarity.
- Provide context with tooltips: Add concise tooltips for complex metrics or data points without overwhelming the main view.
- Limit the use of all caps and bold: Use only for key headers and metrics to maintain clarity and direct attention to the most important information.
Best Practices for Numbers
Numbers are behind every data visualisation, but how we present them can make a huge difference.
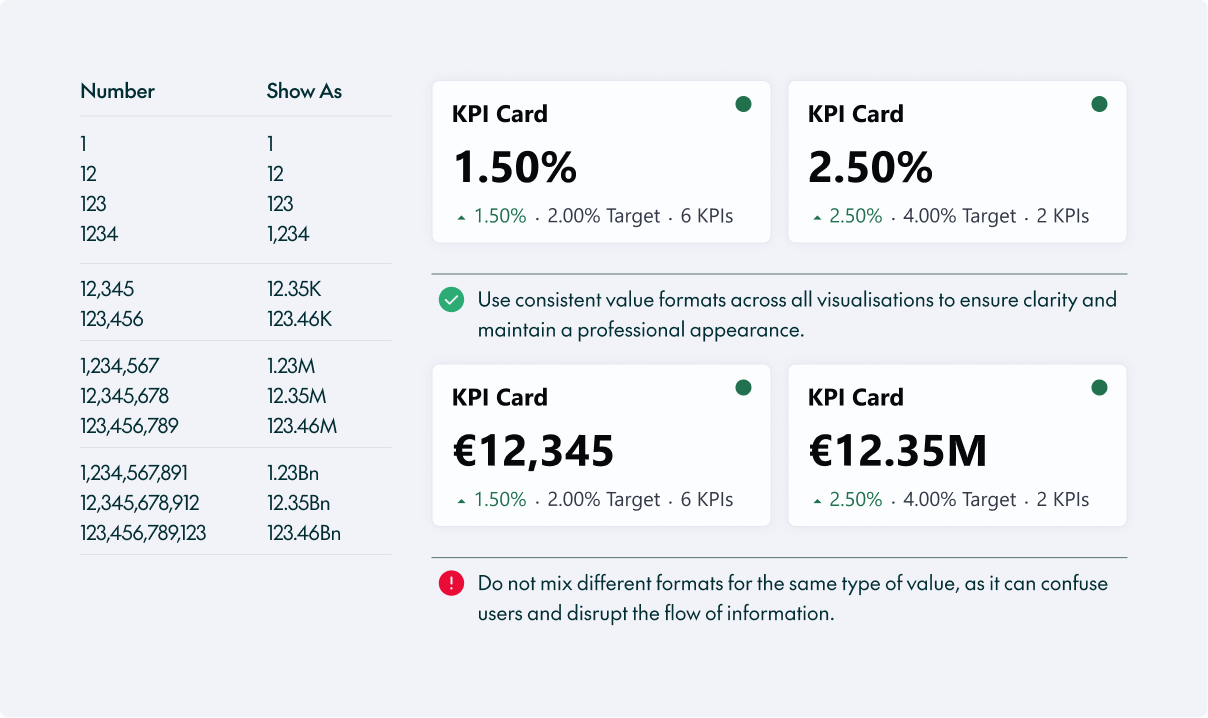
- Keep numbers concise: Show up to four digits on chart axes or KPI cards, including up to two decimal places; use K, M, or Bn to abbreviate larger numbers.
- Maintain consistency: Values should always be displayed consistently across all visualisations to maintain clarity and a professional look.
- Use standard number separators: Use a decimal point for decimals and a comma to separate thousands.
Best Practices for Legends and Axes
Legends and axes may occupy very little space on the screen, but they provide essential context for interpreting charts accurately.
- Use clear language: Avoid unfamiliar acronyms and ambiguous abbreviations in legends and axis labels.
- Place legends strategically: Align below the chart whenever possible.
- Remove unnecessary legends: A single data category or colour doesn’t need a legend.
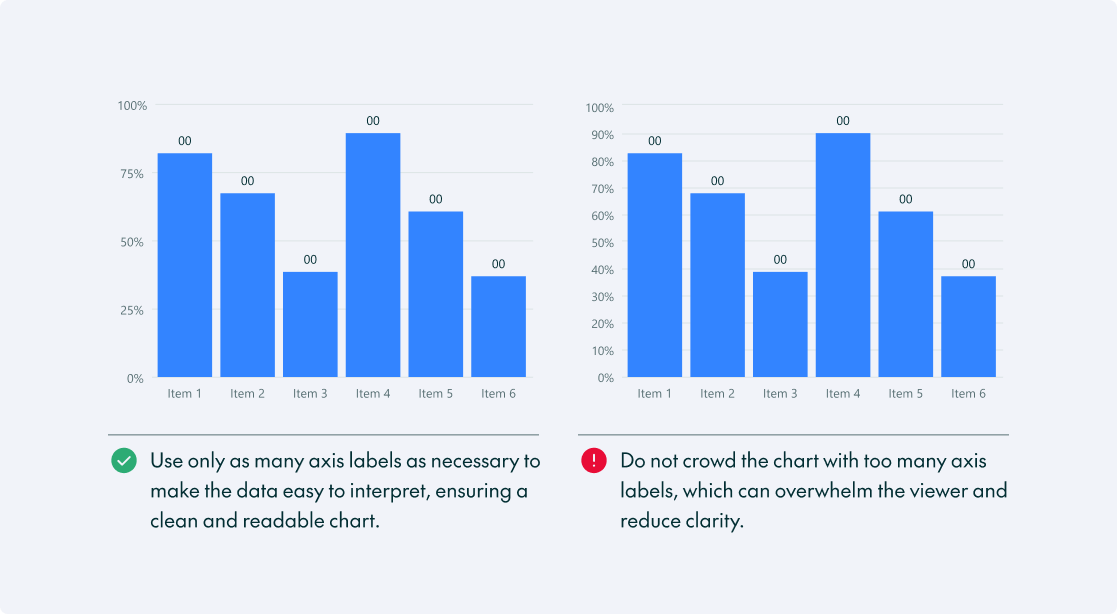
- Optimise axis labels: Aim for sufficient detail without clutter.
- Avoid repetition: If multiple charts on a dashboard share the same legend, show it only once.
Conclusion
We’ve explored the fundamentals of dashboard design, from core principles and chart selection to practical techniques for creating clear, accessible, and effective data visualisations.
Remember that best practices are guidelines, not limitations. Every context is different, and what works well in one solution might not work in another. It’s essential to know the reasoning behind each recommendation, so you can adapt when necessary and keep the user and the story at the centre of every design.
Good design starts with understanding the rules, but great design means knowing when to break them! Here at ClearPeaks, we combine technical expertise with user-centred design to create dashboards that communicate information clearly and support better business decisions. Contact us if you want to take your data to the next level.