Seeing is Believing

Solve complex data analysis challenges with the best visualisation tools, coupled with our expertise in powerful infographic design and advanced analytical techniques.

Our Offerings

High Impact Management Dashboards

Creating high impact management dashboards has evolved into an artform in which key business information is presented through a clean and uncluttered design, and which allows the user to navigate into focus areas in an intuitive and simplistic way. With years of development in this area, we have mastered this art and pride ourselves in being absolute leaders in delivering the highest quality deliverables to our customers.


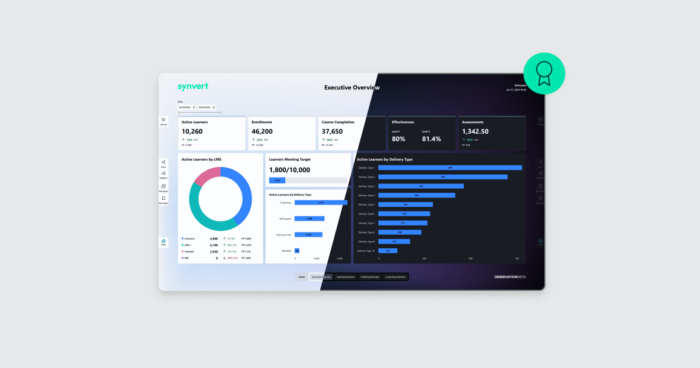
Self-service Modern BI

Ensuring your business users are in position to create their own analyses is essential for efficient business measurement and improvement, and we will ensure you achieve this business empowerment. We will work with you to deploy the most appropriate self-service tool to meet your business needs and budget.


Data Discovery

Different from classic business dashboarding and reporting, data discovery uses visual and algorithmic analysis techniques, often applied to big data environments, to identify patterns or behavioural trends or exceptions. We offer comprehensive services and leading technologies to enable your data discovery journey.

We´re never resting on our laurels when we´ve still got the future to invent! Our team is always striving to stay ahead of the pack and has a proven track record of delivering innovations and “cool things”. You can see some examples here.

Oracle BI Security Dashboard

The roles and responsibilities of business users alter frequently due to changes in their respective jobs or in the organizational hierarchy of the company; as part of maintaining data security, it is mandatory to review the entire access map for users across all catalogues and dashboards in Oracle BI on a regular basis to ensure that there is no data leakage by any unauthorized user. We have created a separate Oracle BI dashboard to accomplish this objective.


The Oracle BI Security Dashboard gives a comprehensive overview of user accesses in Oracle BI; its implementation promises to ease the task of maintaining data security in any organization.

ClearPeaks Visualisation Plugin

It is hard to ignore the weight that the most advanced and interactive visualisations carry in today’s data-centric world; we often receive requests to visually enhance dashboards and reports to achieve a look that is flashier than the standard. We have developed a set of custom tools that allow configurable visualisations to work natively in modern browser technologies.


Our Visualisation Plugin not only adds new capabilities to existing chart types, but also includes new highly interactive and customizable visualisations.

Booklet Generator – Sharing dashboards as PDFs

Exporting and sharing dashboards is a common customer request; to meet this demand, we have developed a plugin for Oracle BI that enables you to combine and export multiple dashboard pages into one single PDF, maintaining the filters and data security that apply to the user. You can also export individual dashboards as PDF ready for printing and distribution.

Hierarchy Builder

Obtain immediate and intuitive insights into an organizational structure with the ClearPeaks Hierarchy Builder. You can use it not only to depict the traditional organizational chart, but in any hierarchy that has parent-child relationships: regional concepts, products, services, systems, income and revenue sources, customer bases, marketing campaigns, processes, bills for material, accounts charts, etc. The technology-agnostic tool, boasting a responsive design, features a zooming functionality and a print and distribution component.

IxD solution for Oracle Dashboards

Developing a dashboard is not only about designing a tool to analyse the business, but also about improving the user experience as well as enriching the visuals.


That is why we have developed the IxD Solution for Oracle Dashboards: a tool – built on Oracle Analytics Cloud and using JavaScript libraries – that allows users to design and populate their own interactive dashboards using Oracle BI report elements. The result is a customized, flexible and interactive dashboard with some amazing features.

“Email from Chart” Extension

We recently developed a very useful extension that enables you to send an email directly from a specific chart within a dashboard. The email automatically includes a visual of the chart and all relevant fields are pre-filled with the correct information:


  • From: Pre-filled with the email ID of the logged user
  • To field: Pre-filled with the owner of the related data (as indicated by a Data Governance layer), more contacts can be added in cc
  • Subject Title: Name of the chart and filtered period


It is an easy-to-implement dashboard tool that will enhance productivity and makes all the difference when it comes to team collaboration!


Available for OBI or web-based applications.

Focus

Technologies

Oracle Partner Logo
Tableau
Microsoft Partner logo
Qlick

Related

Blog Articles

Contact Us

Get in Touch to Find Out How We Can Help You