21 Ago 2017 Clearpeaks´ Visualisation Plugin
Introduction
If you’ve worked with any kind of data, you know how harrowing reading rows and rows of numbers can be. It isn’t easy to wade through all of those numbers and easily figure out what they mean. That’s the case where visualisation comes to the rescue. Visualisation de-mystifies the data and helps decision-makers derive actionable insights from it. The whole idea of this blog is to delve into the blossoming world of data visualisation. It is hard to ignore the weight that more advanced and more interactive visualisations carry in today’s data-centric world. It is common to get requests to add visualisations or other improvements to the dashboard in order to provide a flashier look or design. Typically, these kinds of requests are handled by embedding HTML and JavaScript to provide data driven, custom visualisations. At ClearPeaks, we have developed a set of Custom Visualisations that allow configurable visualisations to work natively in modern browser technologies.
1. Motivation
Following are the main Key factors, which drive the need for Custom Visualization Plugins:
| • | Add new Capabilities to existing chart types for modern reporting tool. |
| • | Add brand new Visualization types. |
Let us discuss each one of these points in detail.
Add new Capabilities to existing Chart types. How many times have you received a request that you just could not meet with native chart types because there was not enough ability to customize the chart? For example, imagine that you want to build a line/bar combo chart with a third distinct Y-axis. Oh sure, you can map three metrics, but if the metrics do not have the same unit of measurement or the same scale, then you are screwed. To handle these kind of scenarios, we have to use these Pre-build custom Plugins.
Add brand new Visualisation types. There is huge scope for improvement in terms of Interactive Visualizations with traditional charts Library and there are so many new visualization Patterns we can build using JavaScript like Donuts, Meters, Pokers or Animated Donuts etc, which is hard to visualize with Traditional Reporting tools.
2. How does it work?
ClearPeaks’ plugin is solely based on native browser technologies and doesn’t require client side plugins like Flash or Java. The plugin is built with jQuery and SVG. With the ClearPeaks plugin referenced in your webpage, we are ready to use a wide range of highly customizable charts. In case of the Oracle BI implementations, where their servers are isolated from the Internet and protected in internal LAN segments, referencing these resources from Oracle BI means having to first deploy them in the WebLogic Server as static resources. ClearPeaks’ plugin allows us to easily customize the design of a chart, like its size, colour and fonts. Also, it is possible to include or exclude parts of the charts.
3. Data Visualization Graphs
In this section, we present some of the visualization graphs developed by our team:
| • | Gauge Chart: Gauge provides a rich amount of configurable items, which can set options we pass through the plugin invocation. |
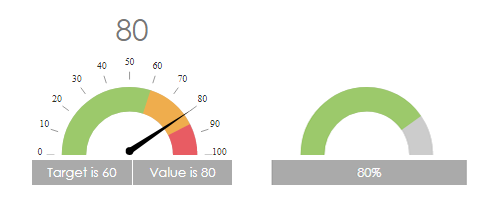 | |
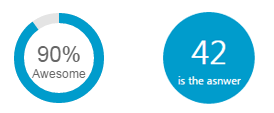
| • | Donut Chart: A Donut Chart is a circle chart that shows the percentage of an activity. |
 | |
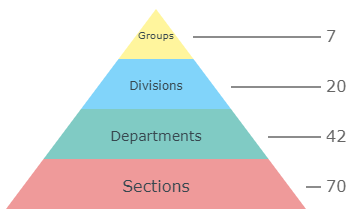
| • | Pyramid: A Pyramid chart displays a single series of data in progressively decreasing or increasing proportions, organized in segments, where each segment represents the value for the particular item from the series. |
 | |
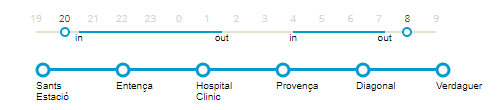
| • | TimeLine: Timeline allows to visualise the starting and ending of an activity. |
 | |
Visualisation also includes the below charts.
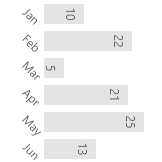
| • | Horizontal Bar Chart: |
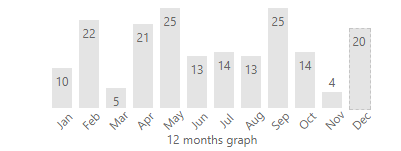 | |
| • | Vertical Bar Chart: |
 | |
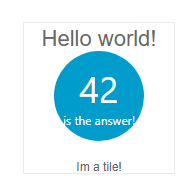
| • | Bubble Chart: |
 | |
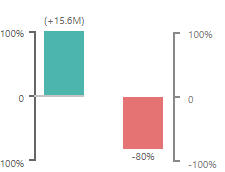
| • | Percentage Bar: |
 | |
Conclusion
ClearPeaks’ custom visualisation plugin provides some of the best and most unique visualisations available. The charts are highly customizable in terms of size, colour and design. Better yet, the visualisations can be implemented in OBIEE or any custom html reports or dashboards.
Click here if you would you like to know more about this innovative solution!