21 May 2025 Oracle Analytics Server 2025 Release Highlights
Here at ClearPeaks we keep a close eye on Oracle Analytics updates and releases, both for OAC (Oracle Analytics Cloud) and OAS (Oracle Analytics Server) versions. This year Oracle has presented its 2025 version of OAS, with new features and updates, designed to enhance data-handling efficiency and overall usability. Given the different update cycles (every two months for OAC and annually for OAS), many of these features have already been available in the cloud version for over a year. Nevertheless, we’ve explored and tested the most notable novelties in OAS, and here are some of our insights.
Before we begin, here are some links for those interested in learning more about Oracle’s on-premises solution:
- Installation and Configuration Guide
Improvement of Conditional Formatting
Conditional formatting is a powerful tool that allows users to highlight specific numerical values based on defined conditions. This feature helps to accelerate decision-making and save time by simplifying data analysis and enhancing the visibility of key data points.
Oracle continues to expand its formatting capabilities with nearly every update: in this OAS release, Oracle has added the ability to apply conditional formatting to totals and subtotals in table and pivot table visualisations. For more details, refer to our Oracle Analytics Cloud July 2024 Update blog post.
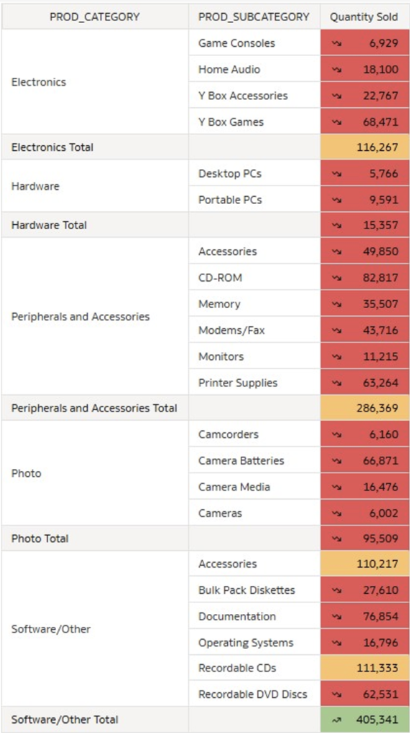
Figure 01: Conditional Formatting of Totals and Subtotals
Totals and subtotals typically represent aggregated data such as overall sales, profit margins, and regional performance. Highlighting these values enables users to easily identify outliers and take prompt, informed actions.
As mentioned above, conditional formatting is about emphasising specific numerical values. However, in the 2025 release, Oracle extends this paradigm and introduces conditional formatting for attributes. This enhancement offers greater flexibility and precision in data visualisation, allowing users to apply formatting rules directly to categorical data such as regions and departments:
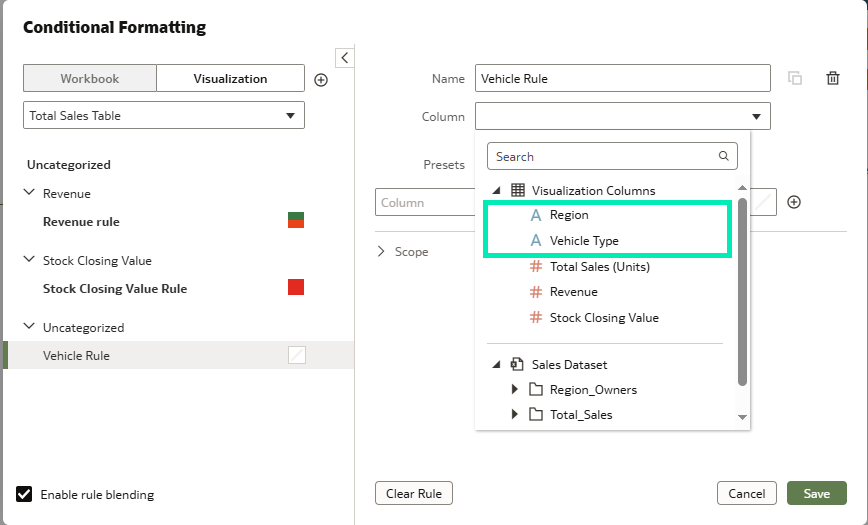
Figure 02: Conditional Formatting for Attributes
These features, alongside already existing conditional formatting options, take storytelling to the next level and allow users to build more visually insightful dashboards.
Another notable enhancement to formatting in OAS is the expanded use of emojis and icons across more visualisation types, which we covered in our OAC March 2024 Release article. Previously limited to tables, this functionality now extends to a broader range of visualisations, such as tile visualisations and more, enabling users to further customise their dashboards and highlight key insights visually:
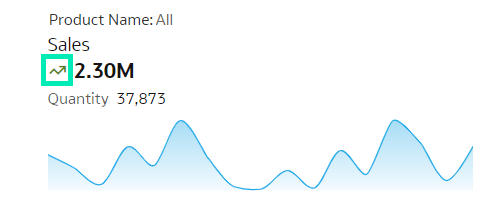
Figure 03: Emojis and Icons
This feature is particularly valuable as it enhances the interpretability of complex data. Icons and emojis transform static numerical values into more meaningful and engaging visual elements, making dashboards more intuitive and visually compelling.
Custom Tooltips
In some visualisations, certain data points may require additional context to improve understanding, and this is where tooltips come in handy. A tooltip is a small pop-up box that appears when a user hovers over an element in a visualisation, and whilst tooltips typically provide general information, deeper context is often missing. To address this, Oracle has introduced the ability to customise the tooltips, offering a more tailored and informative experience:

Figure 04: Custom Tooltip
This feature provides users with greater control over the content of their dashboards: by creating custom tooltips, they can ensure their dashboards are both interactive and user-friendly. It also supports a clean design whilst keeping critical data accessible, particularly in complex visualisations such as maps and boxplots, an advance covered in our OAC January 2025 Release post:
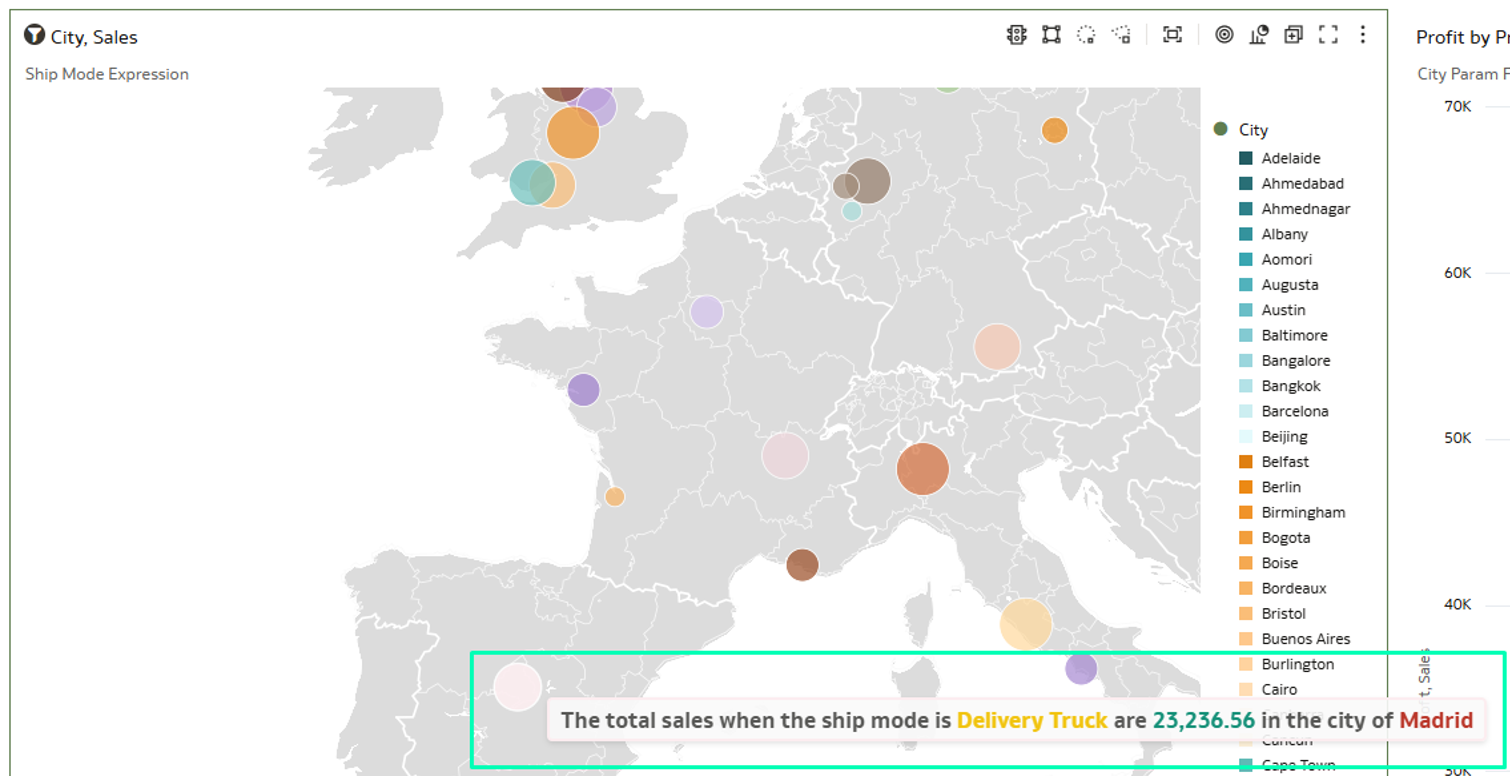
Figure 05: Custom Tooltip on Map
This ability to customise tooltips demonstrates Oracle’s commitment to balancing functionality with user experience.
Improved Navigation
This new release brings a more intuitive and user-friendly experience for navigating and managing content, significantly enhancing overall usability. One such enhancement is the ability to drag and drop both folders and workbooks into a catalogue, streamlining data and resource management whilst saving time and keeping content well organised.
Productivity often depends on the level of personalisation, and the ability to personalise the home page and group items in a way that aligns with user preferences is now available in OAS. Whether it’s datasets, workbooks or other assets, users can now organise their most-used resources into custom groups for quicker access, creating a workspace that’s perfect for their unique workflows and priorities:
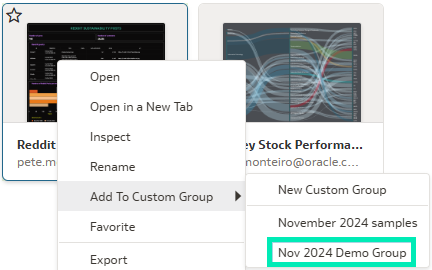
Figure 06: Custom Groups
These improvements in navigation offer a smoother and more efficient user experience when working with the platform.
Filter Enhancements
All data visualisation tools can create filters, an essential part of any dashboard or report that lets users focus on the most relevant information. Filters also make dashboards more dynamic and enable users to explore their data from different perspectives. With filters, users don’t need to create new reports for every query.
In this release Oracle has added couple of important filter features: one of them is the ability to create precise relative time filters, which was added to OAC last year and which we explained in our OAC July 2024 article. Thanks to this enhancement, users can be more accurate in their analyses and look at the data in a specific time frame:
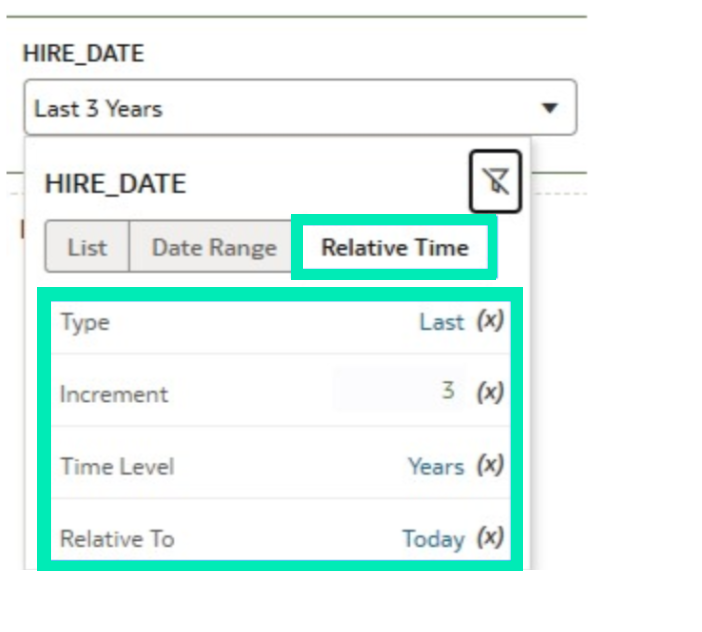
Figure 07: Relative Time Filter
This filter is valuable for time-sensitive analyses, such as tracking trends or KPI monitoring.
A shared understanding of data across teams within an organisation plays a crucial role in driving sound business decisions. In many cases, multiple analysts across different teams may view the same dashboard whilst applying different filters, leading to potential misalignment and data misinterpretation. In such situations the ability to keep filter values when sharing a workbook solves this problem:
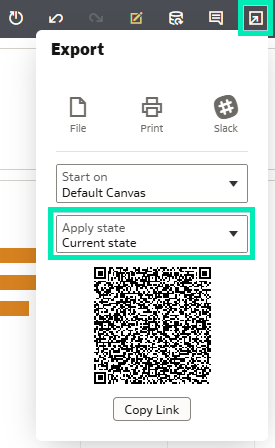
Figure 08: Sharing with Current Filters
This feature allows users to share workbooks with specific filters already applied, ensuring that recipients, whether colleagues or stakeholders, will see the data exactly as intended. It ensures consistency in data interpretation, saves time, and improves usability.
Time Series Functions
The OAS 2025 release also introduces a powerful addition to its analytics capabilities by incorporating time series functions into workbooks, enabling more efficient forecasting and trend analysis directly within visualisations. The new key time series functions include:
- PERIODROLLING
Calculates the aggregate of a measure over a period starting x units of time before and ending y units of time after the current time. For example, PERIODROLLING can compute sales for a period that starts one quarter before to one quarter after the current quarter.
- TODATE
Aggregates the value of a measure from the beginning of a specified period to the latest available point. This is useful for calculations such as year-to-date sales.
- AGO
Returns the value of a measure from a specific point in the past relative to the current time. For example, it can calculate monthly revenue from the same month one year ago.
These functions are important as they enhance the depth and accuracy of data analysis. While users could previously perform these calculations manually, doing so introduced a risk of errors, potentially leading to inaccurate outcomes. Now that these functions are integrated into OAS, users can perform time-based analyses with greater confidence and reliability:
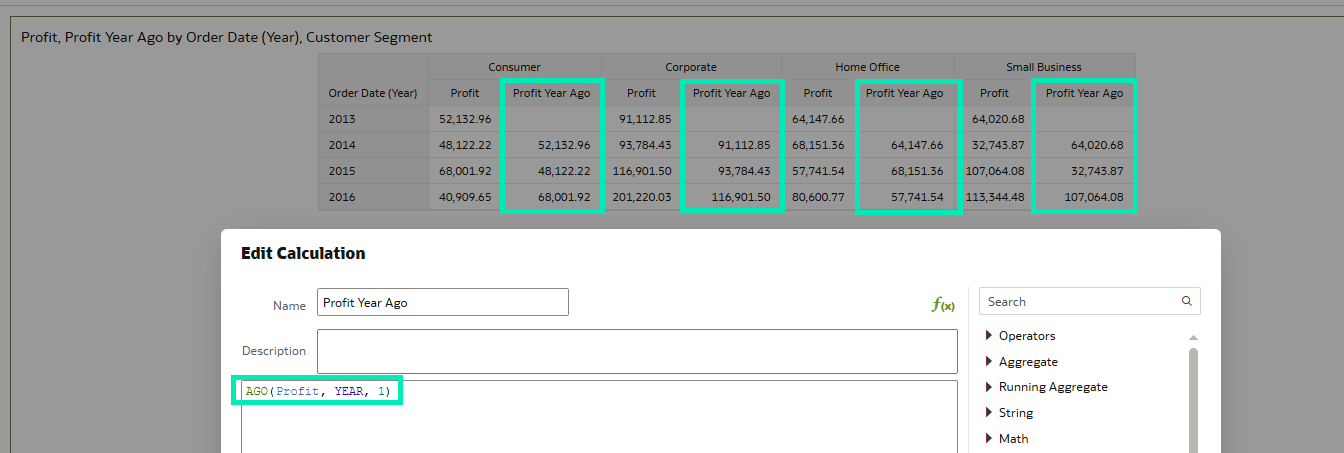
Figure 09: Ago Function
Auto Insights
Since its introduction in January 2022, the Auto Insights feature has undergone various changes and improvements. This feature automatically generates insights for any dataset within the system: by scanning datasets, it quickly produces visualisations and accelerates dashboard creation.
Even though Auto Insights are automatically enabled in OAS, user-defined options would be reset to default after closing a workbook, requiring users to repeat their previous steps in subsequent sessions. In March 2024, OAC users received an enhancement that keeps all setups, column selections and insight types from previous sessions. With the OAS 2025 release, this enhancement is now available. Nevertheless, if users wish to restart the setup process, they can manually reset Auto Insights to its default settings:
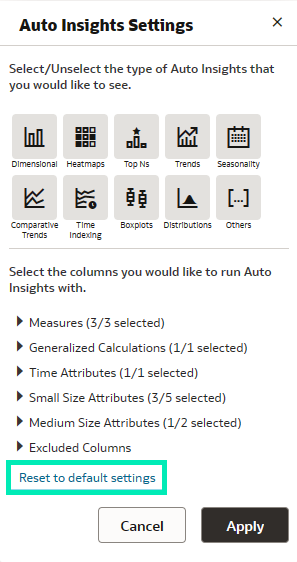
Figure 10: Auto Insights Settings
This saves a lot of time when creating ad hoc reports and dashboards, as well as guaranteeing consistency in user analyses.
Another notable enhancement is the ability to keep the filter selections while refreshing Auto Insights. This allows users to dynamically update insights based on the applied filters, ensuring that insights are always relevant to the current data context:

Figure 11: Auto Insights with Filters
Together, these Auto Insights enhancements help users to improve productivity with insights that are accurate and in accordance with user intent. They also enhance the overall value derived from OAS data analysis.
Augmented Analytics
Like most tech companies, Oracle aims to build an integrated ecosystem that supports perfect interconnectivity, enabling users to get the most out of it. OAS can now be integrated with Oracle Cloud Infrastructure Document Understanding, which in turn means that AI models can be deployed in analytics processes. Users can now add custom-trained models for Document Classification and Key Value Extraction to their data flows:
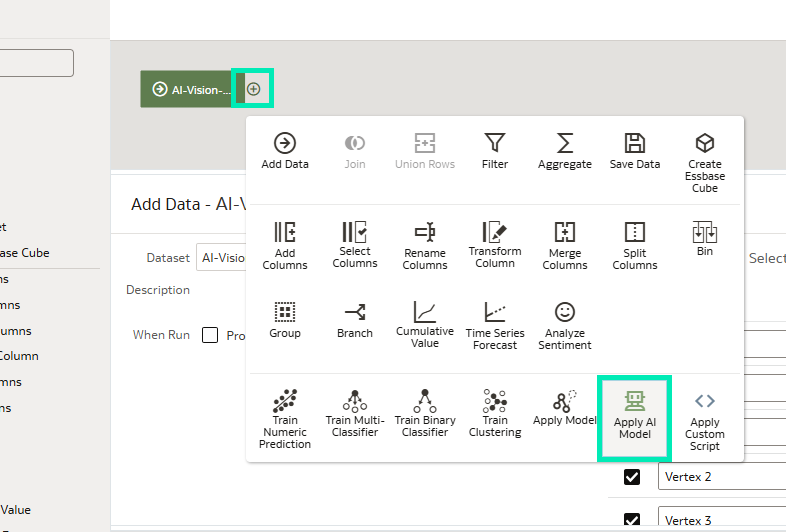
Figure 12: Applying an AI Model
This feature is particularly useful for categorising documents based on user-defined document types using a custom classification model. With a custom key-value extraction model, it is possible to detect and extract user-defined text fields.
In general, the use of AI saves a lot of time which can then be devoted to higher-quality analyses, as well as reducing manual effort.
Conclusion
The Oracle Analytics Server 2025 release introduces a wide range of powerful new features and improvements. It continues to evolve in line with modern analytical needs, offering better capabilities for today’s data-driven demands. From customisable tooltips and precise time filters to enhanced conditional formatting, these updates, along with a host of other novelties, provide users with greater control, optimised usability, and more efficient methods for extracting data insights.
While certain features may be deprecated, Oracle‘s clear focus on innovation means that users have access to the most advanced tools available on the market. This also ensures that any deprecated features are replaced with superior alternatives.
To sum it all up, the OAS 2025 release represents a significant step forward, equipping users with the tools they need to stay competitive in today’s world.
Here at ClearPeaks, our dedicated, certified team of Oracle experts is ready to help you to make the most of the latest Oracle Analytics features. Reach out to us today to take your data analysis to the next level and to transform your insights into impactful visualisations!