12 Mar 2019 Using OBIEE for near real-time dashboards: refresh strategy
In this article we’ll run through a near real-time dashboard refresh strategy, looking at the challenges and the solution.
1. The Challenge
Traditionally, Business Intelligence solutions are based on the principle of loading data from different corporate applications into a Data Warehouse and then generating reports by getting the data straight from it. This approach offers many fundamental benefits, but remember that the generated reports and dashboards will reflect the data as it is in the Data Warehouse, not as in the source applications.
In practice, this means there is a load process to be executed (most typically once per day), and so we retrieve data from one day prior to the current date.
With Oracle BI (OBIEE) – just like many other BI tools- the reporting layer of the solution is based on the above concept: the data is loaded with a certain frequency (generally daily) and we could consider the data to be static. Admittedly the data will get updated, but only once in a while. In this regard OBIEE provides great cache-related capabilities, focusing on caching the data to reduce query time by assuming that the data does not generally get updated within a business day. With the introduction of cache comes the need to manage it – cache management strategies. Cache architecture and management is a topic in itself but the bottom line is that OBIEE is concentrating on performing while delivering static data.
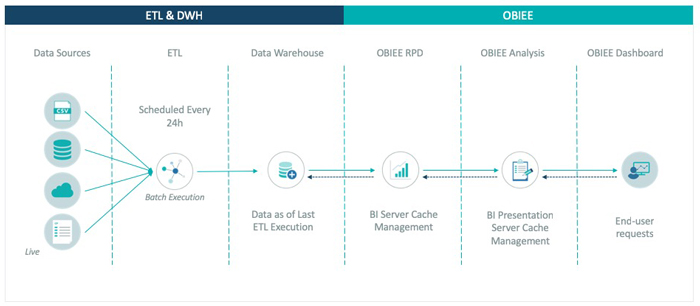
Figure 1: OBIEE Architecture: Typical Data Workflow.
While this is fine in most traditional BI reporting, when there is a need to report near real-time data, things can get complicated. This need generally comes as a direct request from the business in order to get the data refreshed as frequently as possible across the business day and to be able to display dashboards that are always showing the latest data.
On top of this, if near real-time data is a must, there is a chance that the solution (the set of dashboards and/or reports) will need to be displayed across the organization. This could be, for example, a screen or set of screens displayed in specific locations in the offices that provide the solution to the users.
It might not look like that big a deal, but take a look at the challenges we’ll be facing:
- Data Warehouse refresh strategy: Get the Data Warehouse (usually just a specific DataMart) updated in a high frequency process.
- Reporting refresh strategy: Adjust the BI Tool presentation layer functionality and behaviour in order to guarantee that the latest data is always displayed in the dashboards and reports.
While the first is not that much of a mystery (if the amount of data allows it, this can be handled with an incremental load using the proper Change Data Capture strategy), its implementation still demands complexity and effort.
On the other hand, the second point is much trickier (remember that we are aiming to implement this solution in Oracle BIEE or similar: there is no out-of-the-box option to automatically refresh the figures in a dashboard on changes or updates in data). Implementing the described solution without bearing these difficulties in mind will result in slowly discovering a set of issues and incompatibilities that will need non-standard solutions to overcome them.
In this article we will put the focus on these challenges and a solution that will guarantee that our OBIEE dashboards are available on the screens or displays and ensure that near real-time data is always displayed without the need for any user intervention to reload the displayed data.
2. The Solution
This is what we need to do:
- Update the relevant data in the Data Warehouse.
- Automatically refresh the dashboards once the data has been updated.
- Display a last update time in the dashboard to inform the user accordingly.
So we already know the high-level requirements; but how is this translated into a detailed list of steps and an overall workflow?
While there are alternatives to achieve a more straightforward implementation, our solution optimizes the resources and the main constraint, the data load process and the time required to load the updated data. This will result in an optimised end-user experience.
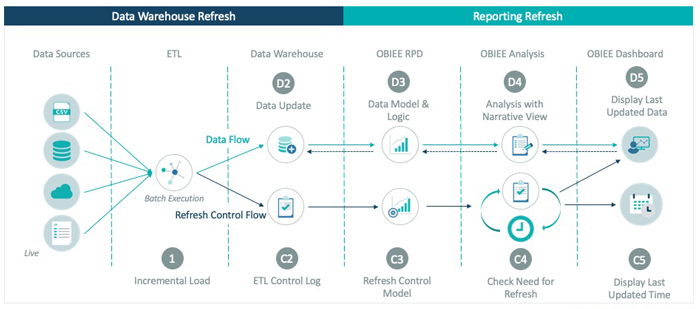
Figure 2: Solution Architecture: Execution Workflow.
Incremental Load (1)
Develop and set up an Incremental Load in order to bring the latest updated data into the DWH. We have to set up a proper Change Data Capture (CDC) strategy as well as to optimize the execution time. Once developed, we must set up the scheduling of the process at the lowest frequency possible. This could be either a continuous execution loop (once the ETL finishes, restart it) or every specific amount of time.
Refresh Control Flow (C)
- ETL Control Log (C2)
To keep track of the ETL execution in an ETL Control Log table. For this, the ETL workflow will have a last session that will be updating this log, storing the execution end time. This will allow easy access to the last refresh time.
- Refresh Control Model (C3)
The ETL Control Log is brought into the RPD model. This model will remain rather basic and can be reused for several purposes, for example, it could be expanded and used to create an ETL Control Dashboard.
- Check Need for Refresh (C4)
This is the key step for the Control Flow. In this step we have to develop and schedule a process that handles the logic to identify if the data has been refreshed and to trigger a refresh of the dashboard as necessary.
This process will essentially consist of an analysis that will bring the last updated time (from the ETL Control Log) and include a narrative view with JavaScript containing a function with the logic to determine if the data has been updated or not.
In order to guarantee that the analysis really brings the last updated time, the OBIEE cache must be completely deactivated for this analysis.
Since the updates are continuous (the ETL is scheduled every specific amount of time), the data must be continuously checked for updates. In order to achieve it, it will be needed to set-up a loop over this analysis, so that it executes with a specific frequency. The way to achieve this is to set up some sort of recursivity over this analysis in the narrative view: the first time the analysis executes (when the dashboard is loaded) it will schedule its own execution with the specified frequency until a data refresh need is found.
To set up this loop, we must be able to programmatically trigger (from the JS) the execution of this OBIEE analysis.
The function in this narrative view will need to detect when a refresh is needed based on these inputs:
- Last Data Refresh time.
- The execution frequency of this analysis, based on the loop settings.
If the data has been refreshed, then the flow will advance to the last stage by triggering a refresh action to the whole dashboard. This refresh action will re-execute (bypassing cache) each of the analysis in the dashboard, resulting in smoothly refreshing all the figures individually. This strategy allows to minimize the impact on the user experience, especially compared to fully refreshing the whole webpage.
- Display Last Updated Time (C5)
Since the data is constantly being updated, it is important to tell the end-user when the data was last updated. Accordingly, the dashboard will incorporate this information, which will be updated every time a full data refresh is executed.
Data Flow (D)
- Data Update (D2)
As a result of the ETL execution, new updated data will be loaded in the DWH. Every query hitting the database will bring this fresh data.
- Data Model & Logic (D3)
As with any OBIEE data flow, the latest version of the data will be channelled through the RPD model and logic.
- Analyses with Narrative View (D4)
As usual, the dashboard will contain a set of analyses that will set up the data criteria needed in each, as well as its visualization.
Including a Narrative View is not mandatory in this step, but doing so brings many additional options to display advanced visualizations, instead of the out-of-the-box OBIEE visualizations.
Since setting up the Refresh Control Flow needs Narrative Views with JavaScript, including advanced visualizations shouldn’t mean adding much more complexity or resources into the development, and so it is highly recommended.
- Display Last Updated Data (D5)
Every time the need to update the data displayed on the dashboard is identified, thanks to the Control Flow, an action will be triggered in order to reload the dashboard, bypassing the OBIEE cache. This action will be triggered from the JavaScript of a narrative view.
In this way, we ensure that the data is coming straight from the DWH, not from any of the OBIEE cache, which means it will be the latest available data.
At the same time, this cache bypass will only be executed when it is really needed (updated data available), instead of fully disabling it for the whole dashboard, reducing the impact on the performance optimisation.
3. Main Technical Challenges
The implementation of the proposed solution (or any other similar solution within OBIEE) comes with several specific technical challenges. The most relevant are these:
- Cache management. Bringing near real-time data into a traditional OBIEE solution requires additional care of the cache, unless deactivating it completely is a feasible option.
- Capability to request updated data based on the fact that this set of data has been updated since it was last loaded into the dashboard.
- It’s not always the end-user requesting data to OBIEE. This could be because there is fresher data to be displayed, but it could also be, for instance, because the dashboard is not exclusively available in the end-user computer any more, but in a touch screen.
- JavaScript integration into OBIEE. First, embedding JS in the narrative views of OBIEE, to add either advanced visualizations or custom code. Second, executing OBIEE core actions from the JS, like executing a particular analysis or refreshing a dashboard while bypassing the OBIEE cache.
Conclusion
By implementing this solution, it is possible to use OBIEE in an efficient and optimised way to display dashboards with near-real time data, whilst keeping the benefits of traditional BI applications and display almost live data.
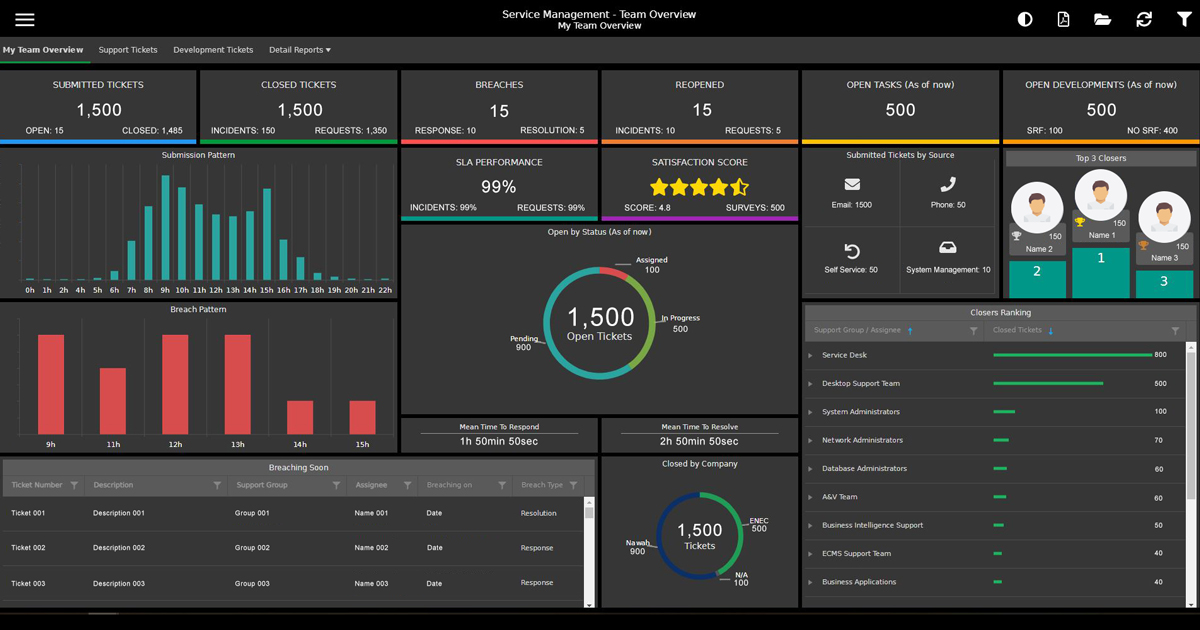
A good example of the proposed solution is an operational Tickets dashboard to display the Service Management status for the different departments in the company. In this way, not only can each employee have a quick look at the updated status on their laptop, but the dashboard can also be shown across the organization on displays that don’t require user intervention, as well as on interactive screens, increasing awareness, fomenting productivity across employees and ultimately increasing the service performance of the teams.
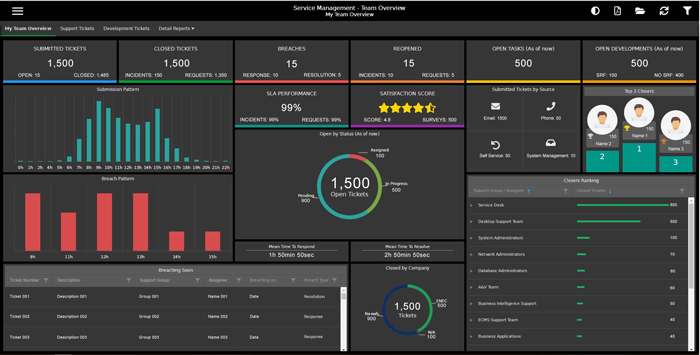
Figure 3: This OBIEE dashboard is displaying near real-time data using the presented solution, as well as a custom HTML/CSS and JS presentation layer.
Depending on specific needs and the corporate environment, an alternative option would be to use a modern BI Tool such as Tableau or Microsoft PowerBI with a live connection and work on an alternative (and probably less complex) refresh strategy. But if OBIEE is the corporate BI Tool, enhancing it to bring the capability proposed in this solution will bring many benefits.
As a summary, below you can see the strengths and weaknesses of this solution:
- Strengths
- Integration of the deliverable into the DWH & model.
- Reusability of the development for traditional OBIEE dashboards.
- Keeping the reporting load in the OBIEE server and database (DWH), instead of in the transactional applications database.
- Corporate BI is restricted to a single BI platform:
- No additional infrastructure and licensing required.
- No need to integrate different BI platforms into a single interface to ensure a simple user interface.
- BI development exclusively in a single platform. No additional BI platform skills required; reusability of the delivery.
- Reusability of the solution; once implemented for a deliverable, the same strategy and core functions can be used for several dashboards.
- Weaknesses
- The outcome is not strictly a live dashboard that displays the data as is in the source system by directly connecting to the source, detecting the changes and refreshing the visualization, but a near real-time dataset coming from the Data Warehouse and a dashboard that automatically refreshes when the dataset is updated.
- Additional efforts, complexity and challenges compared to the development of a standard delivery.
Exploring solutions like this can offer many advantages to corporate BI, opening a whole new set of possibilities while still keeping the benefits of using a robust traditional tool such as OBIEE and all its features.
In general, integrating JavaScript into OBIEE comes with many different applications and new features to add to the robust OBIEE stack that will be capable of satisfying almost every business need. This is just one example of what can be achieved given a particular need – the applications are countless!