23 Aug 2013 Implementing KPI Trending in OBIEE
Business Managers are frequently provided BI reports designed to support their decision making process. These analyses typically include highly visual graphs showing how the company performs over time against a set of predefined indicators, also known as KPIs. However, to build a report under OBIEE showing the historic trend of different KPIs is not as simple as it may seem.
Take for example… KPI trending for Procurement
Suppose that a procurement manager needs to track the evolution of the following indicators:
- Number of Winning RFQ Responses
- Number of Tenders Under Process
Before going ahead with the solution, a few details about the RFQ business process need to be explained:
- The first stage of The Request for Quotation process starts when the buying company opens a tender for acquiring a product/service
- In the second stage, suppliers can start bidding for that specific product/service by sending their RFQ responses.
- Once the buyer decides which is the best option, the winning RFQ response is approved and the buying company places an order containing the terms agreed upon.
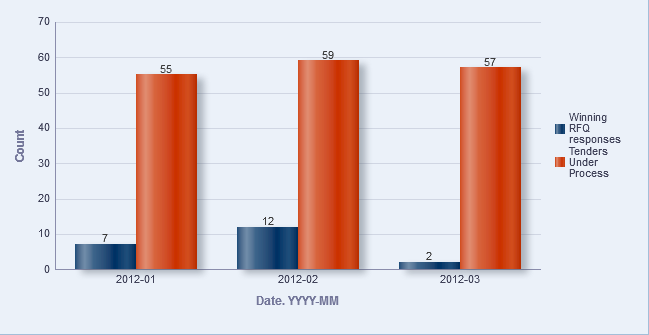
The following report would cover what the procurement manager requires:
Problem description
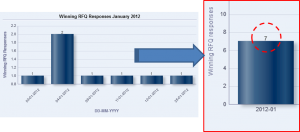
The main problem lies in the fact that the time dimension used in the trending analysis needs to be related to the dates that define the different KPIs: 1. The number of winning RFQ responses has to be shown according to the Tender Award Date. 2. For the Number of Tenders under Process, we’ll have to count the number of RFQs that are included in the date range defined between Tender Enter Date and Tender Close Date. At this stage it is important to identify the specified aggregation for the two KPIs. For clarification purposes, let’s take a look at the company results in January 2012: Winning RFQ responses
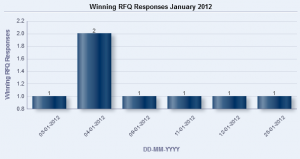
Setting a sum so the aggregation rule will bring the expected results:
- Tenders Under Process
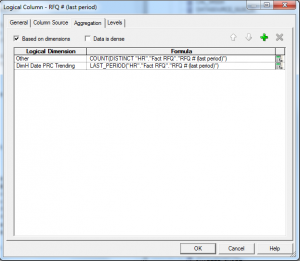
In this case, the last value of the period will lead to the results we need: In the next few lines, we will explain how to conform these two dates and be able to report on a single time dimension analysis.
Solution
1. Create a new time dimension, i.e. Dim_Date_PRC_Trending
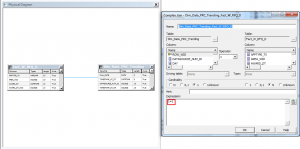
2. Join it to the fact table within the physical layer and set a 1:1 relation.
3. Link the two tables in the business layer 
4. Create two measures. One based on count distinct and the other based on the last period value:
- Number of RFQs (sum) -> RFQ # (sum)
- Number of RFQs (last period) -> RFQ # (last period)
5. Create the KPIs as the new logical columns in the related fact table  6. Set the formula of the two columns as it follows. This is where the join condition with the trending date will be specified: Number of Winning RFQ responses:
  Number of Tenders Under Process:

