08 Jul 2026 AKS and PostgreSQL Monitoring with Azure Monitor and Grafana
With the rapid growth of cloud computing, businesses are modernising their technology stack using leading platforms such as Microsoft Azure, so that they can analyse data at scale and benefit from cloud flexibility and elasticity. Of course, selecting the right cloud services is crucial, but monitoring them effectively is just as important for optimising resource consumption and performance, supporting scalability, and maintaining security.
Microsoft Azure addresses this challenge natively through Azure Monitor, a centralised monitoring platform designed to collect, analyse, and visualise telemetry data from Azure resources. It gathers telemetry such as metrics and logs, delivering infrastructure observability and performance monitoring.
Whilst metrics can be accessed directly through Azure Monitor, log data is stored and managed in a Log Analytics workspace, which serves as the central repository for collected logs. Once this data is available, it can be explored through queries and visualised using Azure Monitor dashboards with Grafana. Together, these capabilities offer a comprehensive view of infrastructure health, enabling teams to proactively identify, investigate, and resolve issues across the environment.
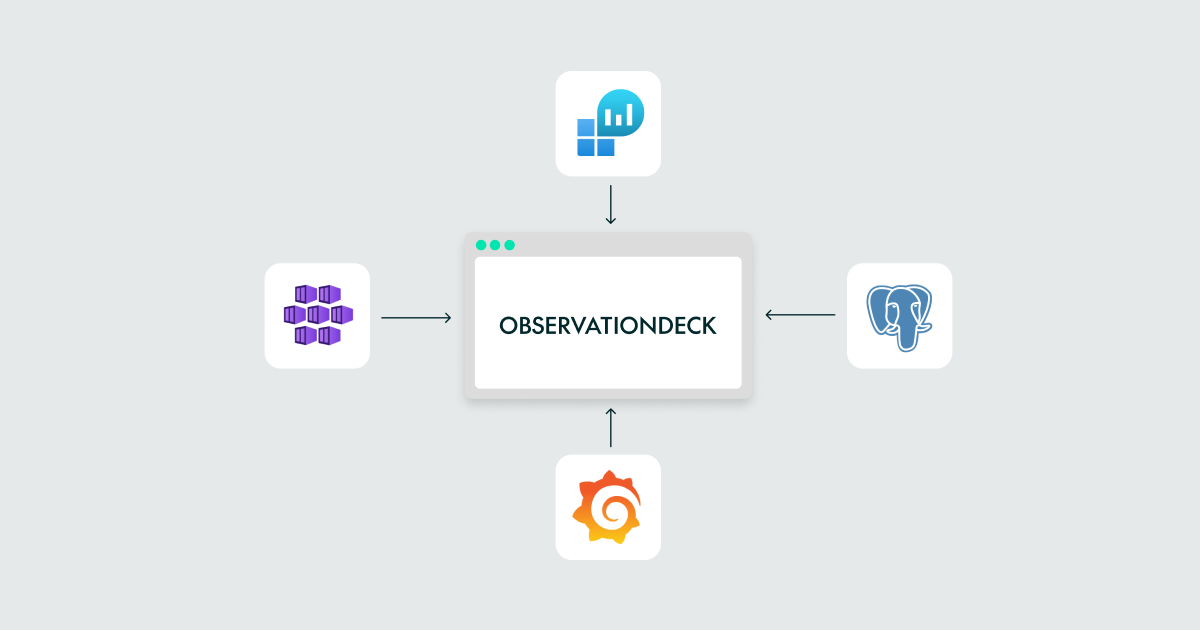
In this blog post, we’ll introduce Azure Monitor, explain how log data is stored and queried in a Log Analytics workspace, and show how Grafana dashboards can turn that data into practical monitoring views. Finally, we’ll present a solution based on a real-world use case involving the ClearPeaks Observation Deck, our executive analytics platform where senior managers can view dashboards, KPIs, reports, and business insights through a clean, boardroom-friendly interface.
Azure Monitoring
Monitoring is fundamental to operating and maintaining a cloud environment. Azure provides a comprehensive observability ecosystem that allows organisations to collect, analyse, and visualise telemetry data generated across their infrastructure and applications. Within this ecosystem, Azure Monitor, a Log Analytics workspace, and Azure Monitor dashboards with Grafana work together to provide an end-to-end monitoring solution.
Azure Monitor acts as the central telemetry layer of the platform, collecting metrics, logs, and diagnostic information from Azure resources and services, establishing a unified source of operational data. This centralised approach simplifies the process by bringing together information that would otherwise be distributed across multiple services and management interfaces.
At the core of this monitoring architecture is the Log Analytics workspace, a central repository where logs and performance data are stored and organised for analysis. As monitoring data is ingested, Azure Monitor populates the corresponding tables, allowing information from different resources and services to be analysed from a single location. Kusto Query Language (KQL) enables users to filter, aggregate, and correlate data in more advanced ways, helping them to gain deeper operational insights and troubleshoot issues more effectively.
Azure Monitor dashboards with Grafana provide the visualisation layer on top of this data. Grafana queries data stored in the Log Analytics workspace and uses it to build interactive dashboards, turning raw telemetry into meaningful operational views. These dashboards can combine multiple datasets, support custom visualisations, and allow users to explore information across different time ranges, making it easier to identify patterns, anomalies, and performance trends.
This approach provides a flexible observability framework that complements Azure Monitor’s data collection capabilities. Whilst Azure Monitor is responsible for gathering telemetry, the Log Analytics workspace enables advanced analysis, and Grafana delivers intuitive visualisation, allowing the framework to support a wide range of operational and analytical requirements.
Now that we’ve covered the main monitoring components, let’s see how these capabilities can be applied to a real-world scenario by monitoring our own Observation Deck.
Monitoring Observation Deck with Azure Monitor
Observation Deck is a modern, AI-enabled executive analytics platform that provides organisations with a unified view of their performance and key metrics. Designed especially for collaborative environments such as boardrooms and large touchscreen displays, it centralises access to dashboards, KPIs, and analytics from across the organisation in a single, interactive interface. Thanks to its integration with existing Azure, Power BI, and security infrastructure, Observation Deck enables executives and decision-makers to access accurate, up-to-date insights and make data-driven decisions. The platform also uses Azure OpenAI capabilities to enhance the analytics experience through intelligent interactions and advanced data exploration. Contact us if you’d like to learn more about Observation Deck
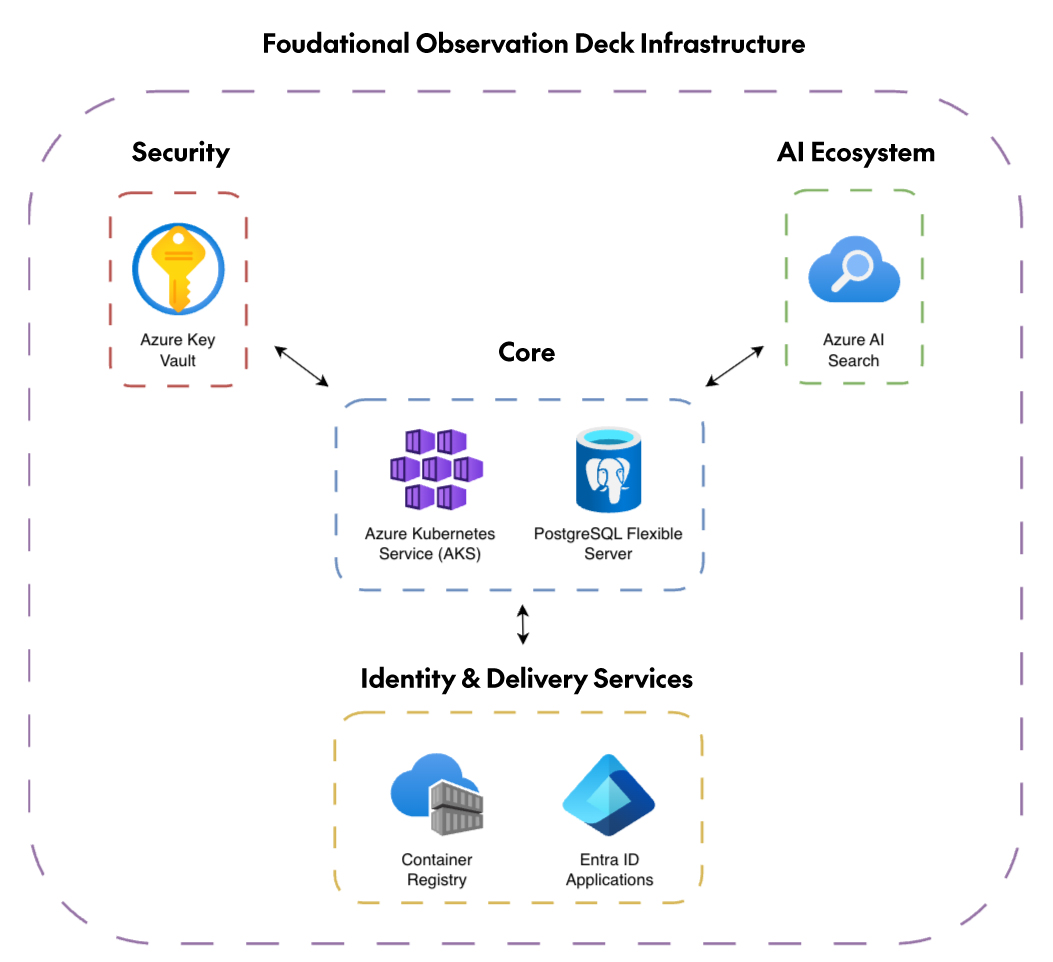
For a platform of this kind, reliable infrastructure is essential. It must operate efficiently, be able to scale to accommodate growing data volumes and user demand, and provide clear visibility into what is happening across the environment. Before diving into the monitoring architecture and observability capabilities, let’s first review the core infrastructure components required to deploy and operate Observation Deck:
- Core: An Azure Kubernetes Service (AKS) cluster that orchestrates the platform microservices, including the frontend, backend, and logging components, together with a PostgreSQL flexible server to manage and store platform data.
- Security: An Azure Key Vault to securely store passwords and other secrets.
- Shared Services: An Azure Container Registry (ACR) to host Observation Deck image versions, and Microsoft Entra ID applications to handle secure authentication and authorisation for users and services across the platform.
- AI Ecosystem: A suite of specialised AI services, including Azure AI Search, text-to-speech capabilities, and an interactive chatbot.
In an environment composed of multiple services, analysing all the generated monitoring data can be difficult and time-consuming. As mentioned earlier, users can find this data on the resource page for each deployed service. However, this fragmented approach makes it difficult to correlate information and gain centralised visibility across the entire infrastructure, so implementing an observability solution that brings all relevant data together in a single layer or set of dashboards becomes a necessity.
In Observation Deck, it is essential to monitor the core components, namely the AKS cluster and the PostgreSQL flexible server, in order to verify that the platform has been deployed correctly, assess its status, and detect any potential issues related to both the infrastructure and the platform itself.
For AKS, telemetry should include CPU, memory, disk, and network metrics to assess the health of both the cluster and its pods. Container and application logs should also be captured to help to identify errors during deployment and application runtime. Kubernetes events can also provide valuable insights into pod scheduling, restarts, and other operational behaviour.
For PostgreSQL, logs are essential for detecting internal database failures, slow-running queries, and potential bottlenecks. These should be complemented by connection logs, which can help to identify unauthorised access attempts.
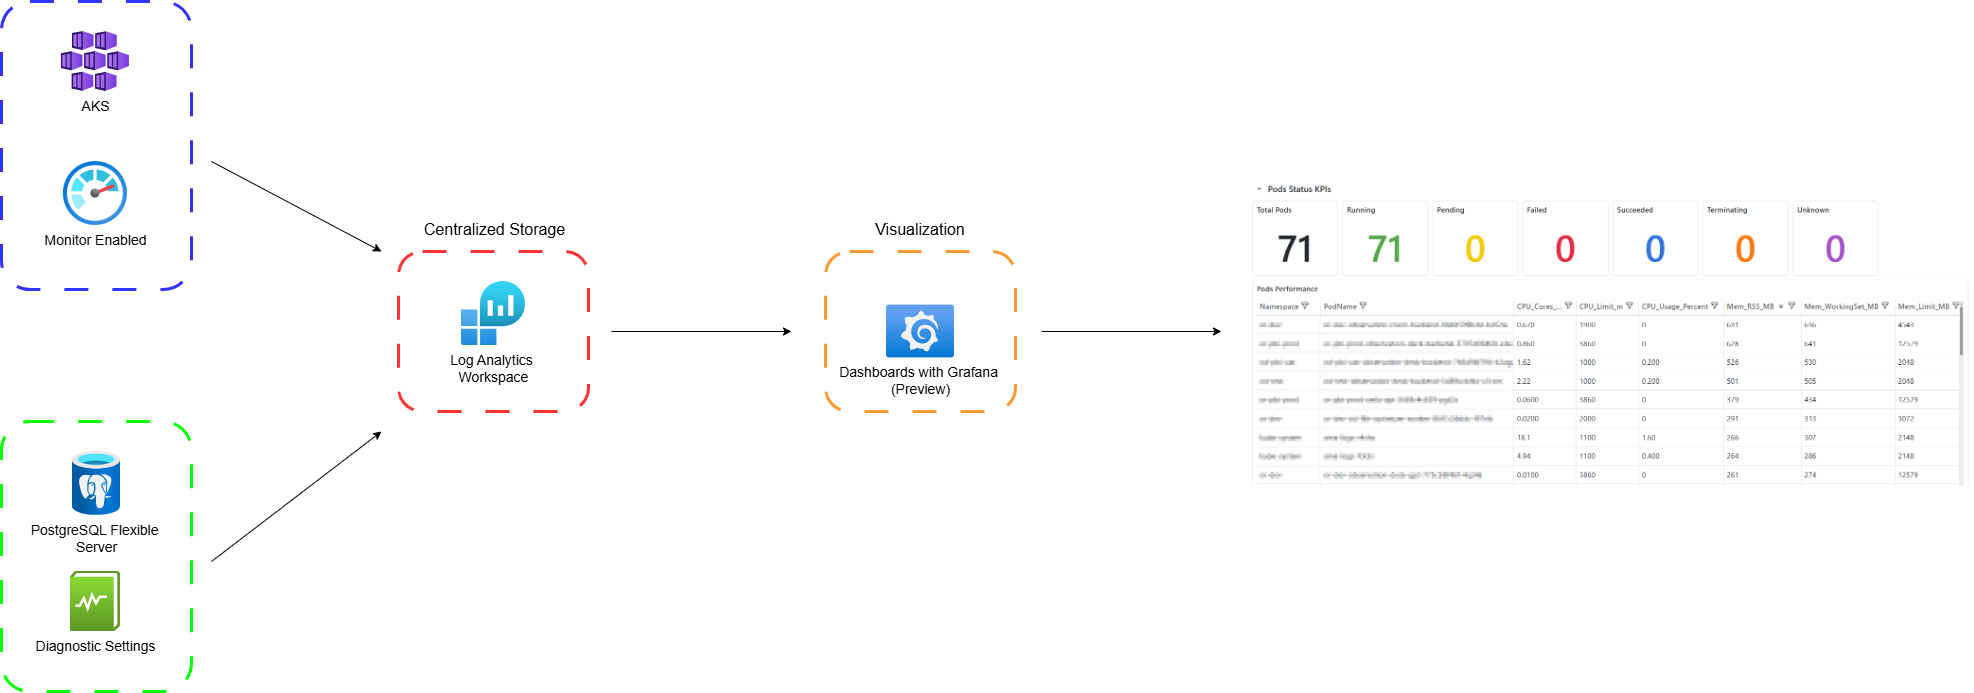
The main challenge in this use case is to centralise the Observation Deck core monitoring data in a single location: a Grafana dashboard. This simplifies service management and maintenance, as well as the detection of errors and anomalies.
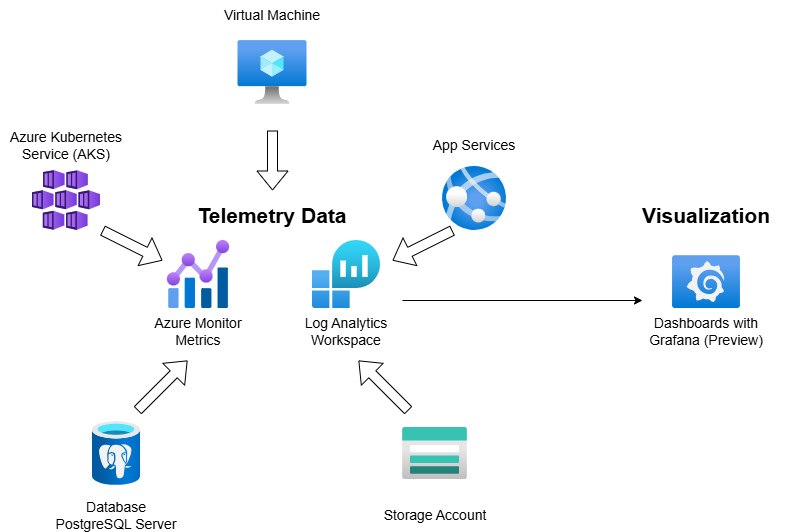
Azure Monitor is well suited to this scenario. Azure Monitor metrics and a Log Analytics workspace allow metrics and logs to be stored centrally, whilst Grafana dashboards make it possible to correlate, aggregate, and visualise this data on a single page. As a result, users no longer need to access each individual service separately to monitor its performance.
Observation Deck Monitoring Architecture
The diagram below provides an overview of all the components involved in the solution and shows how they interact with one another:
Enabling AKS Monitoring
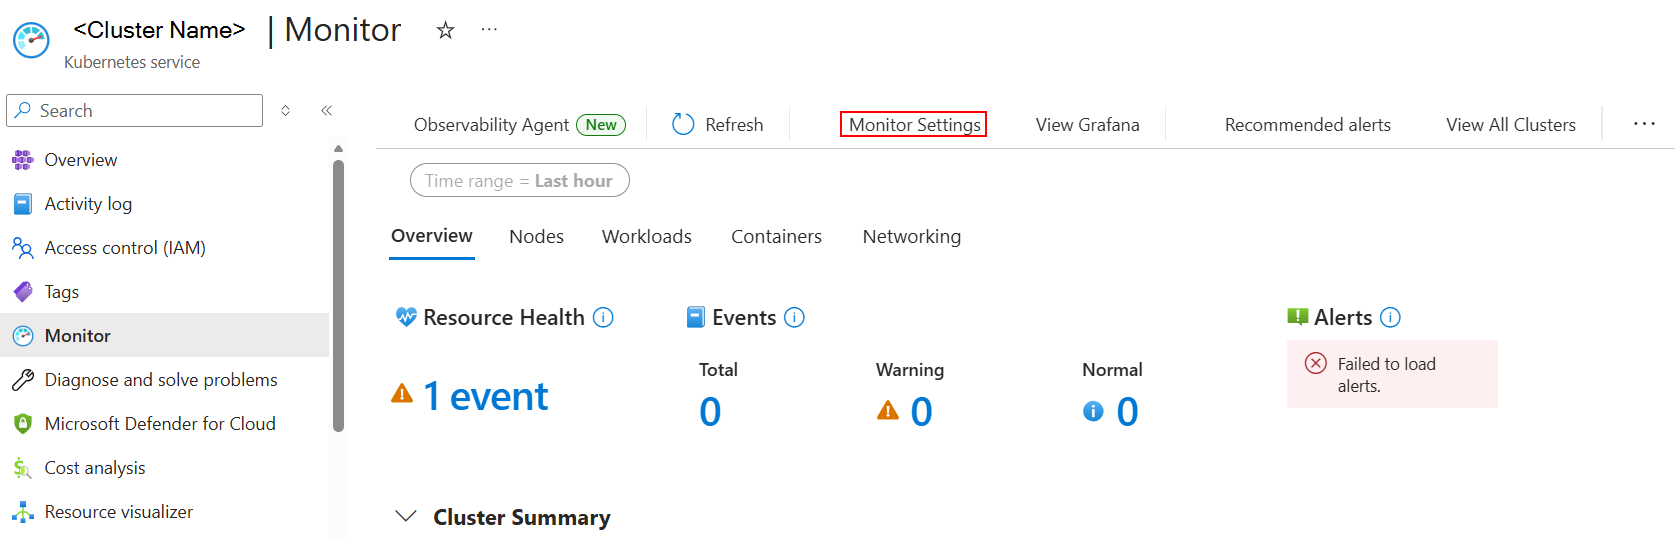
Now let’s create a Log Analytics workspace to store AKS metrics and logs. First, we’ll navigate to the deployed AKS cluster, and in the list of options on the left, we’ll select Monitor, then click on Monitor Settings:
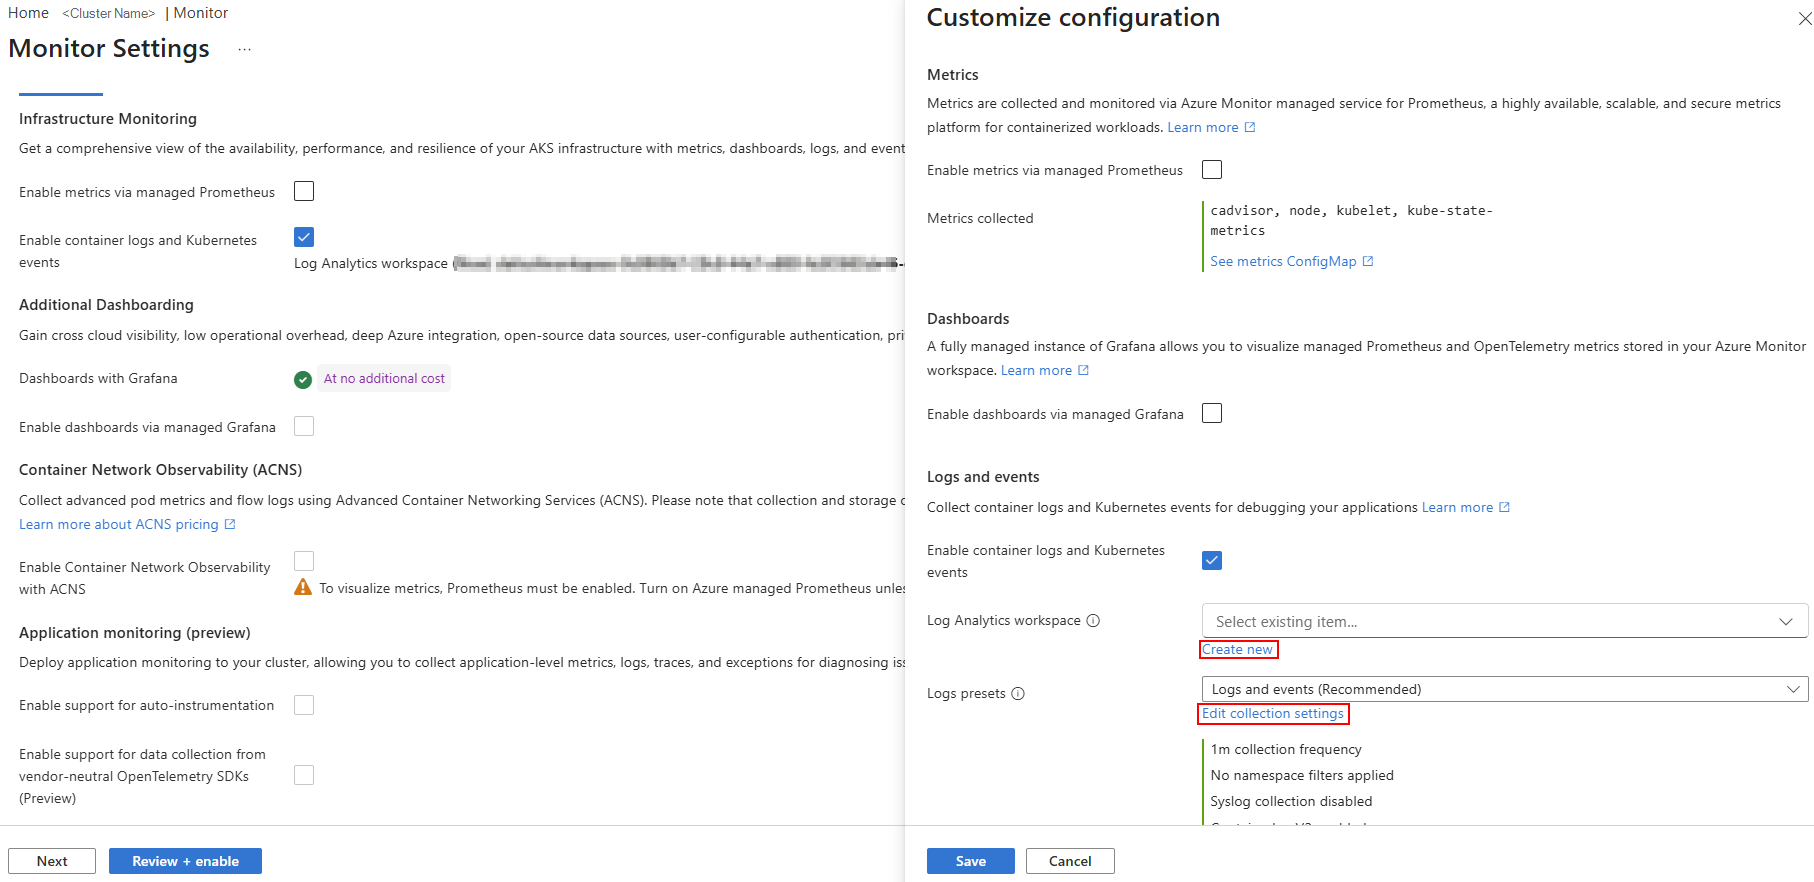
Clicking on this button opens a new window where we can configure AKS monitoring. Under the first option, Infrastructure Monitoring, we’ll select Customize configuration. This opens a new tab where we can create a Log Analytics workspace and configure the monitoring data to be collected from the AKS cluster, using the options highlighted in red below:
Once AKS monitoring has been enabled, a set of Azure Monitor Logs tables for the cluster becomes available in the Log Analytics workspace. For this use case, two of these tables are particularly noteworthy:
- Perf: Collects core infrastructure performance counters from our host operating systems and hardware components.
Key fields: Computer, ObjectName, CounterName, CounterValue, and CounterPath. - ContainerLogV2: Captures the stdout and stderr log streams from the running containers.
Key fields: ContainerId, ContainerName, PodName, PodNamespace, LogMessage, and
In summary, these two tables contain detailed information about the AKS cluster metrics and logs. This data will form the basis of the Grafana dashboard used for monitoring and observability in Observation Deck.
Enabling PostgreSQL Log Collection
To complete the monitoring data collection, we’ll enable log extraction on the PostgreSQL flexible server. To do this, we’ll go to the service page, select Monitoring from the list of options on the left-hand side and then select Diagnostic settings. From there we’ll click on Add diagnostic setting, choose the required categories, and send the data to the Log Analytics workspace created earlier. In this case, we only need to collect database logs, although other diagnostic categories and metrics are also available.
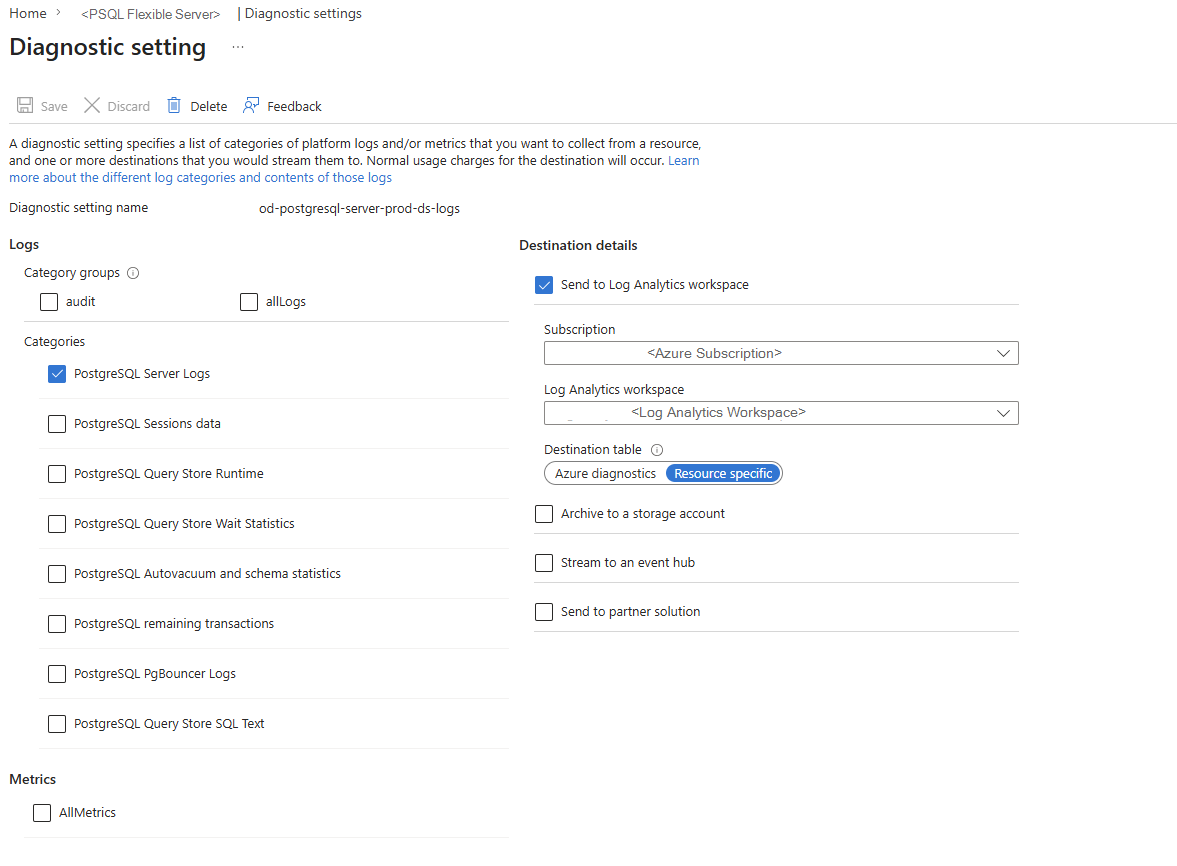
The key table for our use case is:
- PGSQLServerLogs: Contains the internal engine logs from our Azure Database for PostgreSQL flexible server.
Key fields: LogicalServerName, SqlErrorCode, Message, Context, and BackendType.
Once the relevant tables have been centralised in the same Log Analytics workspace, we can create a Grafana dashboard to support the observability and monitoring of Observation Deck’s core components.
Creating the Grafana Dashboard
First, we’ll navigate to the AKS service page, go to Monitoring on the left, then select Dashboards with Grafana, where we can create a fully customised dashboard or use a predefined one. In this case, we created a dashboard from scratch, using our Log Analytics workspace:
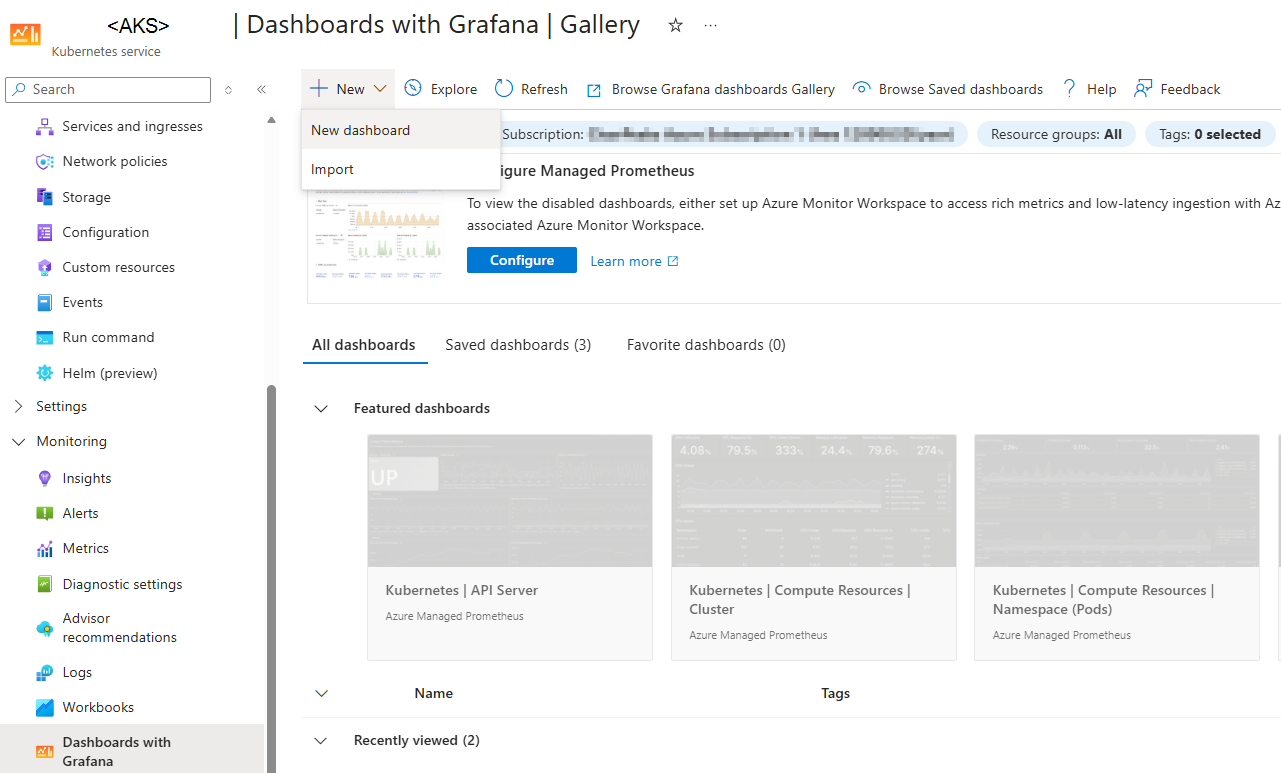
The following sections describe the key metrics and visualisations included in the Observation Deck monitoring dashboard.
Monitoring Pod Performance
One of the challenges we faced was to identify the root cause of unexpected pod restarts and service disruptions within the AKS cluster. In some cases, a sudden increase in CPU or memory consumption in a specific microservice could affect other workloads running in the cluster, causing pods to restart or become unavailable. Without a centralised view of resource utilisation, pinpointing the source of these issues was often time-consuming and complex.
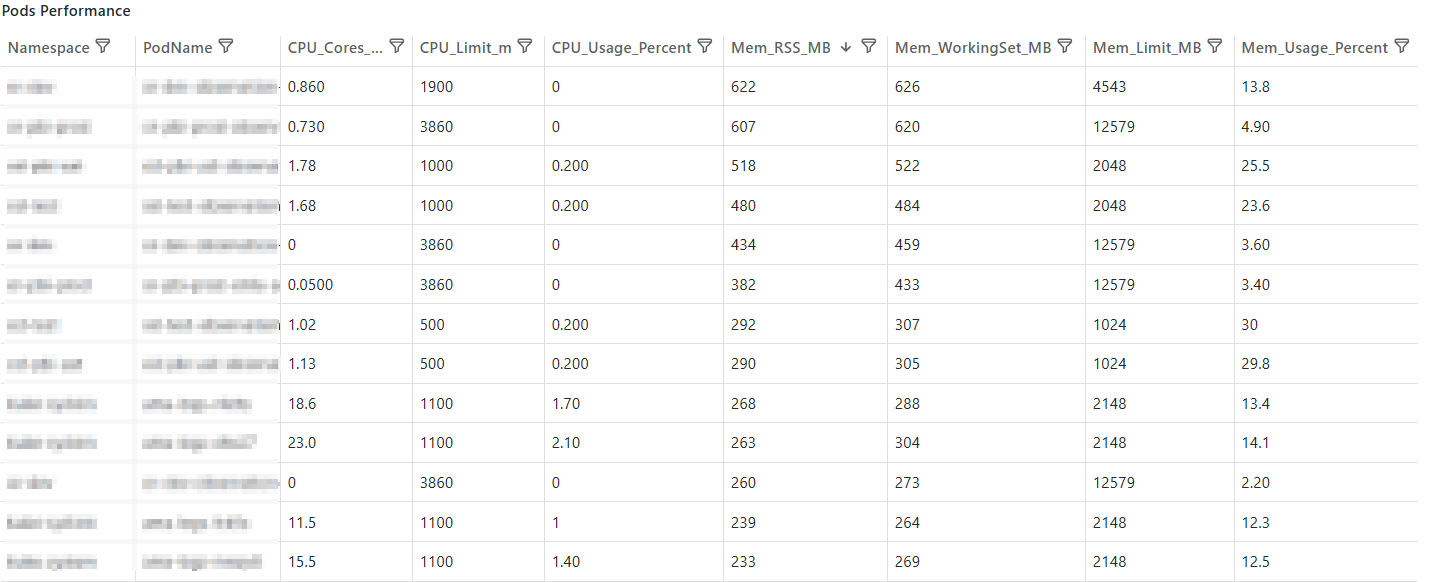
The Pods Performance view addresses this challenge by providing timely visibility into the CPU and memory consumption of each pod in the cluster. In addition to displaying the current resource usage, it also shows the configured CPU and memory limits for each pod, together with the percentage of those limits being consumed. This makes it easy to identify resource-intensive workloads, detect abnormal consumption patterns, and quickly determine which microservice may be responsible for performance degradation or instability within the environment. The Perf table provides the data required to build this panel.
The table below shows the Pods Performance view:
Building A Unified Container Log View
Troubleshooting application issues within AKS was challenging, as container logs were not always displayed in a readable format. When a log message contained line breaks, it was ingested as multiple separate records, making it difficult to reconstruct the original message and understand the context of the error. As a result, log queries often returned fragmented and cluttered results, significantly slowing down root-cause analysis. Moreover, the log structure varied depending on the Observation Deck backend application running in each pod, making it impossible to process all logs using a single parsing approach.
To solve this, we implemented custom log-processing logic to reconstruct multi-line log entries and consolidate them into single, structured records. Because log formats varied across containers, a set of ad hoc regular expressions was designed and fine-tuned to match the specific structure of each source. These patterns were used to identify log boundaries, extract key fields, and classify each entry by type, such as ERROR, WARN, DEBUG, HTTP, INFO, and UNKNOWN. This approach enabled consistent parsing and categorisation across heterogeneous log formats, improving log quality and usability for downstream analysis.
This KQL code snippet illustrates how the regular expressions were implemented and how the different log types are categorised:
ContainerLogV2
| where isnotempty(LogMessage)
| where PodNamespace in ($Namespace)
| project TimeGenerated, LogMessage, PodName, ContainerName, PodNamespace
| order by ContainerName asc, TimeGenerated asc
| extend IsStart = iff(
    LogMessage matches regex @"^\d{4}[-/]\d{2}[-/]\d{2}"
    or LogMessage matches regex @"^\d{1,3}\.\d{1,3}\.\d{1,3}\.\d{1,3}"
    or LogMessage matches regex @"(?:[0-1]\d|2[0-3]):[0-5]\d:[0-5]\d,\d{3}"
    , 1, 0)
| extend GroupId = row_cumsum(IsStart)
| extend LineInGroup = row_cumsum(1, IsStart == 1)
| extend SubGroupId = toint(LineInGroup / 3000)
| summarize
    TimeGenerated = min(TimeGenerated),
    Log = strcat_array(make_list(LogMessage), "\n")
    by GroupId, SubGroupId, PodName, ContainerName, PodNamespace
| extend Type = case(
        Log contains "ERROR", "ERROR",
        Log contains "HTTP",  "HTTP",
        Log contains "INFO",  "INFO",
        Log contains "DEBUG", "DEBUG",
        Log contains "WARN",  "WARN",
        "UNKNOWN"
    )
| order by TimeGenerated desc
| extend LogPart = SubGroupId + 1
| project TimeGenerated, Type, LogPart, PodNamespace, ContainerName, PodName, Log
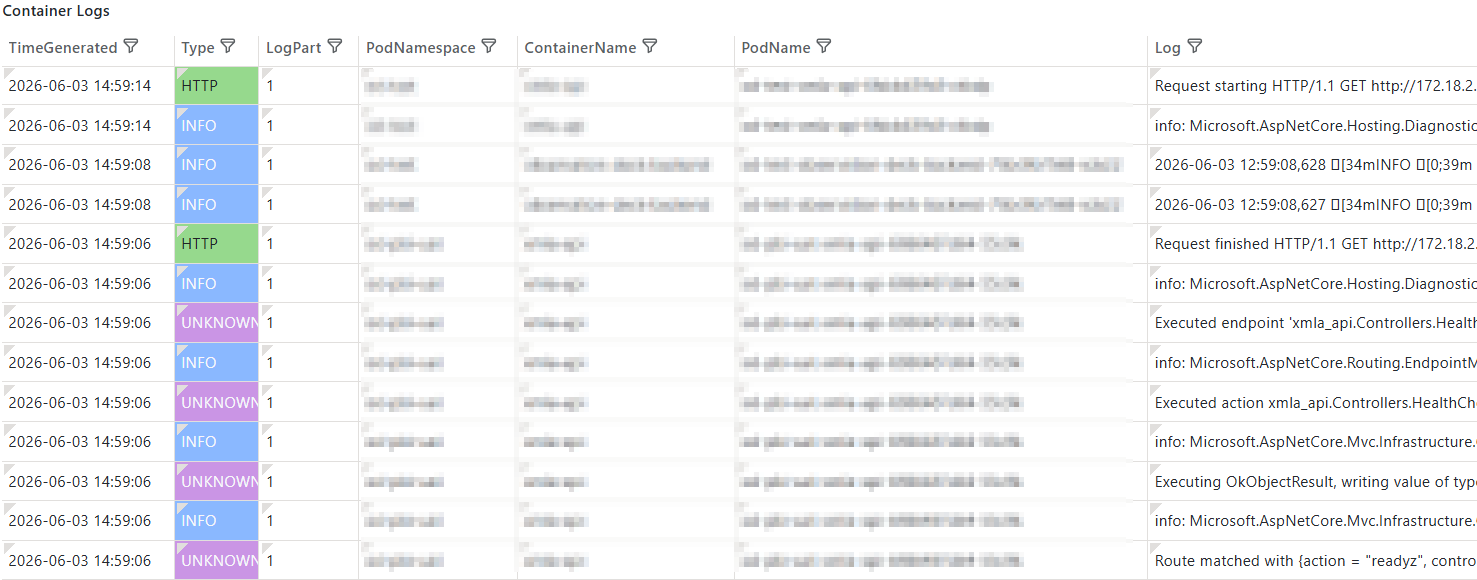
The Container Logs view uses this enhanced structure to provide a clear and centralised view of all logs generated by containers running in AKS. For each entry, users can see when the log was generated, its severity or category, the originating namespace, pod, and container, as well as the complete log message. This allows operators to identify issues quickly, filter logs by workload, and focus their attention on the components most likely to be affected. This view can be built using the ContainerLogV2 table.
The table below presents the Container Logs view:
Visualising PostgreSQL Logs
One of the visibility gaps in our monitoring strategy was the database layer. Whilst we had insight into the application and Kubernetes infrastructure, we had limited visibility into what was happening inside our PostgreSQL flexible server instances, making it difficult to identify database-related issues, investigate failures, and correlate backend events with application behaviour.
We decided to enable diagnostic settings on the PostgreSQL flexible server and to integrate its logs into our centralised monitoring platform. This approach provided access to database events and errors, significantly improving our ability to detect and troubleshoot issues.
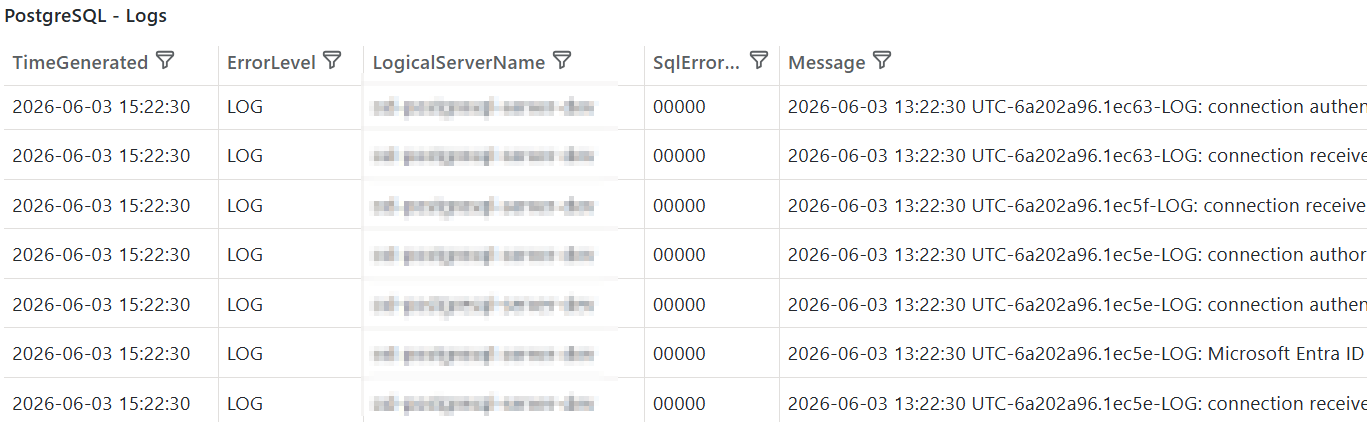
The PostgreSQL Logs panel offers a consolidated view of all logs generated by the PostgreSQL flexible server. For each log entry, users can see the timestamp, server name, error level, SQL error code, and complete log message. This information enables teams to monitor database activity in near-real time, identify anomalous behaviour, and investigate database-related incidents before they affect the application and its users. This view is based on data from the PGSQLServerLogs table.
The following table shows the PostgreSQL Logs view:
Tracking Pod Health and Kubernetes Events
Let’s look at another example of a monitoring view, this time using the predefined KubePodInventory table. The Pods Status metric provides an overview of the number of pods in each Kubernetes state, allowing users to quickly identify unhealthy, restarting, or pending pods directly from the Grafana dashboard, speeding up issue detection and reducing the need for additional tools.

In addition to these observability views, we can monitor several other key indicators, including Error Log Volume by Pod, Certificate Logs, Ingress Controller Logs, and Kubernetes Events. Together, these views offer valuable insights into the health and behaviour of the platform, enabling the rapid identification, investigation, and resolution of unexpected issues. Visibility across different layers of the infrastructure means a more efficient response and reduces potential impact.
Conclusions
In this blog post, we introduced Azure Monitor, with a particular focus on Log Analytics and Grafana dashboards, and showed how these tools support centralised observability, advanced analysis, and custom visualisations.
We then applied these concepts to a real-world use case: monitoring our Observation Deck across Azure Kubernetes Service and a PostgreSQL flexible server. By using Log Analytics as a central repository and Grafana as the visualisation layer, we created a solution that helps our team monitor critical resources, investigate issues more efficiently, and maintain a clear overview of the platform.
Effective monitoring is not simply about collecting telemetry; it is about turning that information into actionable insights. By combining Azure Monitor, Log Analytics, and Grafana, organisations can build a scalable observability framework that improves reliability, accelerates troubleshooting, and supports the long-term success of their Azure environments.
If you are interested in monitoring your Azure infrastructure or have any questions about Azure Monitor and its capabilities, please don’t hesitate to contact us!