24 Ene 2024 Customising Tooltips for a Kendo TreeMap
Kendo UI is a versatile web development framework and set of JavaScript UI components from Telerik, providing developers with a powerful toolkit to build modern, responsive, and interactive web applications. The focus of this article is the TreeMap, a prominent chart in the Kendo UI catalogue, where a tooltip limitation has been identified.
The main constraint was the inability to customise the background or text colours of the default tooltip in the Kendo TreeMap. This issue creates visual inconsistencies, particularly noticeable when the TreeMap features numerous squares with limited space for a clear display or specific hovering. In this article we’ll detail how to tailor each tooltip’s background to match its corresponding square, enhancing the overall robustness and coherence of the display.
Additionally, we’ll delve into two other valuable customisations: firstly, how to create a selector to highlight one particular square in a specific colour, and secondly, how to apply a corporate colour range to the TreeMap using ChatGPT, significantly improving the professional appearance and brand alignment
Kendo TreeMap Customisation
In the following case we use publicly available data from cities across the United States, showing their populations. This data is categorised by state capital cities and presented in a historical format using JSON. To access the population value of each city, users must hover over the corresponding city/square, triggering a tooltip that displays the number of residents. However, by default, Kendo configures the tooltip in a neutral colour, leading to potential confusion, particularly with smaller squares. This disassociation between the tooltip background colour and the square colour significantly diminishes the user experience (UX).
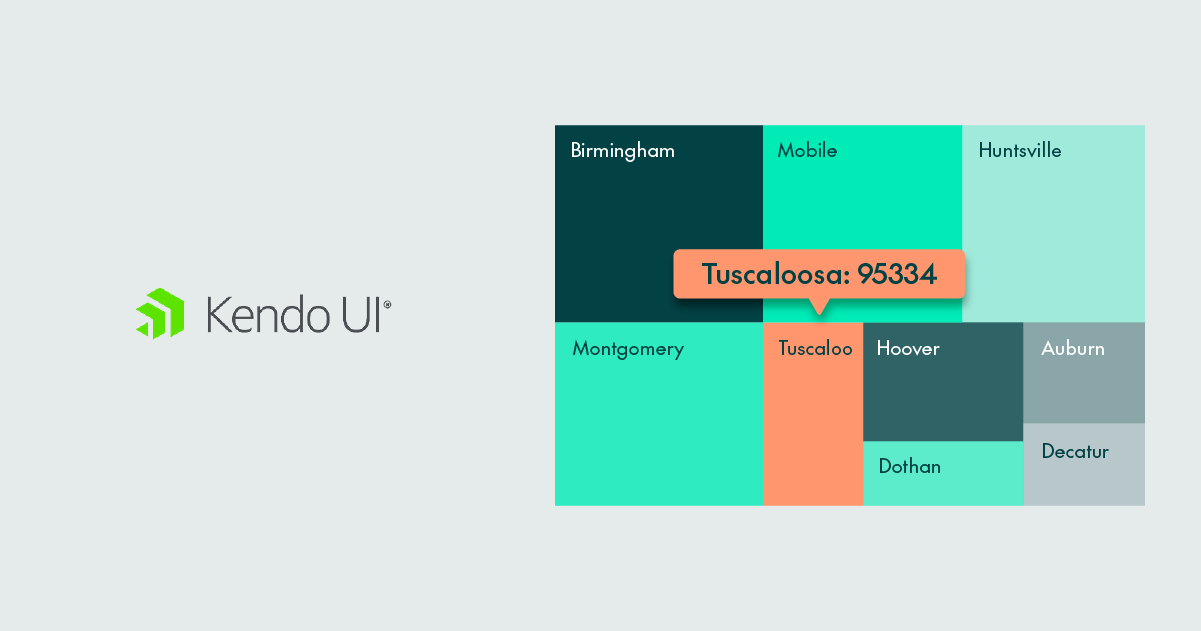
Please find below the default TreeMap template from the Kendo website:
As we can see, the tooltip’s bland design hinders users from reading the figures accurately. To address this limitation, we’ll integrate both the background colour (‘Color’) and the text colour (‘ColorText’) into our hierarchical dataset. Instead of hardcoding these colours for each city, we’ll adopt a more dynamic approach and develop two JavaScript functions to ensure effective functionality.
The first function will adapt the colour of the hovered square to the background of the tooltip. Given that the colours of our TreeMap are randomly selected from a colour palette (which we’ll explore in the next section), there may be instances where the text is not easily legible. To solve this, we’ll assign a text colour, either black or white, based on the background’s brightness, achieved through a code snippet that calculates the luminosity of the hexadecimal colour, subsequently determining the most contrasting text colour (black or white) for optimal legibility:
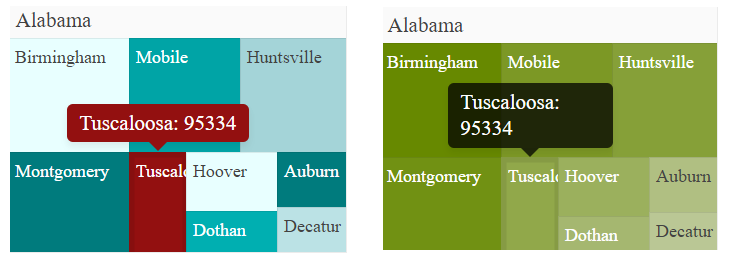
As depicted above, in the left image, the tooltip background and text colours have been changed accordingly, while the original tooltip (right image) keeps its neutral background.
The second function is designed to apply the user-selected colour to the chosen city/square. This function operates internally. When the city/square under review matches the user’s selection, the colour assignment deviates from the random allocation used for other squares, and instead uses the colour preselected by the user:
You can get the code to build this TreeMap from the Clearpeaks GitHub Repository. Between lines 696 and 708, you’ll find the Kendo Tooltip function, and from line 168 to 640, the code to build the hierarchical dataset.
On entering the TreeMap code, the JSON file is imported into the Kendo chart as a ‘HierarchicalDataSource’, complete with all nested items.
Additionally, in the ‘content’ parameter of the KendoTooltip (line 700 in the GitHub Repository), a function(e) will be added to execute the previously mentioned modifications, thus enabling the dynamic background and text colours.
ChatGPT for Generating Palette Colours
Given the significance of colour psychology in Business Intelligence, it is essential to present users with a consistent and corporate look and feel. In this section we’ll explain how ChatGPT and its advanced AI capabilities were leveraged to effortlessly generate a corporate colour palette incorporating the ClearPeaks brand colour. It’s important to note that a best practice in JavaScript coding is to specify colours in hexadecimal format.
To get this palette, the following question was posed:
User prompt: Can you give me a list of 10 colors that are part of an analogous color palette that includes the color #00afb1 in the analogous palette, sorted from brightest to least bright, in JavaScript format.

ChatGPT: Certainly! Here's a list of 10 colors that are part of an analogous color palette including the color #00afb1, sorted from brightest to least bright, in JavaScript format:


const colorPalette = [
  "#E8FFFF", // Light Cyan
  "#D1F0F2", // Pale Cyan
  "#BBE2E5", // Powder Blue
  "#A4D4D8", // Sky Blue
  "#8DD7DB", // Light Aqua
  "#00afb1", // Your selected color
  "#00A4A6", // Aquamarine
  "#00999B", // Turquoise
  "#008A8C", // Deep Teal
  "#007B7D"  // Dark Cyan
];
This palette can be found in line 138 of the GitHub Repository and applied to every city in the JSON dataset.
Conclusions
Customised charts play a pivotal role in business intelligence, offering a range of benefits that significantly enhance the value of data visualisations. Kendo enables you to go one step further using JavaScript by creating a consistent, professional appearance whilst aligning with the client’s brand guidelines. This not only enhances the aesthetics of reports and dashboards but also reinforces brand identity, fostering familiarity and trust, and increasing user adoption.
We hope this article has enriched your JavaScript toolbox and inspired you to customise and enhance every chart, always a top priority for us in our projects. ClearPeaks is continuously striving to improve the user experience and drive innovation in industry standards, and if you are interested in leveraging UX enhancements in Business Intelligence, please get in touch with our dedicated team and we’ll be happy to help.