16 Mar 2022 Data Governance with Azure Purview
Everyone’s talking about data governance nowadays. And every company wants to be data-driven, as it is proven to be the best way to succeed in today’s intercommunicated global market. Success in this realm depends on well-defined data governance policies and the proper tools to check data quality and status.
Data governance affects many data-related fields in an organisation: metadata management, data ownership and maintenance, data access through a data catalogue, storage, status and lineage, as well as providing business context to data. However, finding a data governance tool that meets these requirements and those of your company too can be tricky.
In this article we are going to talk about a new data governance service recently introduced to the Azure stack, Azure Purview. We are going to explain this service and see how it can be used to enhance data governance in Azure data platforms. If you would like more information about data governance and other hot buzzwords out there, such as Data Mesh, Data Lakehouse, DataOps and data observability, please check out this other blog post of ours.
1. Azure Purview
Every day, organisations produce and deal with more and more data, usually spread across one or more clouds, SaaS applications and on-prem, making it difficult to manage and control data quality and status. To address this problem, Azure has released Purview – a SaaS solution that brings data from your organisation together in a single place. However, bear in mind that at the time of writing it is still under development, so some features are in preview and not fully functional.
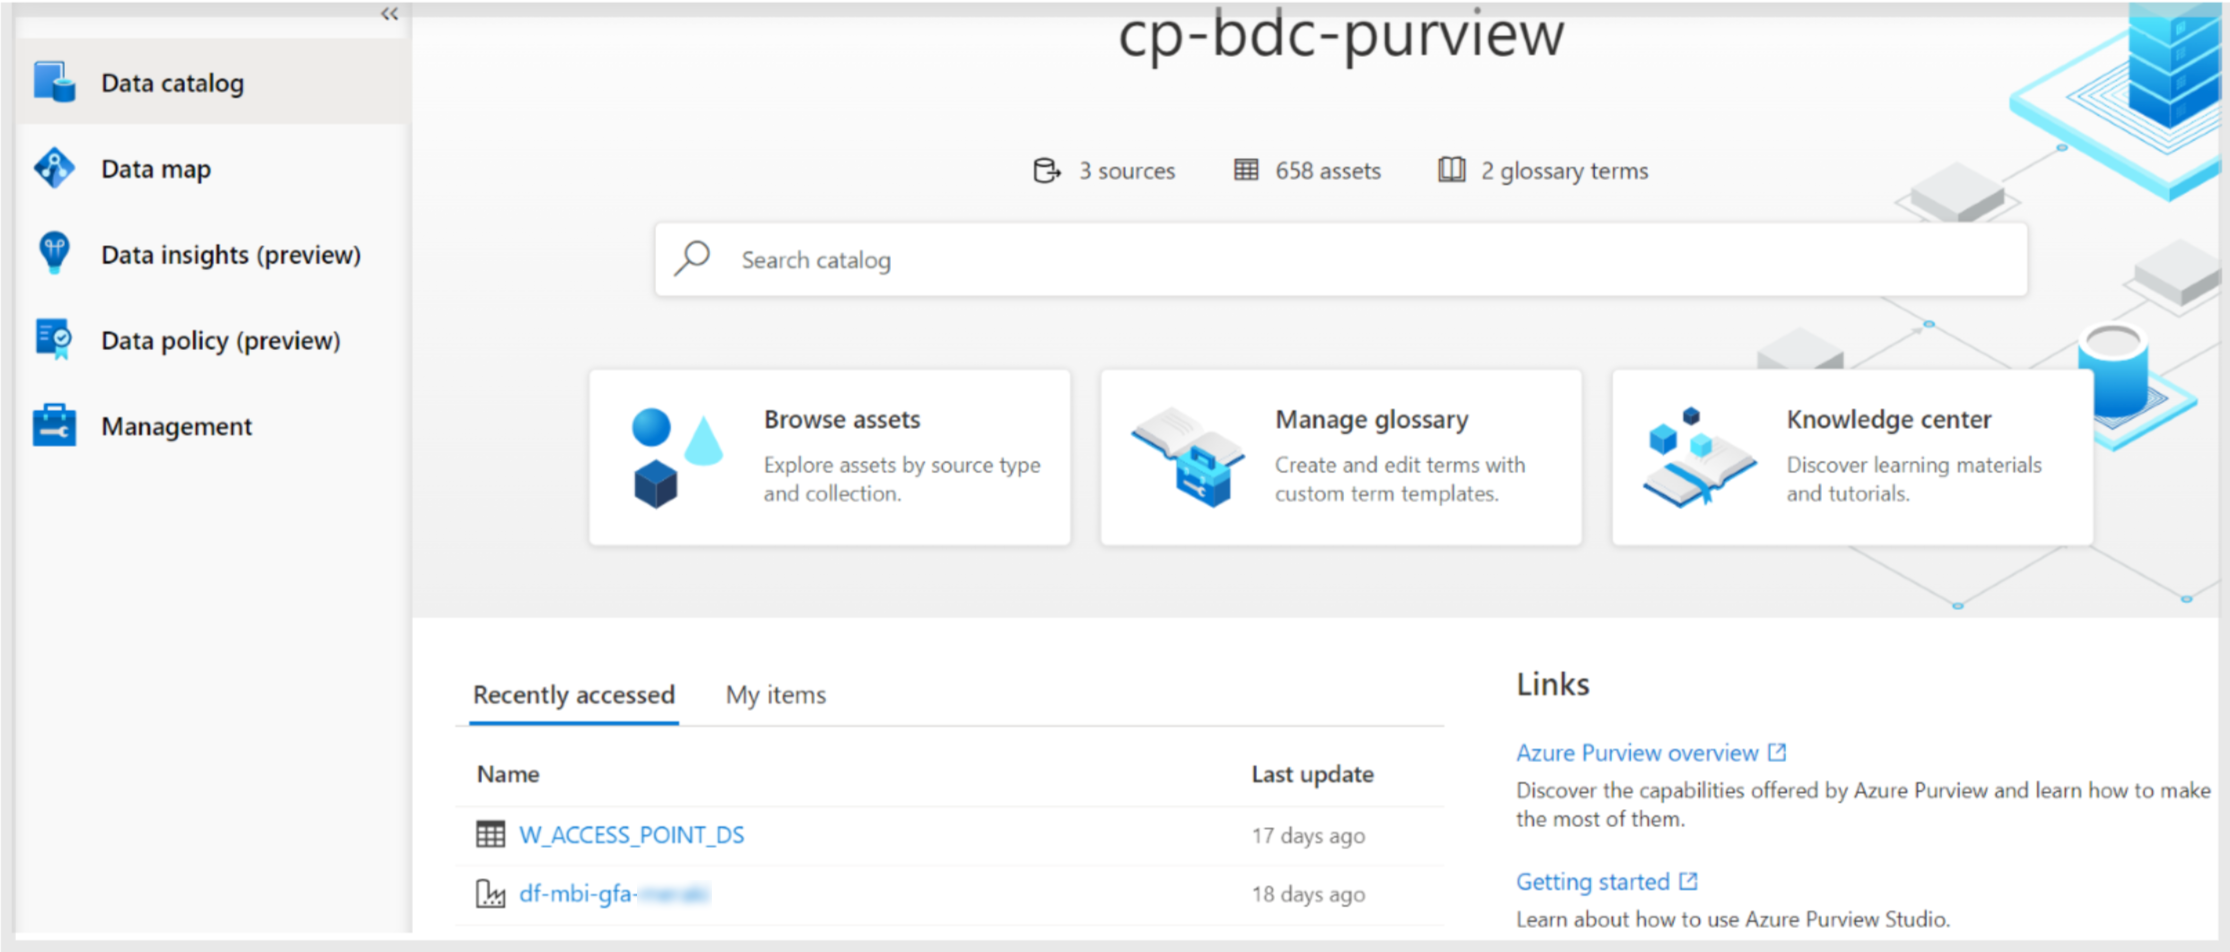
Figure 1: Purview landing page.
To start using Purview, you must create a Purview account and then access the Azure Purview Studio. On entering the studio, we can see five items in the left panel:
- Data catalog: incorporates a browser to search your scanned data, and glossary management that allows you to define business terms and link them to scanned assets, enhancing the browser.
- Data map: allows the scanning of data from your sources (in Azure, multi-cloud, on-prem, or SaaS applications).
- Data insights (preview): where you can view and filter data plotted in different charts about the assets, scans, glossary, classifications, and sensitivity labels.
- Data policy (preview): where you can assign data owners to resources, so they can manage access. If you want to learn more about this section, we recommend you take a look at the documentation about data owner policies for Azure Storage and resource groups or subscriptions.
- Management: allows you to enable an additional feature called resource sets, to configure Data Factory and Data Share connections, and to create credentials (connection strings) to manage external connections. There is also a section to manage private endpoints.
In the following sections we are going to delve into the main components: Data map, Data catalog and Data insights. We’ll skip the other two and start with the Data map, the first thing to get to know in Purview.
1.1. Data Map
This is where you can define your sources that, as said before, can be in Azure, from other clouds like AWS, SaaS applications like Snowflake, or on-prem. Access configuration depends on the source: for instance, to access data in your Azure subscription, you will have to configure a manage instance (generally the Purview account default) providing the Reader role to the desired services. On the other hand, for external services, you will have to define credentials or integration runtimes.

Figure 2: Purview Data map.
As you can see in the image above, the dashed boxes are the Sources, which belong to the other boxes called Collections. Collections are basically logical folders that group sources or other collections, where you can apply some access policies and roles. Each Source must belong to a Collection, and only one.
Defining sources is not enough to retrieve the data; this only defines the name for the source and provides some source connection configuration like the storage account name for Azure Blob storage or the bucket URL for AWS S3. To actually read the metadata and be able to browse it in the Data catalog, you need to define and run Scans.
Scans can be created inside each source, and this is where you configure the connection mechanism (using Manage Identity, Azure KeyVault or a connection string, etc.), what data you want to scan (only one specific database, one bucket, etc.), and also the periodicity (just once, or recurrent for incremental or varying data).
The scanned data available in the catalog is called an asset. An asset can be a file or a folder containing many files in a data lake, a table, or an entire database, a Power BI report, etc. Once scanned, you can view all the related information on the asset page.
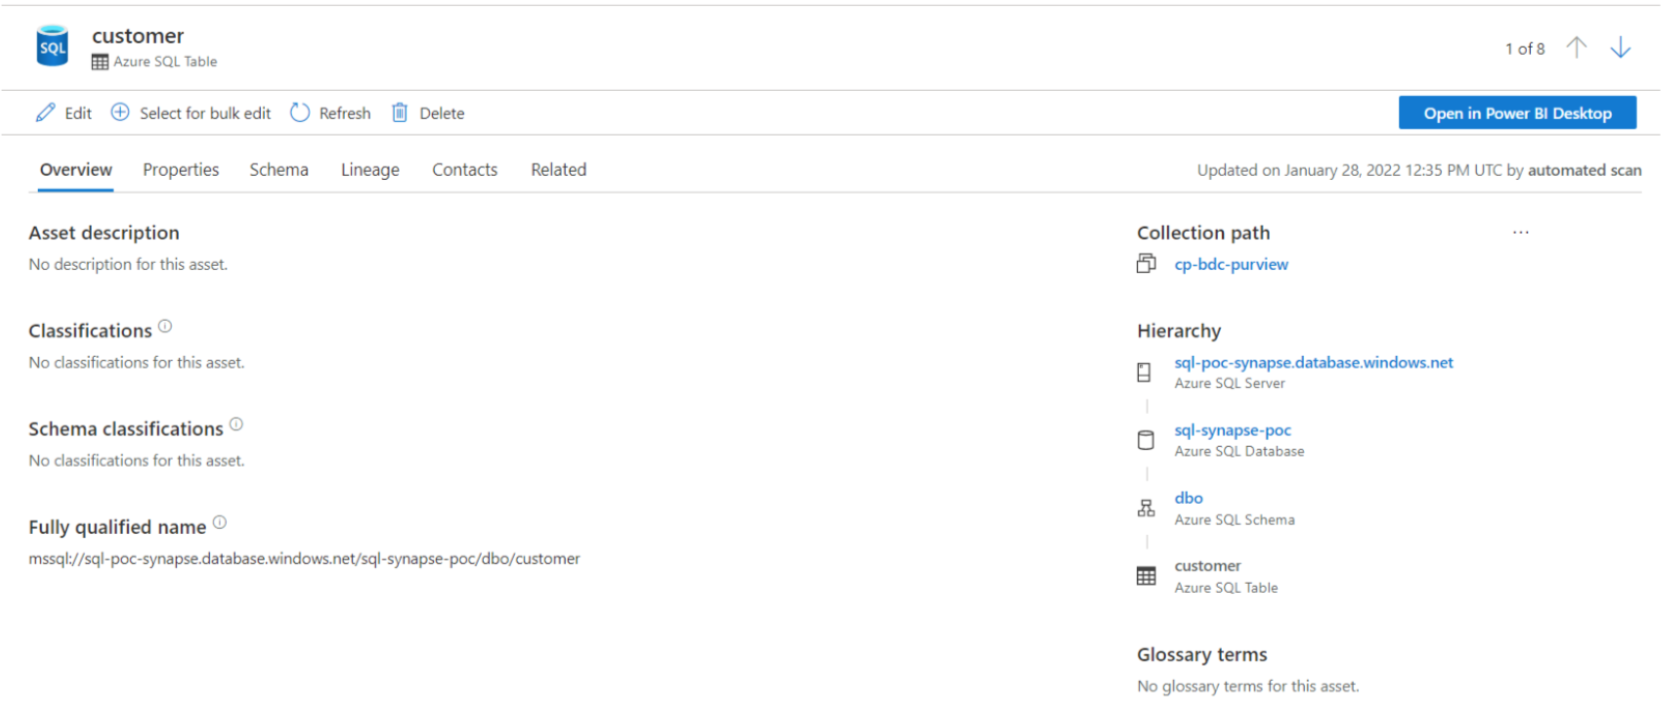
Figure 3: Asset page.
Moreover, you can add additional information, for instance, a name and description; you can assign the asset to specific data experts in your organisation, the business experts on the asset-related subject area, and to data owners, who define the data governance or the business process of this asset. Lastly and most importantly, you can check the asset schema (usually for databases and Power BI reports) and its lineage, which we will cover in more depth later.
While scanning, beside the data discovery task, you can also apply additional metadata annotations to the scanned assets. These annotations are called Classifications.
1.1.1. Classifications, Classification Rules and Scan Sets
Classifications are annotations you define that will be attached to assets, providing additional information about the assets and enabling other filtering options in the Data catalog browser. Although you can set classifications manually for each asset from the asset page, you can also define classification rules, where you can define a regex or a set of possible values that will classify the data in the specified classification automatically if it matches the rule.
To apply these classification rules automatically in scan, you must first define the scan rules sets, where you can configure what you want to scan for a single data source (for example, only CSVs in Blob storage), and attach the classification rules to be applied in the scan. Therefore, in this example, all the CSVs in the Blob storage that match the classification rules will be assigned to the specified classification; you will be able to search for the asset by this classification.
1.2. Data Catalog
The main component in Purview is the Data catalog, where you can browse through your assets by collection or by source type.
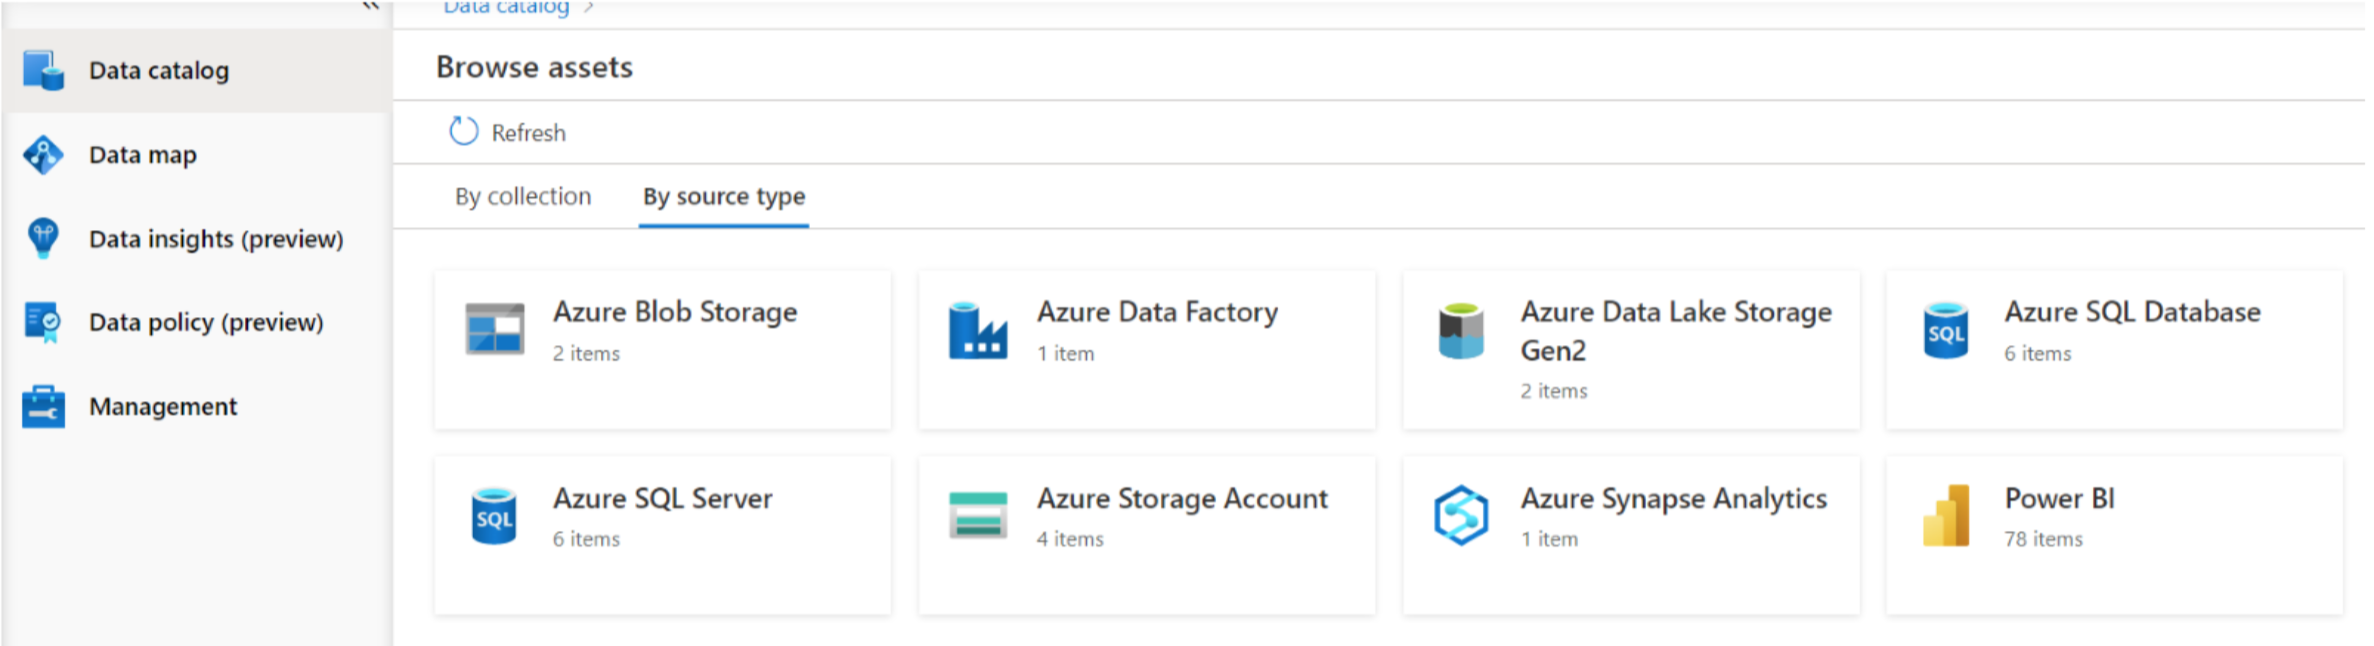
Figure 4: Data catalog: browse by source type.
Furthermore, you can filter the results with many fields like the object type, classifications, data owners or experts, glossary terms, etc. Once you find the desired asset, you click on it and land on the asset page, where you can see all the related information and a direct link to the service.
Of course, when going to the specific service, you will need the required permissions to access it. Purview doesn’t manage resource permissions, this can only be done through Azure IAM in the case of Azure resources, or external access control mechanisms in other cases.
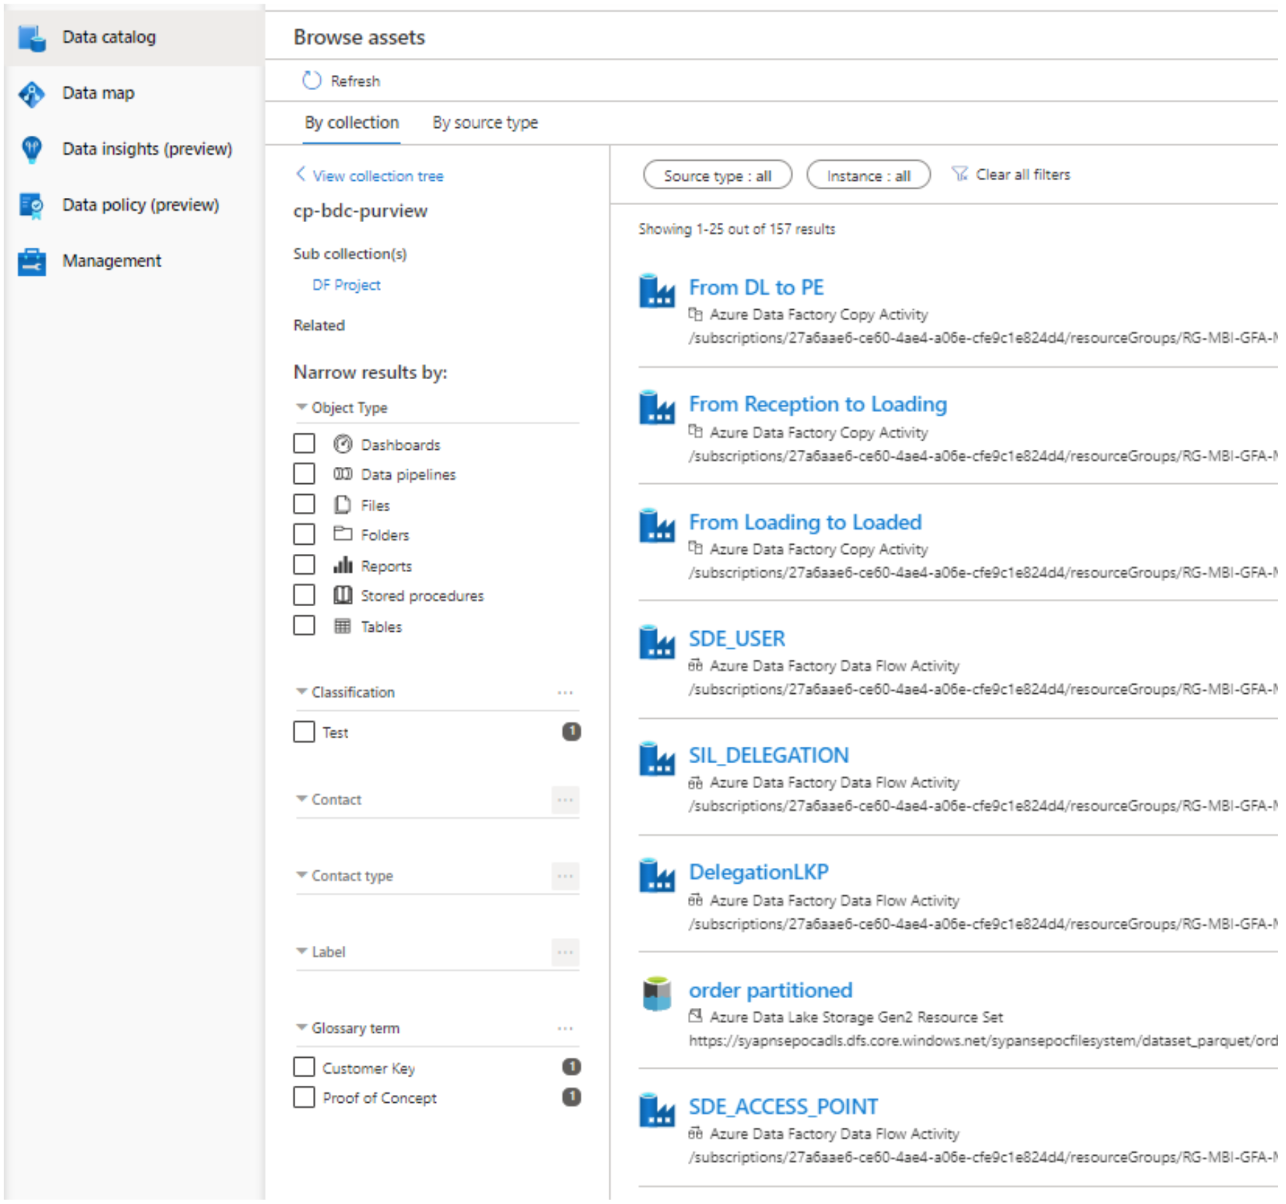
Figure 5: Data catalog: browse by collection.
1.2.1. Glossary Terms
Glossary terms are business keywords that you can define and add to your data, providing extra filtering capabilities to the Data catalog, thus enhancing your organisation’s data governance.
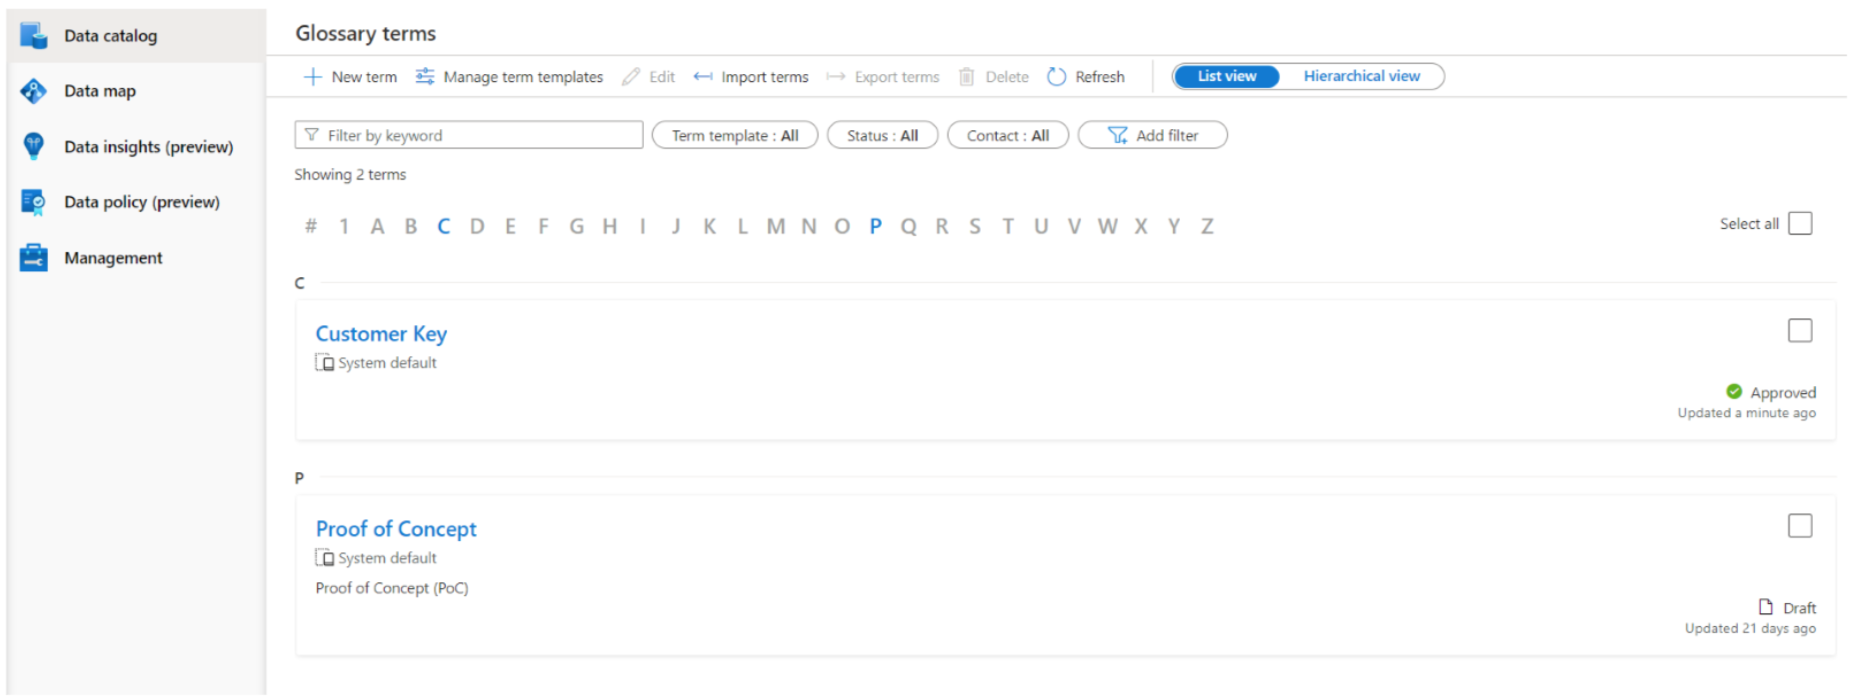
Figure 6: Glossary terms page.
Similar to assets, glossary terms also contain further metadata that can be seen and modified in the term page. You can define its name, description, acronyms, and so on. It is also possible to establish synonyms between terms, relate terms to others, or sub-terms from a term (children terms). Like assets, you can assign data experts and data stewards (people that define business terms) as contact points for each term. Finally, each term also contains an explanatory status:
- Draft: this term is not officially implemented.
- Approved: this term is official/standard/approved.
- Expired: this term should no longer be used.
- Alert: this term needs attention.
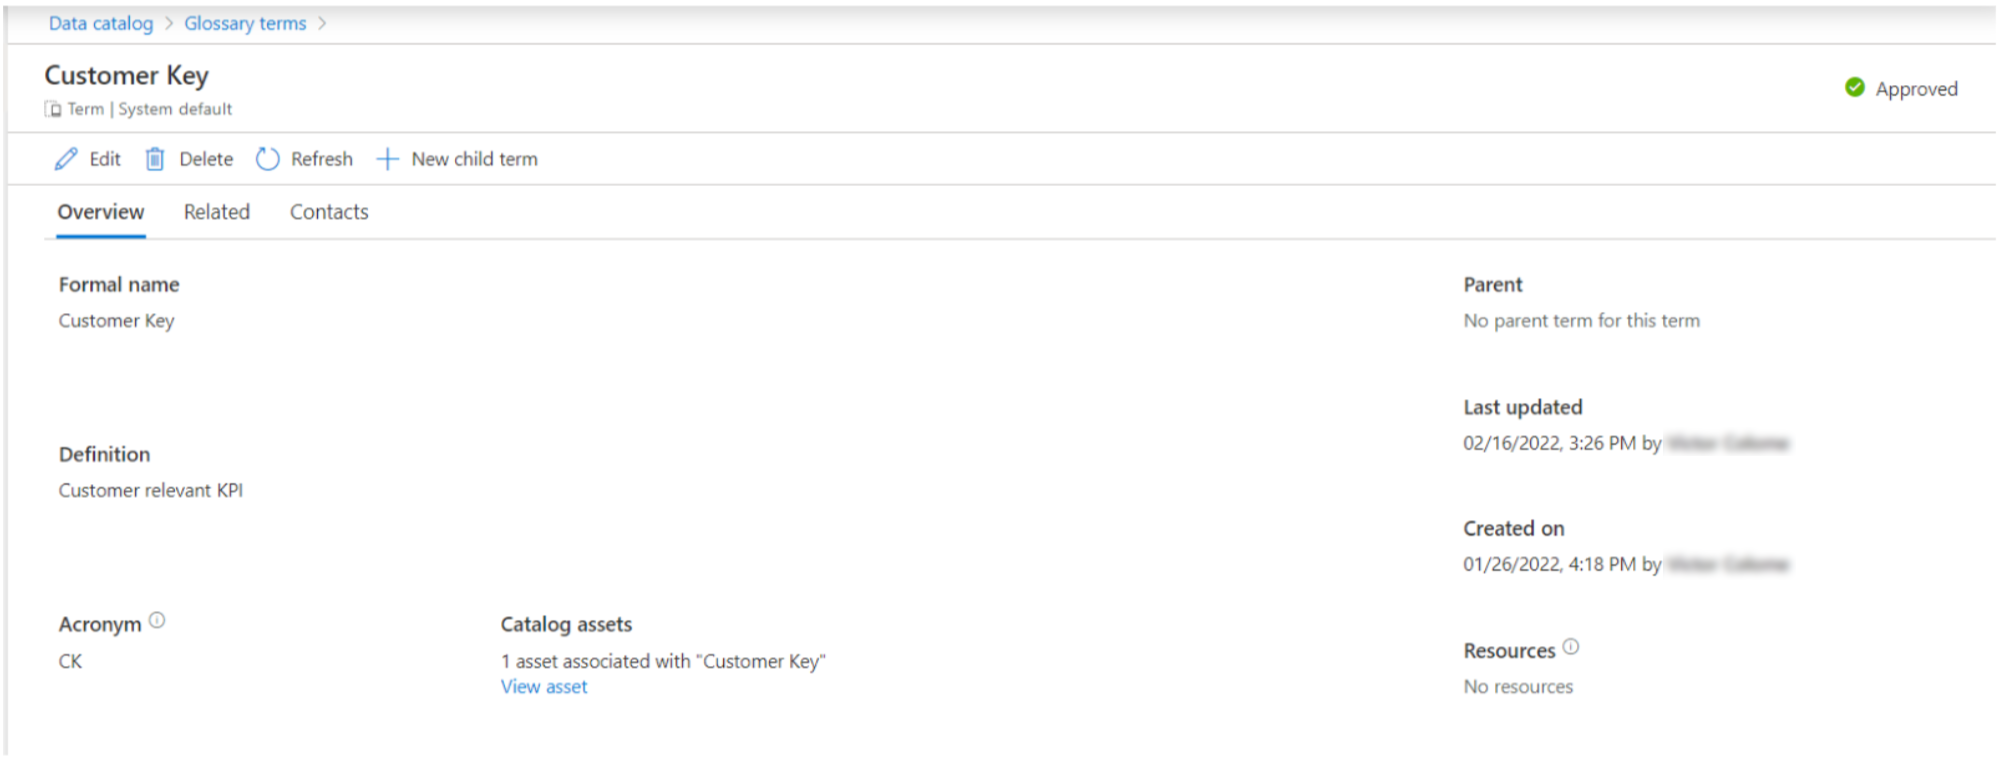
Figure 7: Glossary term.
Additionally, if you want to incorporate more information to terms, you can create a term template that basically allows you to create more fields to be filled when creating and updating terms. These fields can have text, single choice, multiple choice, and date formats.
1.3. Data Insigths
Everything here is automatically generated; as we said before, this is where you can view insights about:
- Assets: there is a tree map by source type, a line chart for file-based source types by count or size, and a bar chart where the files are not stored in resource sets. The visualisations can be filtered by classification and source type.
- Scans: we can see the number of successful, cancelled, and failed scans, and a bar chart timeline representing these numbers, which can be filtered by date.
- Glossary terms: we can view information about the amount of glossary terms, a pie chart representing the status, and another pie chart regarding the contact points associated to the terms.
- Classifications: here we can find the number of classifications and assets classified, represented in a few KPIs and four visualisations with the top classifications.
- Sensitivity labels: we can find the same information as in the classifications tab, but regarding sensitivity labels.
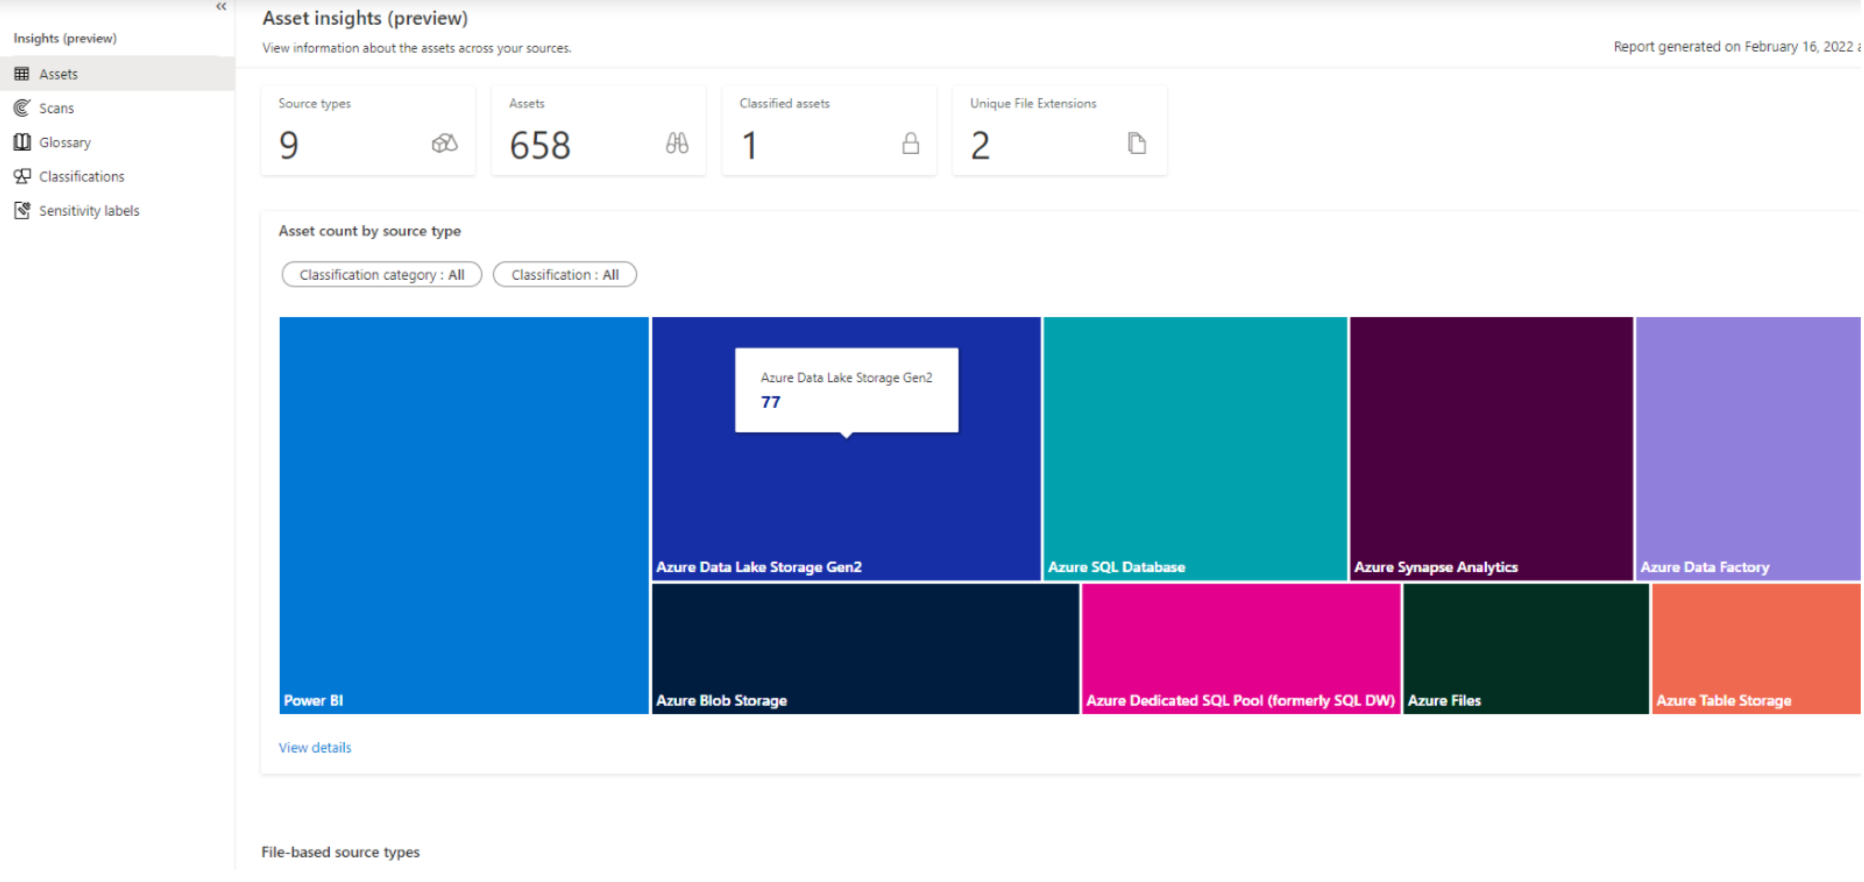
Figure 8: Data insights.
All the visualisations also offer a “View details” button that displays the information in tabular format, and when clicking on a result, you are redirected to the Data catalog with all the corresponding assets.
2. Lineage
Data changes from the moment of its creation to the time of its consumption, and tracking these changes can be hard. Purview enables Lineage to check the data lineage of each asset. Data lineage is a concept that we have already explained in previous blog posts such as Data Lineage in Power BI. Basically, it encompasses the process of monitoring the flow of the data, its status, characteristics, and quality.
Lineage in Purview is especially powerful in services like Data Factory, data lakes, and databases. For ETLs that contain, for instance, an ADLS, an SQL database, and Data Factory pipelines that transform and move data between the first two services, you can obtain a view like the one in the image below:
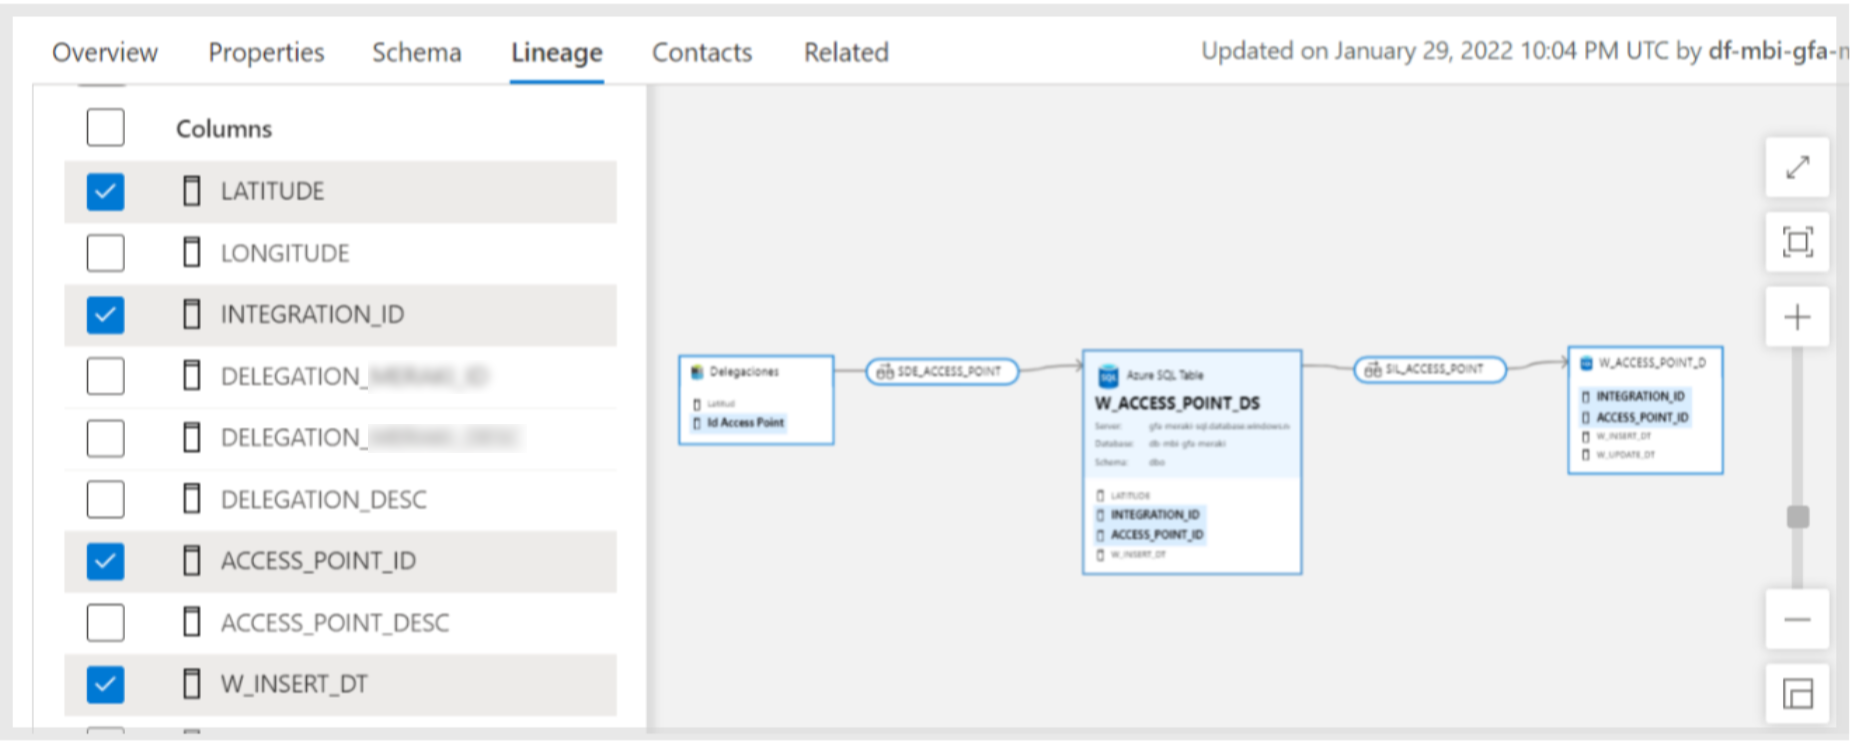
Figure 9: Lineage section.
This view can be accessed from the asset page in the Lineage tab. In this case, we have three assets and two pipelines. As we can see, the first asset on the left is a file stored in ADLS, and the other two are tables in an SQL database. Currently, we are looking at the lineage from the point of view of the asset in the middle, which means that on the left we can see the columns from that asset’s schema.
It is possible to select some or all columns from the left tab, which will make them appear in the lineage visualisation so you will be able to see where it comes from and where it goes. Moreover, you can hover over a column, for instance in this case we hovered over a column in the data lake asset, and two columns are highlighted in the other assets. This means that both columns come from the one in the data lake.
Furthermore, it is possible to switch between assets, so you can change the point of view and the corresponding columns will appear on the left. In the pipeline scenarios, instead of looking at the owned columns (there aren’t any as the pipelines only process data), you can select to view the input or the output schema, so you will be able to do the same as before, selecting and highlighting the columns you want to inspect.
Regarding Power BI lineage in Purview, after configuring the connection and scanning the data, you will have many assets representing workspaces, reports, datasets, and dashboards. Unfortunately, the image of the data flow generated in this case starts from the Power BI dataset source (in this case an SQL database), instead of displaying the entire flow from its creation, like in the previous scenario where we saw the origin of the data in the data lake. The image looks like this:
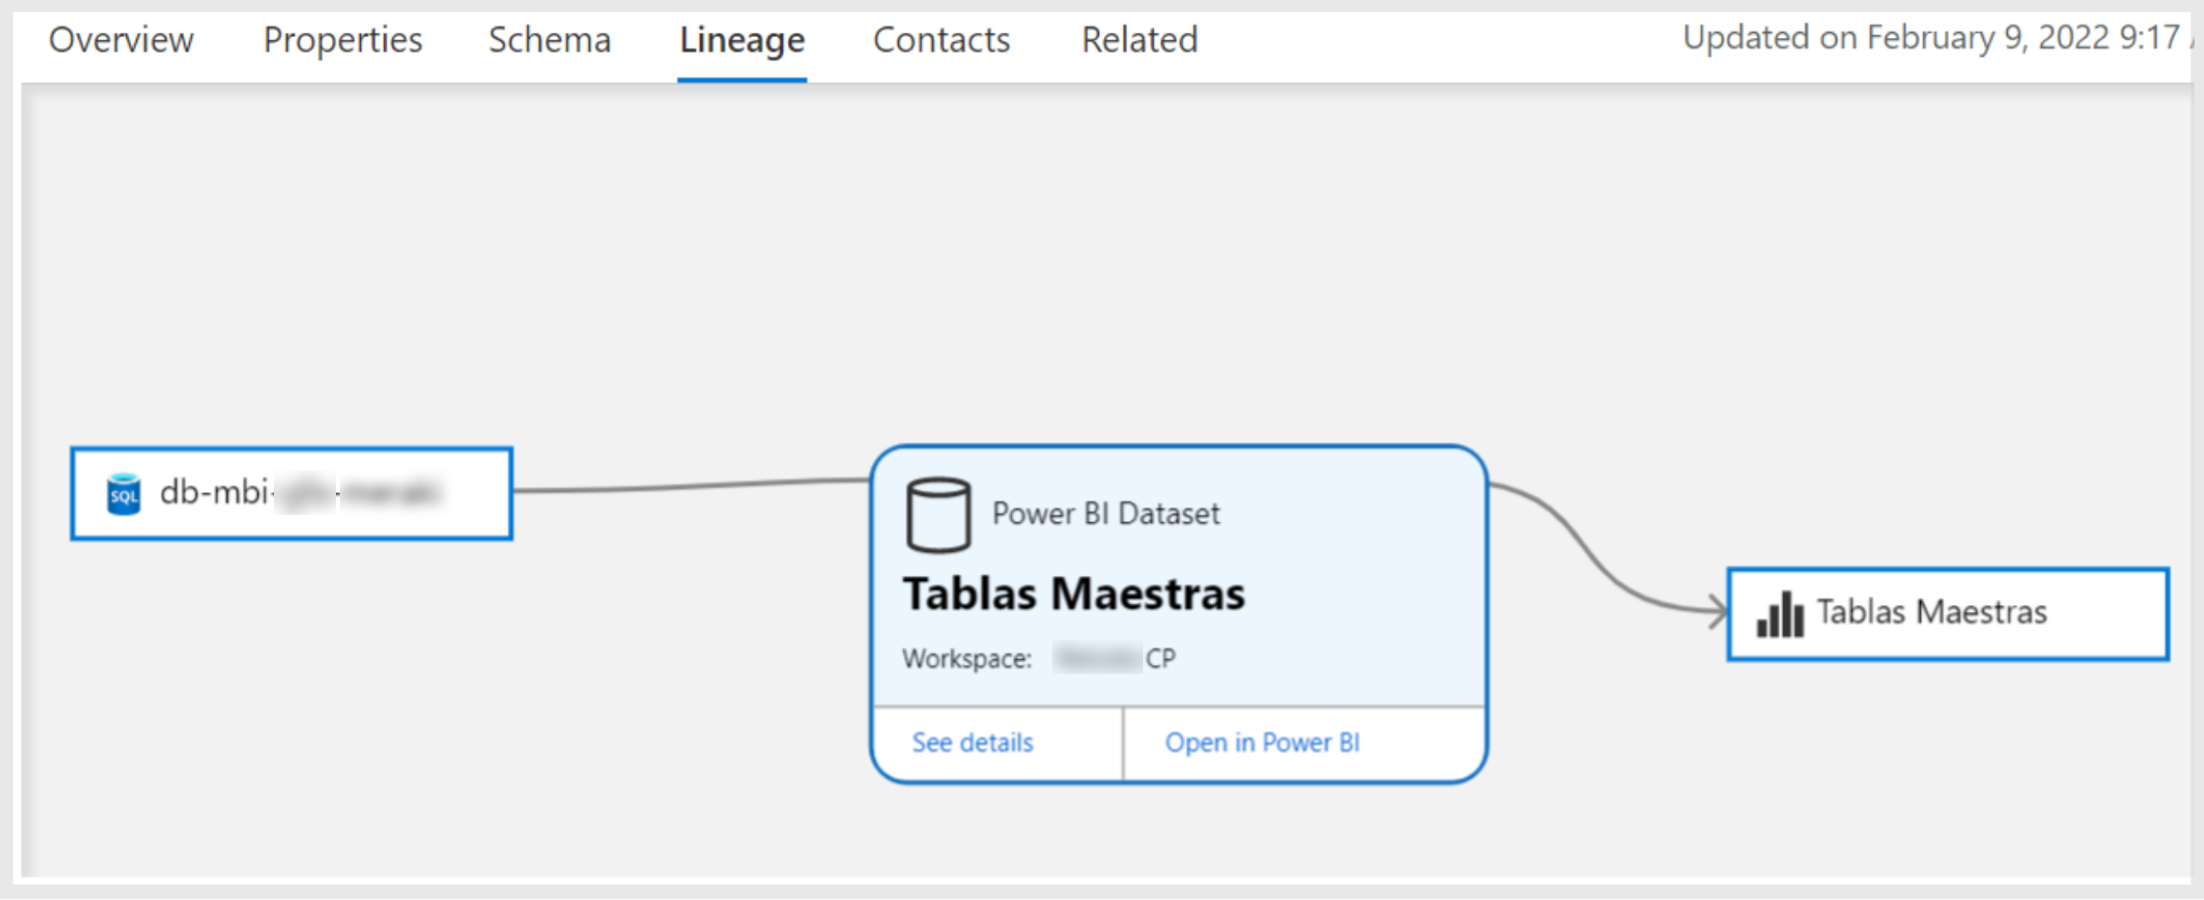
Figure 10: Power BI lineage.
As we can observe, we can’t see the entire data picture, as we know that before the SQL database the data comes from an ADLS through a Data Factory pipeline. Moreover, in addition to this disconnection in the lineage between the data platform backend and frontend, in Power BI there is not the same level of column detail, so it is not possible to check how a column from an SQL database is used in a Power BI report or dashboard. To sum up, while lineage is indeed really powerful in some services like Data Factory, in services like Power BI it is still at an early stage.
3. Pricing
Pricing is complex in Purview as it is a SaaS service where you don’t have much control over the resources. Purview pricing is well documented in Azure’s official website, but in general it is based on these factors:
- Storage: Purview allocates 1 Capacity Unit (CU) for storage. 1CU represents up to 10GB of asset metadata stored and costs $0.411 per hour per CU. If you exceed these 10GB, you will automatically be provided (and billed) with an extra 1CU (10GB). This storage is difficult to calculate as there is no documentation about how much metadata is going to be stored for scanning data. However, it is possible to monitor the storage from the Purview account Metrics section, through Azure Monitoring.
- Scans: Scans work with serverless compute, and you are billed depending on the duration of the job execution. In this case, you are billed $0.63 per 1vCore per hour. Once again, it is hard to tell how much you are going to be billed for scanning your data, as many factors are at play.
- Resource Sets: Additionally, you can enable this feature to optimise the storage and hence the search of assets. This optional service costs $0.21 per 1vCore per hour.
In addition, when creating a Purview account, two managed services are also created: a Storage account and an Event Hubs namespace, which handle the storage of metadata and the scan triggering. These services, however, only represent around a 2% of the total cost of Purview.
As always, we recommend you use the Azure calculator to estimate the cost.
4. Conclusion
Purview provides tools to read data from any source in your organisation, centralising data governance (some aspects at least) and data lineage in a single place, allowing you to explore your data with a data catalogue and to add additional metadata.
Nevertheless, as we mentioned at the beginning, this is a new service, so things are still missing. The main problem we found in Data Factory is that it is currently not possible to scan pipelines containing stored procedures, so you can’t check lineage.
Regarding Power BI lineage, currently, you can’t get the entire picture from the end-to-end data lineage, starting in the backend and finishing in the frontend. Finally, some external sources like Cloud Storage, Redshift, etc. are also missing. However, having said that, we know it is only a matter of time before all these things are implemented.
In this blog post we have just presented, in general terms, Azure Purview and its components and capabilities. If you want to implement data governance in your Azure data platform but don’t know how to get started, don’t hesitate to contact us as we have ample experience defining and implementing data governance in our customers’ platforms.