08 Sep 2014 Pop up effect in OBIEE using jQuery
In this article of our OBIEE Customization Series I will show you how to introduce the Pop up effect in OBIEE using jQuery. The tooltip can provide additional details (like an explanation of a KPI) or load content such as target report.
Motivation
For our example let’s imagine we have a summary level report with purchase orders listed. We can navigate to order details level, but that would require leaving the current page or opening the content of detail report in a new window. What if we could have a summary level report and peek into details on the same page? Implementing the dynamic navigation to a report inside the tooltip will allow us to achieve that.
Because OBIEE Answers and Dashboards allow using web technologies such as HTML5, JavaScript, CSS3, and AJAX we are able to customize the look and user interface of any report just like we can do with websites. To achieve that, we will use the most popular JavaScript library called jQuery. It’s an optimized .js file containing Document Object Model (DOM), events, effects and Ajax functions that can be called from the report. JQuery is widely used in website development and allows implementing complex components using pre-defined methods defined in library. For the tooltip we will need also a plugin, an additional library that defines the effect. There are many available plugins for tooltip functionality both free and requiring paid license. Many UI libraries such as jQuery UI or Kendo UI offer, among others, a tooltip functionality. For the example in this article we will use the Tipped tooltip library, which offers a lot of customization options but requires a licence for commercial use. As an example in this article we will invoke a tooltip that loads the contents of target report when hovered on a column’s value. To create this effect we will need to use AJAX technology. Such method is already included in the jQuery library. We will need to specify the target page or report from which the external content will be loaded.
Implementing the tooltip
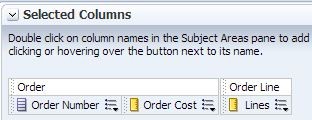
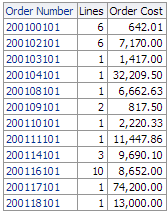
Let’s start by creating a simple report showing Order Number, Number of Order Lines and Order Cost.
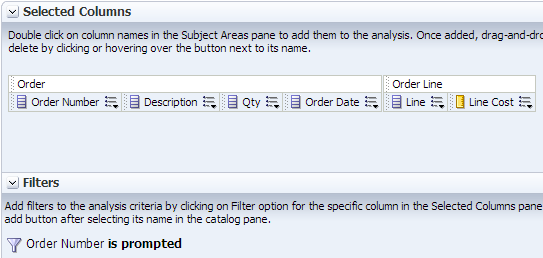
Our objective here is to provide additional information of the orders displayed in the first report but without navigating. Therefore let’s create another simple report that will contain more details on a given Order and its Order Lines. We need to add a filter – Order Number is prompted to enable navigation.
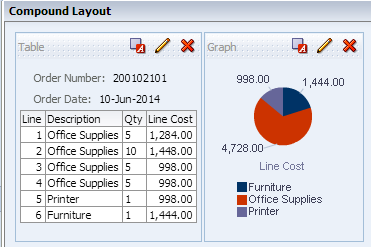
Let’s go to the results tab and edit the views. The contents of this report will be displayed in a tooltip. We can add a pie chart with breakdown of the line cost and save the report as Order Lines Report.
Let’s get back to the main report. We will need to add a static text view with code to load libraries. Those files could be referred pointing to the file on the internet (we can do it by loading jQuery library from google developers and for example jQuery UI library which contains tooltip functionality). However we should have those files on our OBIEE server. Often internal network security settings disallow loading content (especially script files with .js extension) from external sources. A one-domain policy is used to prevent security breaches. Because of that we will need to save those library files on OBIEE server. To be able to link a file on a OBIEE server we will need to create a virtual directory on OBIEE server in weblogic settings. When we have the virtual directory created we can refer to the libraries using such link: http://localhost:9704/userfiles/jquery.1.9.0.min.js
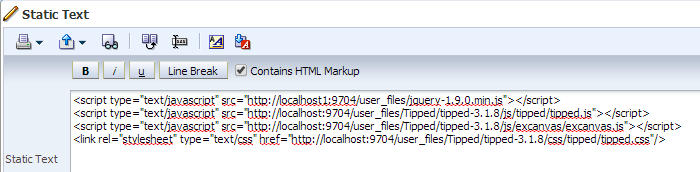 First, we need to load the jQuery library:
< type="text/javascript" src="http://localhost1:9704/user_files/jquery-1.9.0.min.js"></script>;
Tipped libraries:
<type="text/javascript" src="http://localhost:9704/user_files/Tipped/tipped-3.1.8/js/tipped/tipped.js"></>; < type="text/javascript" src="http://localhost:9704/user_files/Tipped/tipped-3.1.8/js/excanvas/excanvas.js"></>;
Tipped CSS stylesheet, which contains the styles used for tooltip customization:
<rel="stylesheet" type="text/css" href="http://localhost:9704/user_files/Tipped/tipped-3.1.8/css/tipped/tipped.css">;
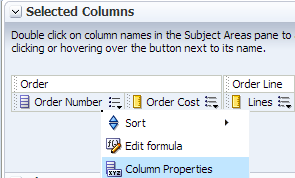
Then let’s edit the column formula to dynamically generate a tooltip with navigation to Order Line Details.
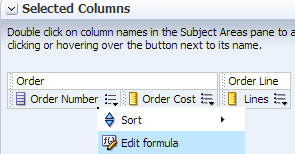
We need a couple of elements here. Instead of just “Order”.”Order Number” column value we need to embed some more elements in the formula code. The code inside will contain HTML tags so let’s mark Constains HTML Markup option.
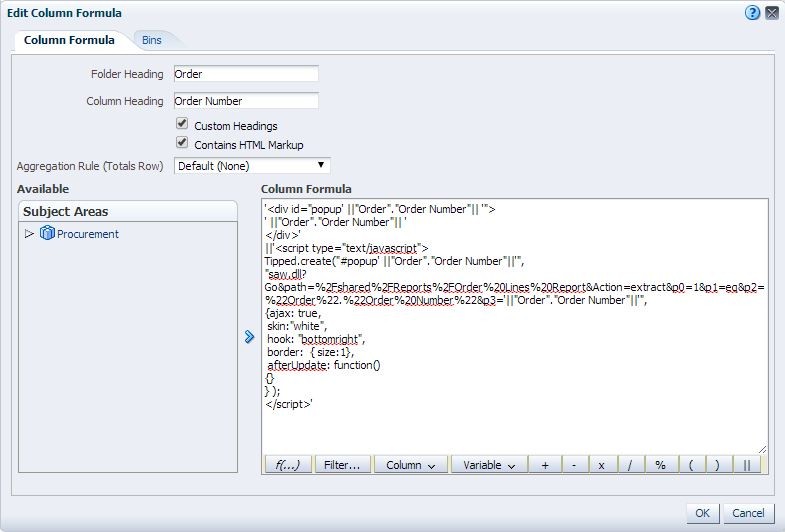 For our example we will need to use the following column formula:
<div id="popup' ||"Order"."Order Number"|| '">;
' ||"Order"."Order Number"|| '
/>;'
||<script type="text/javascript>; Tipped.create("#popup' ||"Order"."Order Number"||'", "saw.dll?Go&path=%2Fshared%2FReports%2FOrder%20Lines%20Report&Action=extract&p0=1&p1=eq&p2=%22Order%22.%22Order%20Number%22&p3='||"Order"."Order Number"||'",
{ajax: true,
skin:"white",
hook: "bottomright",
border: { size:1},
afterUpdate: function()
{}
} );
</script>;'
Explanation: To separate HTML formatting from the OBIEE column value (“Order”.”Order Number”) we will need to use single quote (‘) and to merge HTML formatting with the column value we need to use concatenate (||).
<script type="text/javascript>;
Tipped.create("#target", "url", { ajax: true });
</script>
# is a jQuery selector that points to a single element with the given id attribute, in our case #popup div concatenated with Order Number. Then there is a url with the external content to be loaded inside (“url”). The important part here is the ajax: true option, which allows loading of external content.
<script type="text/javascript>; Tipped.create("#popup' ||"Order"."Order Number"||'So basically, the popup will display whatever contents are displayed in the url, therefore we can pass a GOURL link to the detail report passing the order as a parameter. Note the Extract parameter which displays just the results of target report in a format without the paging control, hot links and other elements.
"saw.dll?Go&path=%2Fshared%Reports%2FOrder%20Lines%20Report &Action=extract&p0=1&p1=eq&p2=%22Order%22.%22Order%20Number%22&p3='||"Order"."Order Number"||'"
Here we specify the formatting options of the tooltip. For Tipped tooltip to load external content we will need to use ajax: true option. Tipped offers richness of customization options for skins, positioning and effects.
{ajax: true,
 skin:"white",
 hook: "bottomright",
 border: { size:1},
 afterUpdate: function()
{}
}
Because the column formula does not include the whole script (it references to the scripts loaded in the Narrative View) we will get a “Formula syntax is invalid” error:
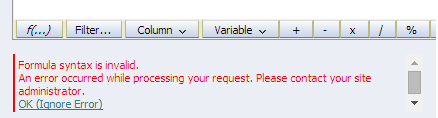
We can ignore it, as it will work correctly with the whole script at the report execution. We also need to change the Data Format Column Properties:
We need to override Default Data Format in order to treat text as HTML: 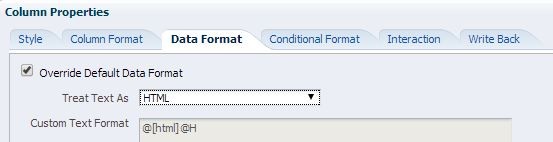
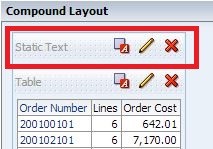
Let’s make sure that report has the Static Text view added to the Compound Layout.
Now we can try out our development. The table with Orders should display the tooltip with navigation to target report with the Order details.
On hover, the order details from the target report are displayed in a tooltip: 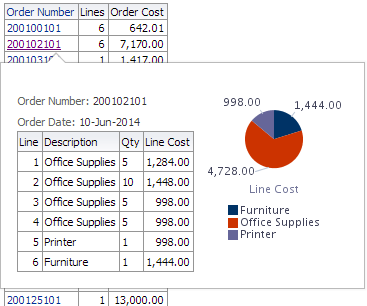
The contents of the tooltip are displayed dynamically based on the navigation condition (in our case Order Number)
Maintenance and other considerations
We need to take into consideration that by embedding scripts to the OBIEE reports we are adding another layer of complexity. This is especially true for the maintenance reasons as it requires more time and skills for the end users and developers to edit and create reports that contain scripts. Another concern should be that adding too many scripts to the report may negatively affect the performance of the report. We also need to take into consideration the web browsers used by users in the company. Some of the plugins and the latest versions of jQuery library are fully compatible only with the latest versions of browsers.
Conclusions
Thanks to the possibility of using many web technologies such as JavaScript we are able to customize OBIEE reports and dashboards. Tooltip can be a valuable tool to enhance the functionality of OBIEE reports, allowing users to get detailed information when hovering over a link. Do you have another method to achieve the pop-up effect? Please leave us a comment below, we would be happy to answer it! If you would like to know more about visual enhancements in OBIEE, read our blog posts series about enhanced visualization: Rich Visualizations in OBIEE with Javascript