06 May 2026 Power BI Dataflows for Centralised Data Sharing and Reuse
A dataflow in Power BI is like a shared workshop where your organisation prepares its data before anyone starts building reports. Instead of having dozens of people cleaning and shaping the same data separately in their own Power BI files, teams can work from the same prepared data.
Dataflows are a useful foundation for professional, scalable Power BI. They centralise and standardise data, making it easier to reuse across the whole organisation.
The idea is simple: build once, reuse many times.
Why Use Dataflows?
Let’s look at four advantages that make dataflows a practical option in many Power BI environments.
Unification
When we talk about unification or centralisation in the Power BI environment, we mean that instead of each report or analyst repeating the same transformations separately in Power BI Desktop, dataflows are built to act as a shared transformation layer across the entire organisation.
This turns dataflows into a centralised layer of clean, standardised, ready-to-use data, which multiple reports, semantic models, or teams can connect to without duplicating their efforts.
This offers:
- Data uniformity: Everyone connects to the same source with the same transformations.
- Reduced maintenance and report creation time: Tasks like correcting transformation logic do not need to be repeated in multiple reports. For example, if five reports use the same prepared table, the correction only needs to be made once in the dataflow and can then be picked up by each report after the relevant refresh.
Another important point is that centralising data simplifies access control. Multiple users can access the data without duplicating, copying, or rebuilding it, with access managed through workspace permissions and row-level security (RLS) where appropriate.
Reusability
Dataflows are specifically designed to create transformation processes and tables that can be reused as many times as needed by different users and reports.
Reusability ensures that all analysts work with:
- The same definitions.
- The same columns.
- The same transformation logic.
- The same business rules.
This reduces typical errors such as misnamed columns, inconsistent filters, or transformation errors.
Synchronised Updates
In Power BI, particularly when working with dataflows, synchronised updates refer to the ability for prepared data to refresh consistently across multiple reports and semantic models that depend on the same source. In other words, when a dataflow is updated and the relevant refreshes have run, connected reports can work from the latest information.
This also helps to avoid discrepancies caused by independent refreshes.
Without synchronisation, organisations may face issues such as:
- Reports showing different data depending on when they were refreshed.
- Misinterpretation due to outdated information.
- Duplicated effort to refresh multiple sources manually.
- Inefficient decision-making based on inconsistent data.
Synchronised updates solve these issues by ensuring a single, up-to-date source of truth for all consumers.
An additional advantage is that dataflows are compatible with Power Automate and Power Apps, enabling smooth integration with the Microsoft Power Platform.
This enables:
- The automation of data-related processes.
- The creation of interactive applications that consume data directly from dataflows.
- The connection of workflows and triggers to centralised information.
In short, the same prepared data can support analysis, visualisation, application development, and automation across the Microsoft ecosystem. For example, a dataflow can support a Power Automate process that sends an email alert to designated recipients when a KPI falls below a certain threshold.
Cloud Execution
In a Power BI dataflow context, cloud execution means that ETL processes take place on Microsoft’s cloud servers, instead of locally on your computer or an on-premises server. Traditionally, Power BI Desktop handled all data preparation locally, but this can be problematic when:
- Datasets are very large.
- Multiple users need access to the same dataflow.
- Data needs to be continuously updated.
- The BI team needs to collaborate.
Cloud execution ensures that:
- Transformations do not consume local machine resources.
- Data is processed centrally and at scale.
- Reports and dashboards can consume pre-processed data, thus improving overall performance.
This addresses these challenges by centralising and scaling workloads efficiently, enabling faster and more reliable reporting.
Note: Not all dataflows are cloud-only, but Gen2 dataflows are entirely cloud-based.
Dataflow Gen1 vs Dataflow Gen2
Before we start looking at how to create a dataflow, let’s take a moment to explain the difference between Gen1 and Gen2 dataflows.
The differences are mainly in terms of performance, architecture, monitoring, and Fabric integration. Gen2 dataflows have a more optimised and modern cloud architecture, which allows them to handle large volumes of data faster and more efficiently. They also offer better monitoring than Gen1, providing clearer metrics for refreshes, usage, and errors.
Note: To create a Gen2 dataflow, the workspace needs to be backed by Fabric capacity, Fabric trial capacity, or Power BI Premium capacity.
How to Create a Dataflow
We can create a dataflow in six simple steps and, for those familiar with Power BI, the process is fairly intuitive.
Step 1: Create the dataflow
To begin with, we go to the workspace in the Power BI service where we want to create the dataflow:
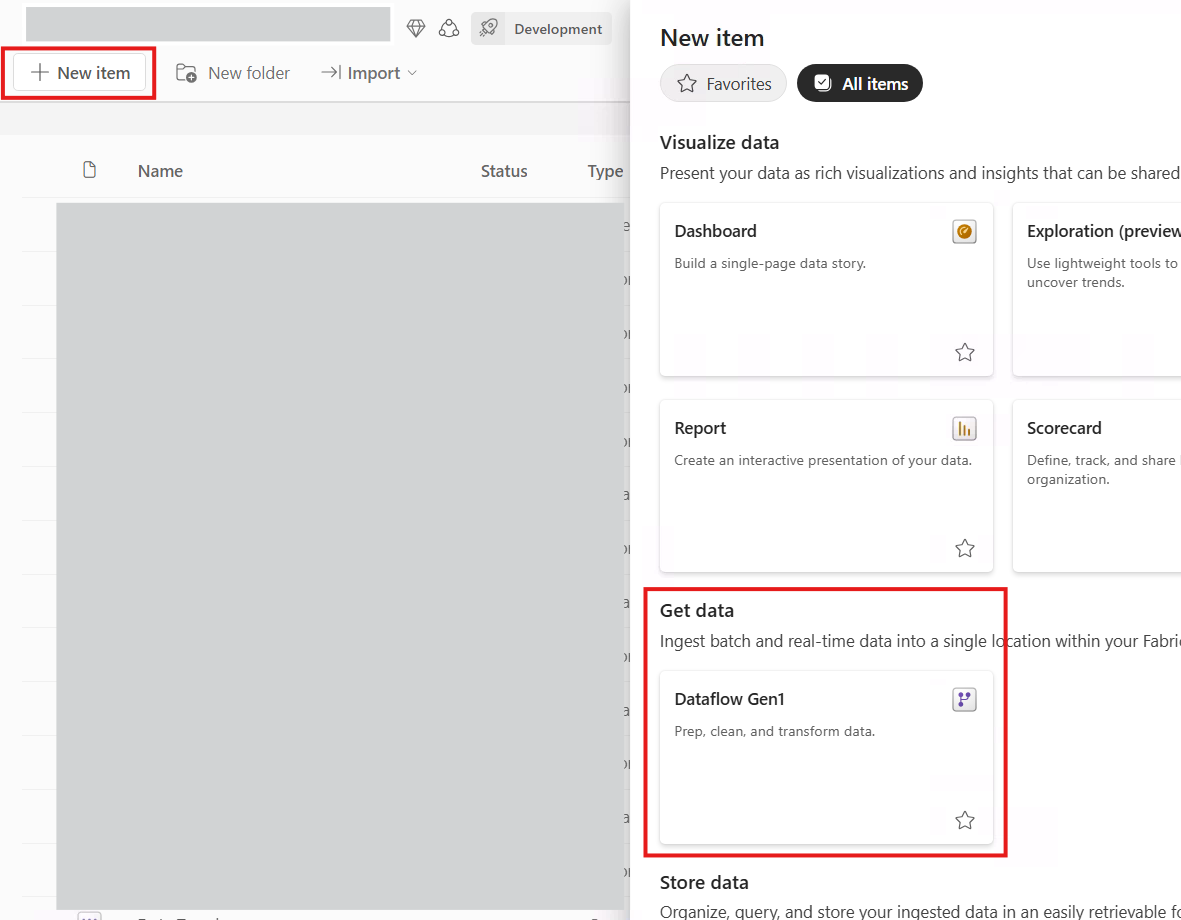
Figure 1: Dataflow creation
Step 2: Select your dataflow type
Next, we need to select the type of dataflow we want from four options:
- Define new tables: Create a dataflow from scratch, connect to the original sources, and apply the required transformations.
- Link tables from other dataflows: Link to a table created in another dataflow, creating a reference to an existing table.
- Import Model: Import an existing Power BI semantic model to the dataflow, such as a report, a datamart, etc.
- Attach a Common Data Model (CDM) folder (preview): Connect to a folder that contains data in CDM format with a json file.
In our case we’ll select the Define new tables option, which is the most straightforward:
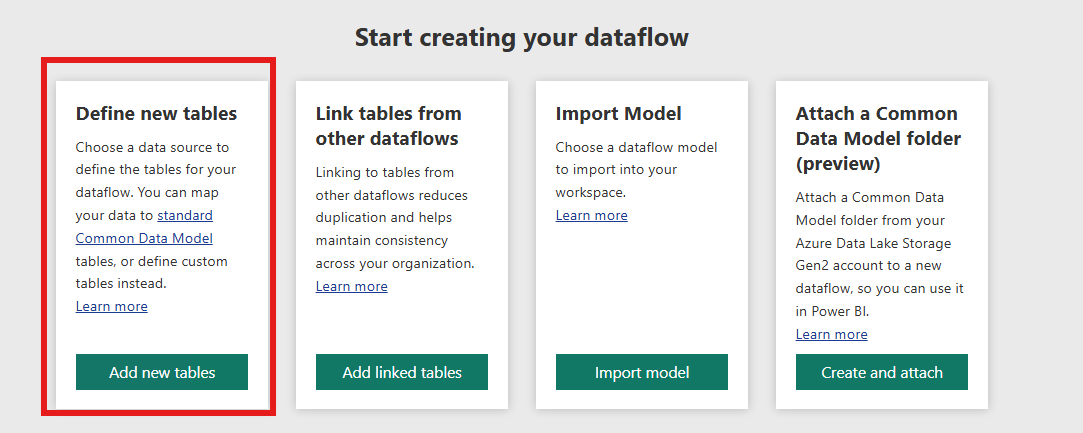
Figure 2: Dataflow types
Step 3: Define your source
After we’ve selected the first option, we need to define the source: an Excel file, a database table, a SharePoint file, etc.
For Power BI users, this is straightforward as it’s similar to the Get data experience in Power BI Desktop:
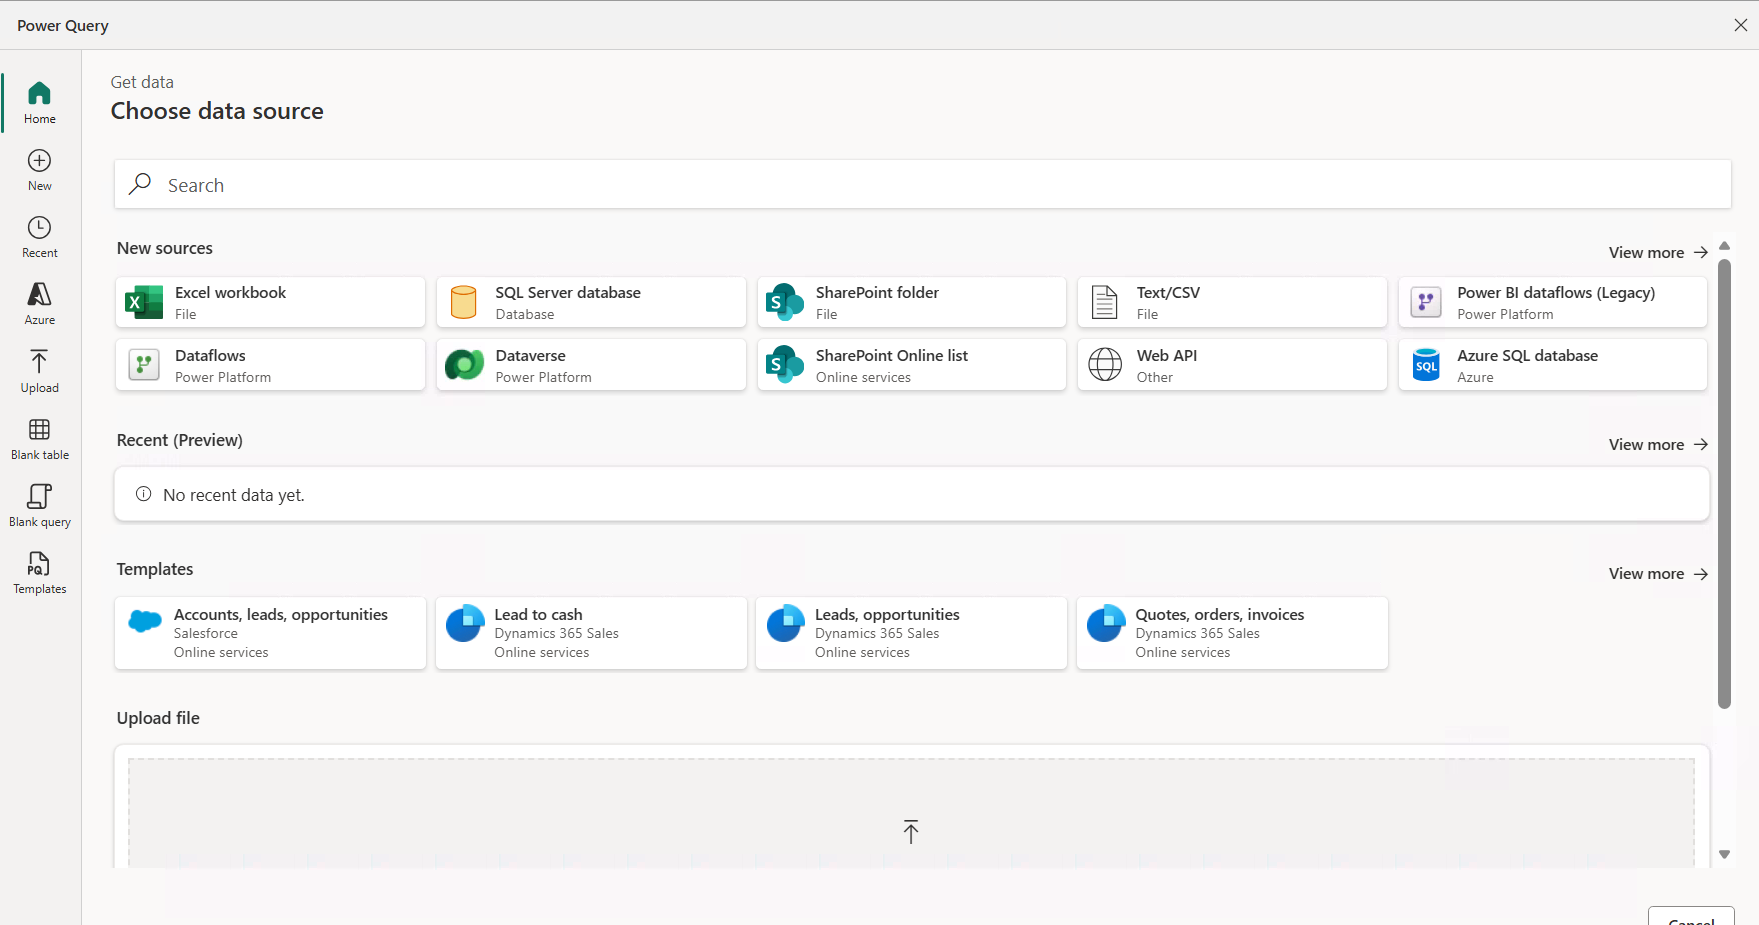
Figure 3: Select your source
Step 4: Inside the dataflow
Once we’ve connected to the source and loaded the data, it’s time to configure it. The authoring interface is not very different from Power Query in Power BI Desktop. It offers the same features, such as renaming columns, changing types, combining queries, creating custom columns, etc.:
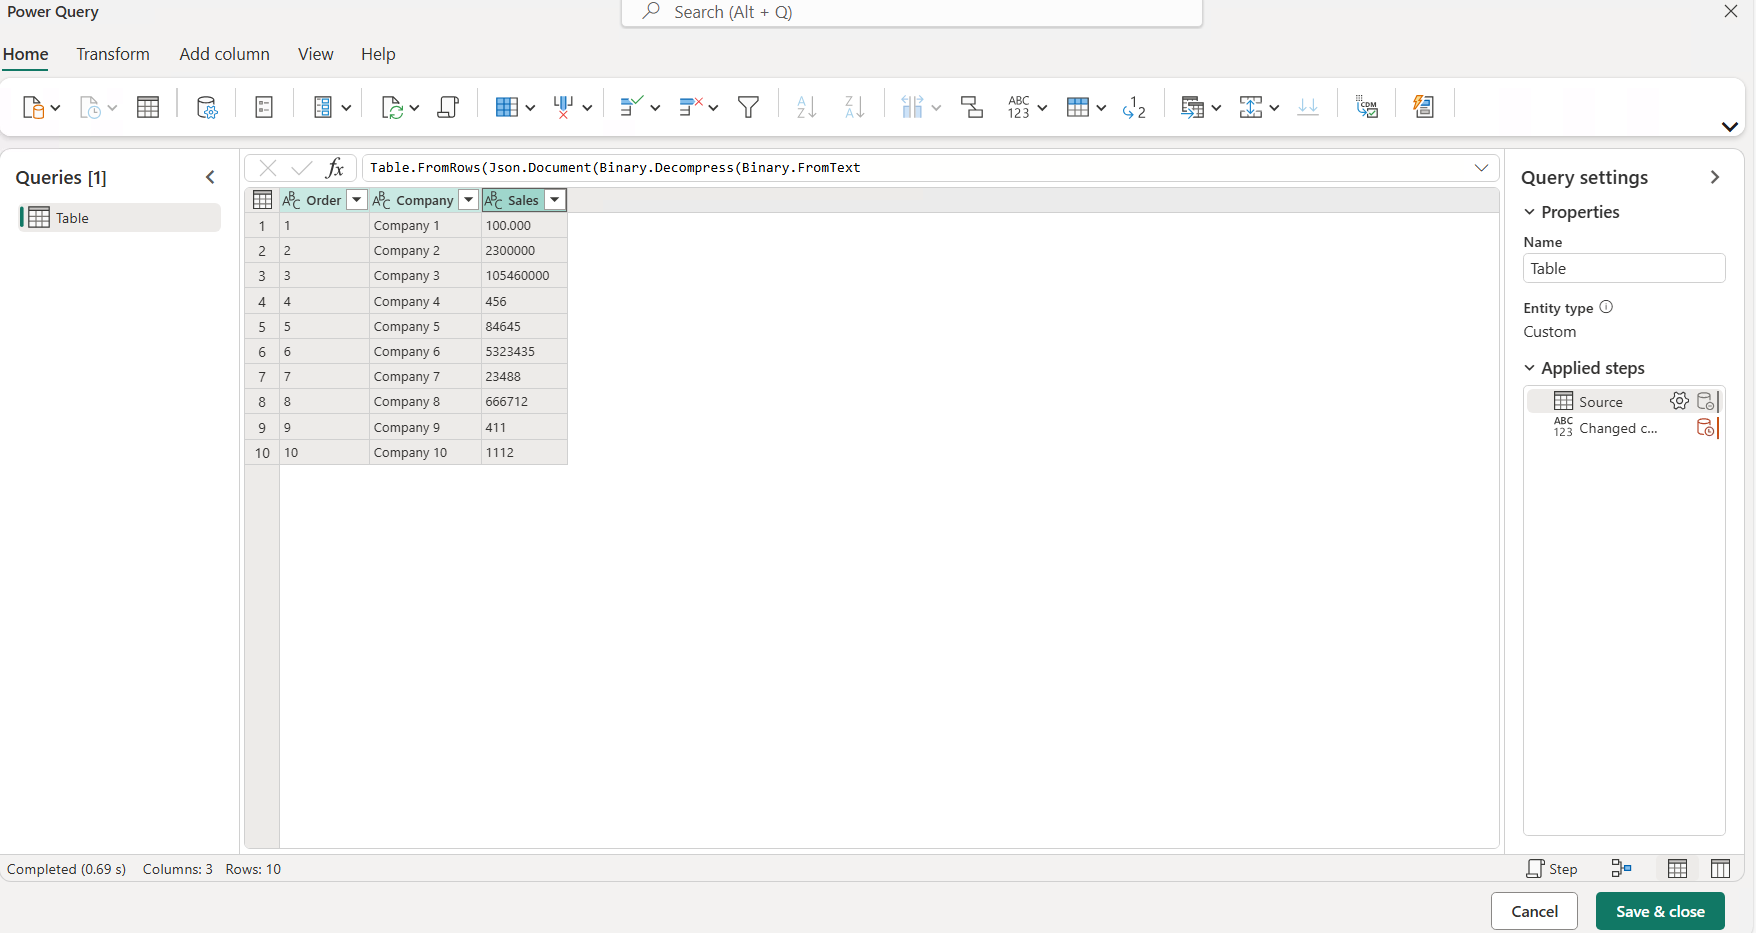
Figure 4: Dataflow settings
Step 5: Finalising the dataflow
Now that we’ve configured our dataflow and, if applicable, performed the transformations, we go to the Save & close option at the bottom right.
One useful dataflow feature is Incremental Refresh, which allows the model to update only new or changed data within a defined date range, helping to avoid unnecessary updates of old rows in very large datasets.
Gen2 dataflows work a bit differently: they are based on partitions and filter ranges, which can significantly improve performance.
This can be configured by clicking on the Incremental Refresh button:

Figure 5: Incremental Refresh
Step 6: Connect
The final step is to connect to the dataflow. We open Power BI Desktop, and, under Get data > Dataflows, we’ll find the dataflow within the workspace where it was created. We connect to it, and it’s ready to use:
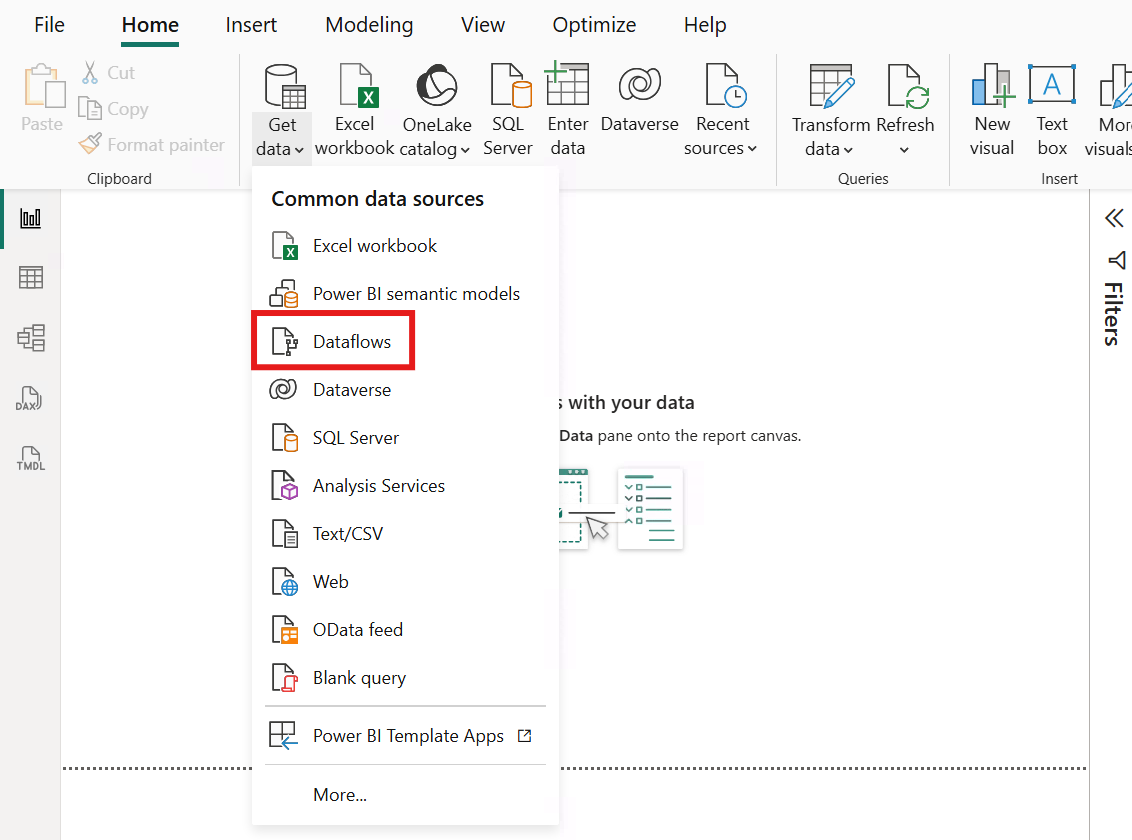
Figure 6: Connect to the dataflow
Business Scenario
Let’s look at a simple, familiar use case: imagine that we have four reports that use information from the Sales and Company tables. In the image below, we can see what the model would look like with the four reports connected locally to the Sales and Company tables (without using dataflows):
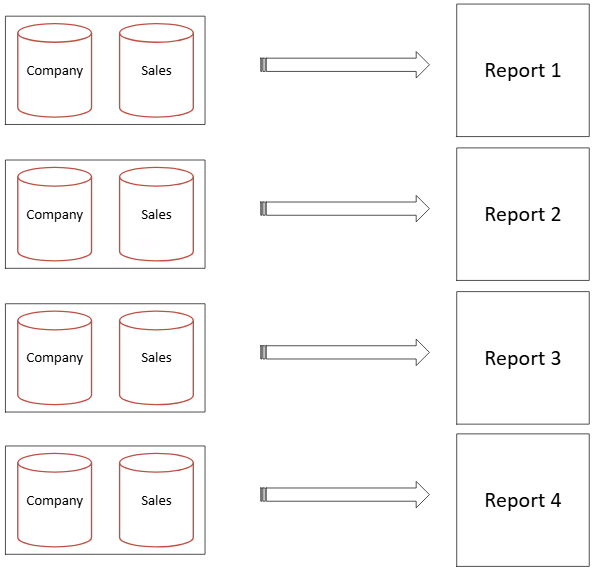
Figure 7: Scenario without dataflows
Now let’s look at this same data model but with dataflows. We can see a cleaner model and the four reports connected to the dataflow, using the same source:
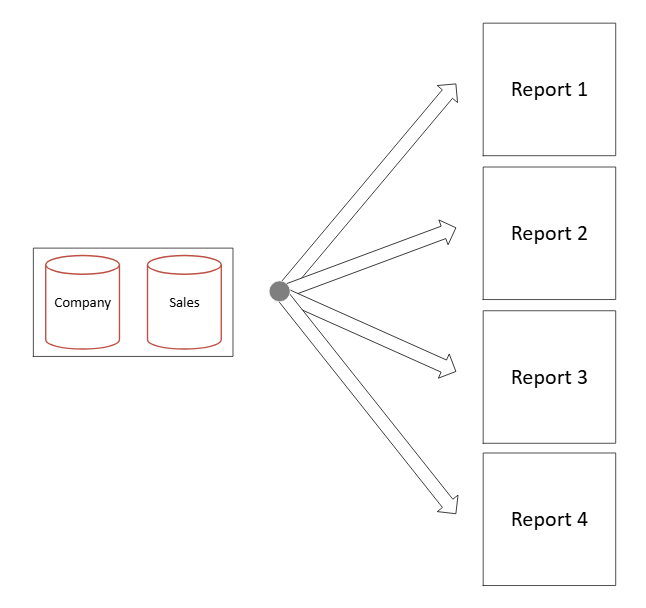
Figure 8: Scenario with dataflows
Conclusion
As we said at the beginning of this post: build your dataflow once and reuse it wherever it adds value! That might sound like a grand claim, but it’s not far from the truth. Dataflows are available across Power BI and Microsoft Fabric and, for scenarios where you simply want to create a reusable layer of prepared data and connect it to different reports, they are a very practical, straightforward option.
This ease of use is a real benefit. As tools become increasingly complex or require additional technologies to build an optimal data model, dataflows provide a practical option for teams that already know Power BI. If you need guidance, or want to understand how Power BI and Microsoft Fabric can support your organisation, get in touch with our team today!