
08 Mar 2018 Q&A in Power BI
With society demanding more natural interactions with computers and artificial intelligence, natural language processing (NLP) has quickly become one of the most important BI trends for 2018. With Apple’s Siri, Amazon’s Alexa, and Microsoft’s Cortana leading the advancement of NLPs, we are becoming increasingly exposed to the opportunities NLP systems provide.
Unsurprisingly, the business intelligence environment is the perfect place to implement NLP technologies. The enterprises of today need to not only glean insights into their business, they need to be able to interact with their data without having to depend on an SQL or visualization tool expert to do the legwork for them.
“By 2020, 50% of analytical queries will be generated via search, natural-language processing or voice, or will be automatically generated.” Source: Magic Quadrant for Analytics and business Intelligence Platforms (2018). Gartner, Inc. |
In this article, the natural language solution offered by Power BI will be tested. Questions and answers (Q&A) is an integrated feature in Power BI that empowers users to be able to ask questions and receive visualizations as a response.
It’s worthwhile first taking a look at how Q&A from Power BI works. Power BI reads the names of columns within the dataset currently in use; therefore, it is extremely important that you structure the dataset’s column names with functional meanings that are easily understand by users. In the end, users will be connecting directly to the dataset published, so take caution to avoid messy naming conventions that are available in some datasets.
For example, suppose you had an Excel table named “Sales”, with columns titled “Product”, “Month”, “Units Sold”, “Gross Sales”, and “Profit”. You could ask questions about any of those entities. You could ask “show sales, “total profit by month”, “sort products by units sold”, and more.
This Q&A feature is also available when you accede a published dashboard. In that case, you can confidently ask questions about the measures and dimensions displayed. For instance, in the dashboard below, it is possible to ask questions about the ‘Gross Margin %’ and the ‘Total Revenue’.
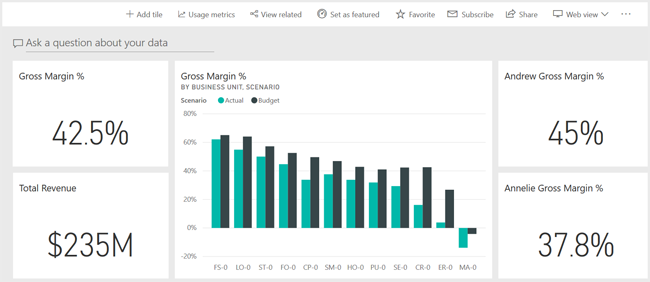
Figure 1: Ask a question to a dashboard.
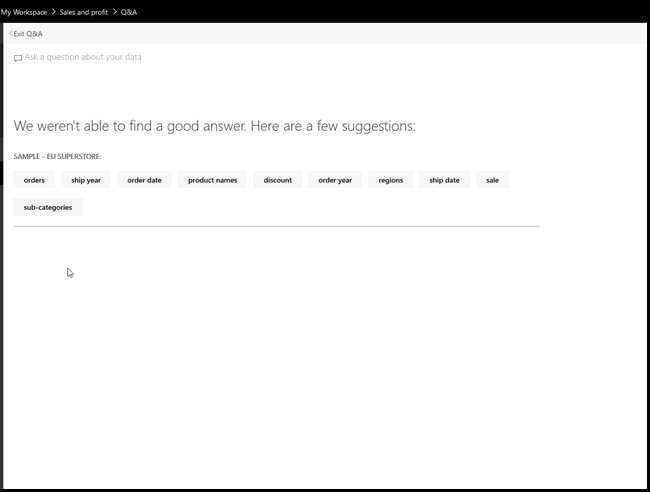
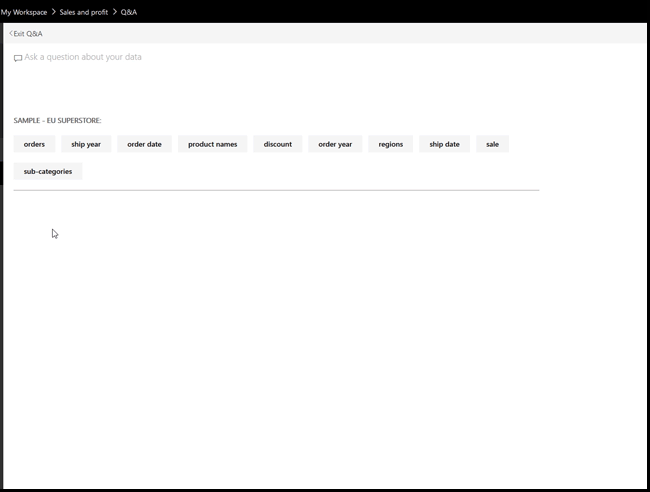
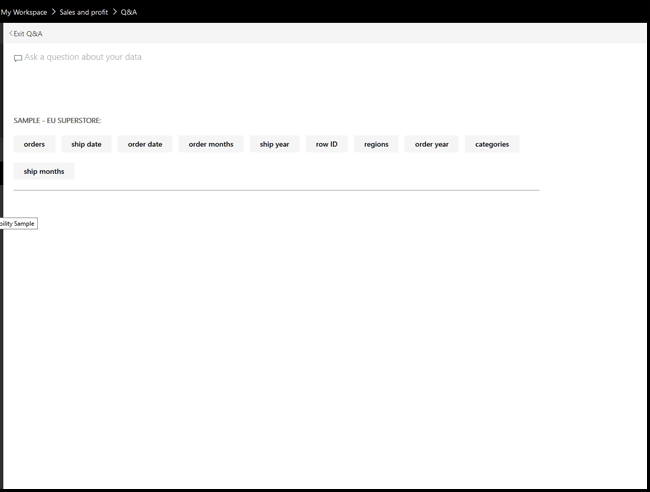
Also, when you click in the ‘Ask a question’ box, some options for the data available appears. This can help during situations where you are not familiar with the dataset that is providing the data.
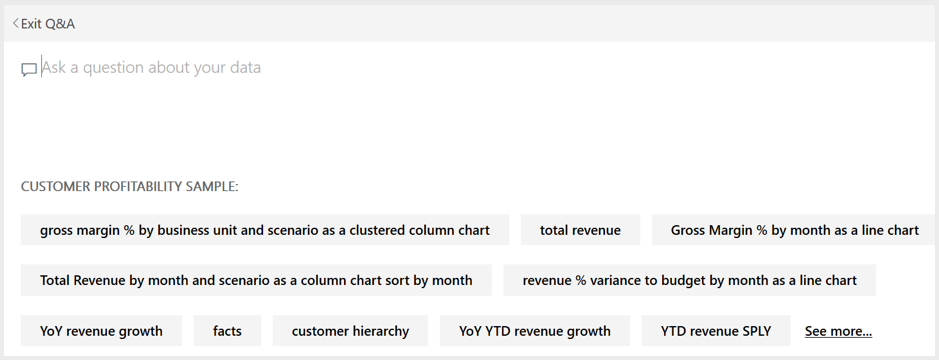
Figure 2: Suggested questions for dataset.
There is also a really helpful autocomplete function when asking a question. This autocomplete suggests measurement names, dimension names and dimension members.
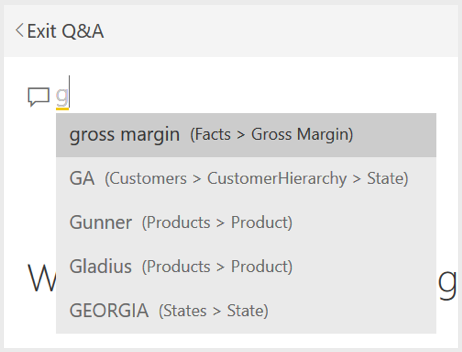
Figure 3: Autocomplete option when asking.
Furthermore, Power BI autogenerates visualizations to display the data. However, you can choose which visualization type answers your question in the best way. Power BI also gives you some suggestions when asking, but bear in mind that, depending on the data, not all visualizations are always available.
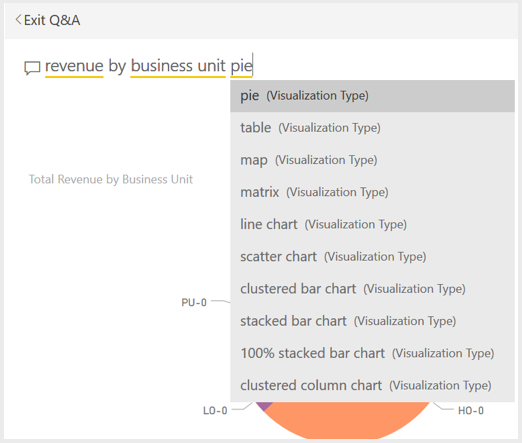
Figure 4: Autocomplete option for visualization types.
Results
The following videos shows how to use the Power BI Q&A functionality.
Video 1: Profit by city
Video 2: Sales by month lines
Video 3: Sales by product
Conclusion
NLP is gaining popularity in the business intelligence world, ensuring that more products and functionalities will appear covering this need in the near future. Power BI ‘Q&A’ is a useful feature that acts as one such solution. Other business intelligence technologies like Tableau are also investing in this subject, most notably with the recent announcement of their acquisition of ClearGraph, a company that enables smart data discovery and data analysis through NLP. Expect more BI technologies including this functionality in the following months.