05 Dic 2017 Tableau 10.4 new features: Linear geometry shapefiles
Tableau is constantly improving their application by adding new features, resolving issues and improving the user experience. We got some interesting features in previous version, 10.3. One of them was Data-Driven Alerts, which we wrote about in our latest Tableau blog article.
On September 25th , Tableau released their newest version, 10.4, which brought us new and interesting features, like easily-marked (certifying) datasets, real-time chat discussions, the ability to import linear geometry shapefiles and more. In this article, we will cover the linear geometry shapefiles feature in more detail.
1. Tableau 10.4 new features
Below are all the new features found in 10.4:
1.1. Install and Deploy Tableau
- Remove previous versions of Tableau Desktop during installation (Windows only)
- Downgrade and publish workbooks to an older version of Tableau Server
1.2. Connect to and Prepare Data
- Certified and recommended data sources
- New Denodo connector
- Other Databases (ODBC) connector on Mac
- Oracle connector supports SSL
- SAP GUI 7.4 support
- Create a SAP BW extract without a special license
1.3. Design Views and Analyse Data
- Precise dashboard spacing, with border and background colour controls
- High DPI support for Windows
- Support for linear geometries
- Map data updates and additions
- MATLAB integration
- WCAG-conformant drop-down filters in embedded views
1.4. New in Web Authoring
- Turn on the View Toolbar on the web
- Edit groups on the web
- Create aliases on the web
- Format lines
1.5. Share and Collaborate
- Enhanced commenting on Tableau Server and Tableau Online
- Learn who has seen a view on Tableau Server and Tableau Online
2. Linear geometry shapefiles
Tableau is supporting spatial files from Tableau 10.2. It supports Shapefiles, MapInfo tables, KML and GEOJSON files. Before, you had to spend lot of time to make these files readable in Tableau. Starting from version 10.2, this is possible with just a few clicks. Now in Tableau 10.4, we can also connect to spatial files that contains linear geometrics.
In this article, we will do a map visualization with a few tricks to expose most of the technical possibilities of linear geometrics in Tableau. This will be especially interesting for those cycling in Barcelona, who’ve likely experienced a time when they didn’t know the best route to their destination and were dismayed to find that Barcelona is not supported by Google Maps’ cycling layer. Luckily, visualising this in Tableau, with the new support of linear geometrics, is very easy.
Firstly, we will download data sources from the opendata-ajuntament.barcelona.cat:
- Bicycle lanes of the city of Barcelona – CARRIL_BICI
- Green route of the city of Barcelona – RONDA_VERDA
Important thing to mention here is that not all types of spatial files are supported, so you should check their type. The spatial files that are supported are files with a single layer and only the files with point geometrics or linear geometrics, or polygons are supported. Mixed geometry types and multilayer types are not supported and if you try to open them you will get one of the following errors:
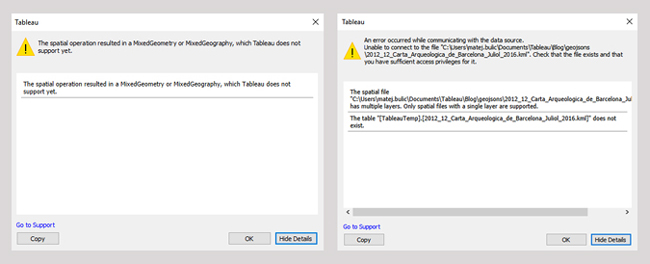
Figure 1: Loading spatial files errors
Once we have downloaded the files, we need to connect to them as a new data source.
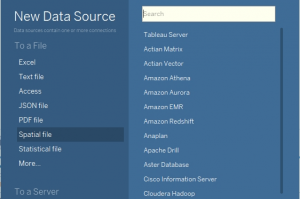
Figure 2: Load spatial file as data source
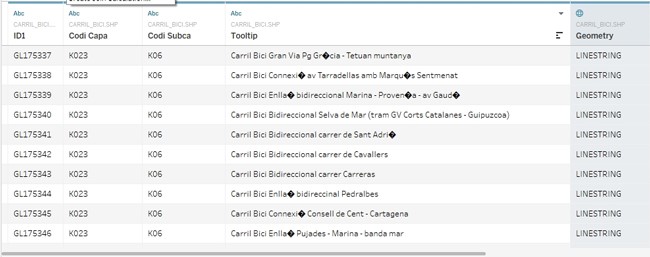
When Tableau loads the dataset, we can see a problem with displaying diacritics in Tooltip column. That happens because Tableau supports only UTF-8 encoded files.
To fix this issue we need to save spatial files as UTF8. In this case we are using QGIS – open source desktop GIS program. We will just open the file with Latin1 encoding and save it as UTF8.
Figure 3: Saving spatial file as UTF8 in QGIS
Loading the newly saved file, we can see that diacritics are now properly displayed.
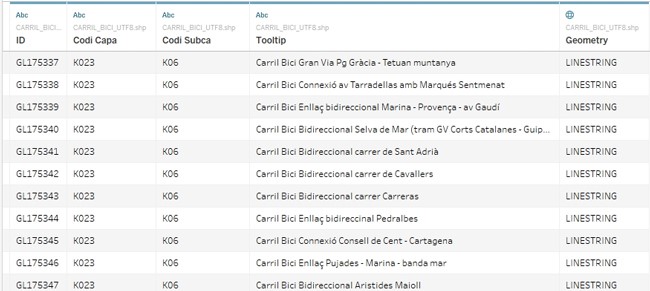
Figure 4: Spatial file encoded in UTF8
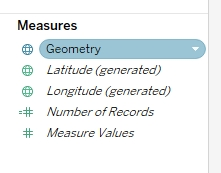
Now we can create the new sheet and on it we can see new Geometry field and generated Longitude and Latitude fields.
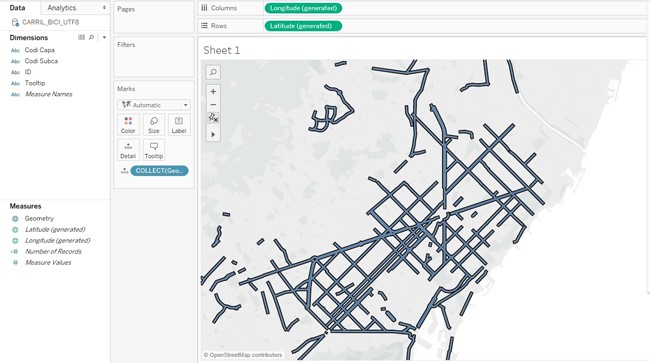
After we have done this loading of the map visualization it’s really simple, we just have to double click the Geometry field and we get Barcelona map with all the bicycle roads in the city!
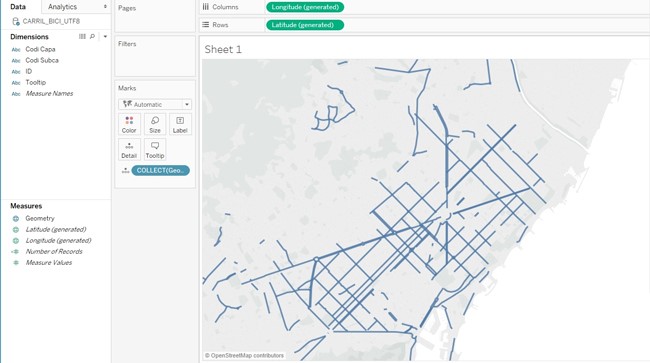
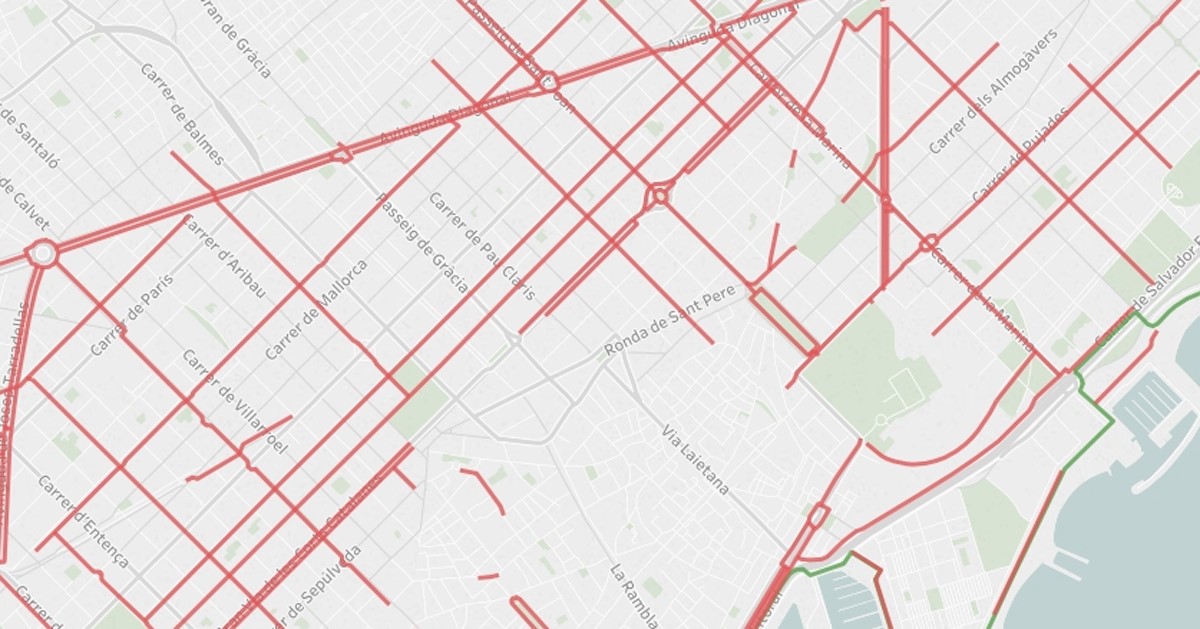
Figure 5: Bicycle roads in Barcelona
If you hover one of the roads, you will see that it will select all the roads. This is because all the lines that are loaded with Geometry field are aggregated to one.
You can disaggregate them or add more levels of details to the view.
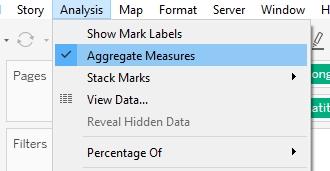
Figure 6: Aggregate Measures
Let’s disaggregate the lines and add tooltip to see the name of the roads on hover.
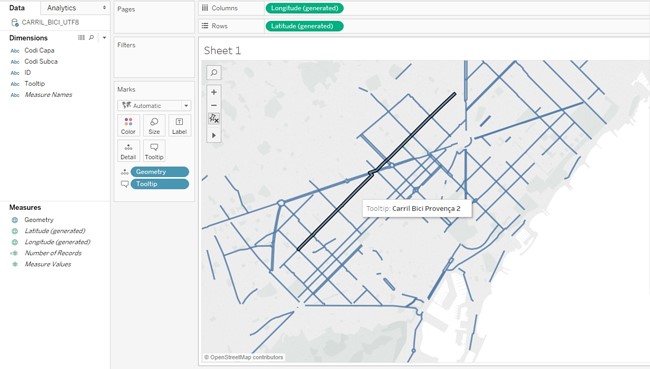
Figure 7: Disaggregated measures
Now we will join another spatial data on top of this visualization. We will join additional spatial file with a green bicycle road around the city.
Firstly, we want to load all the roads of this green road while still keeping all the roads we have loaded before. That’s why we will make union join of data with our previous dataset.
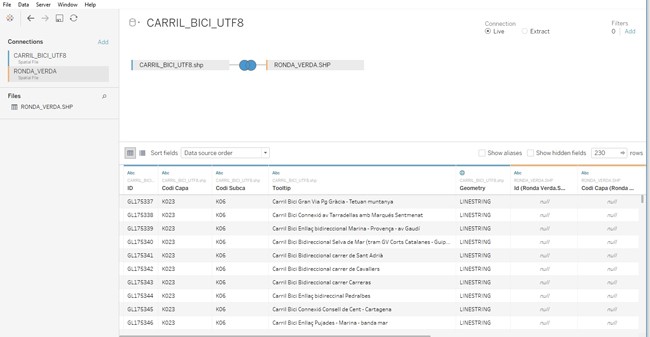
Figure 8: Union join in Tableau
You’ll find in the fields of the analysis that another shape file have been loaded and it’s having new Geometry filed. Please notice that we don’t have new latitude and longitude, this will be merged with our previous generated one.
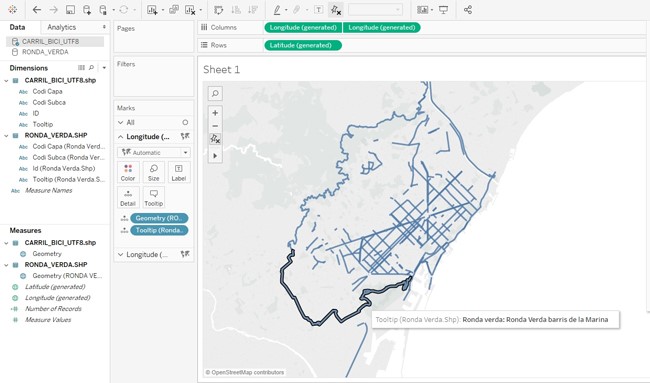
Figure 9: Two shapefiles loaded in Tableau
Let’s change the colour of roads, so we can easily distinguish them.
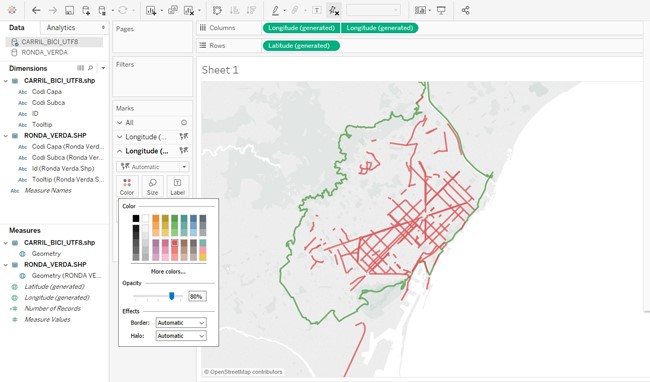
Figure 10: Colouring the marks
To finish we can just format the map background and we are done! We have visualization loaded from spatial files with linear geometry!
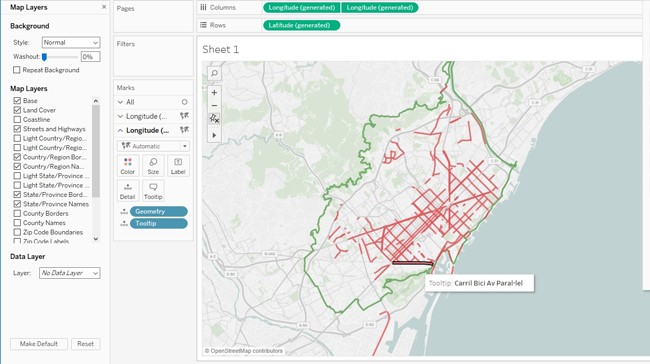
Figure 11: Changing map layer in Tableau
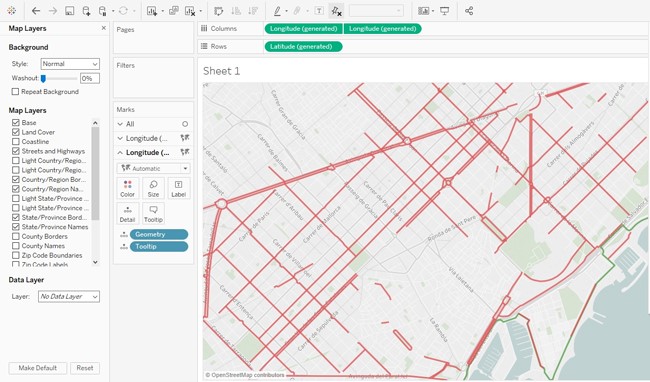
Figure 12: Bicycle roads in the center of Barcelona
Conclusion
Recognition of geographic data is one of the most important features in today’s visualization tools. That’s why it’s a great feature to have a support of linear geometry in Tableau, so we can easily apply more kinds of layers on our maps. There is still some features of spatial files (like multilayers and mixed types of geometry shapes) which Tableau still doesn’t support, but I believe the support for this will come in the future releases.
If you want to know in more details this new release you can check the explanation Tableau gives here.
At ClearPeaks we are experts in Tableau, always updated with the latest features and working on enhanced visualizations. If you need more information about Tableau or about how can we help you don’t doubt to contact us.