17 Ene 2018 Tableau 10.5 new features: Viz on Tooltip
Tableau has recently launched Tableau 10.5, a version that not only tackles some of the known issues but comes with new features and functionalities. In this article, we’re highlighting some of the most interesting ones:
- With the feature Viz in Tooltip, Tableau has delivered on its promise of hosting rich visualizations – of your own design – in tooltips. This allows the user to view more details on demand within the context of the original view.
- A second feature we would like to draw special attention to is Hyper – the new in-memory data engine technology designed for fast data ingest and analytical query processing on large or complex data sets.
- Lastly, we’d like to emphasize that Tableau Server is now available for Linux OS. This expands the possibilities of system architecture maintaining the Windows version features.
In this blog post we first give a general overview of this new release by listing all the new features.
Secondly – we´re diving into one of the features, “Viz in Tooltip”, and presenting you with a simple trick to overcome some of the customization limitations this feature still has.
1. Tableau 10.5 new features
Below are all the new features found in 10.5:
1.1. Install and Deploy Tableau
- Activate Tableau Desktop from the command line
- Turn off driver downloads from the command line (Windows)
- Tableau Desktop run only on 64-bit operating system
1.2. Connect to and Prepare Data
- Extracts use the new .hyper format
- Google authentication method update
- Use the new Box connector to connect to Box data
- Support for SSL authentication to IBM DB2 and BigInsights databases
- SAP HANA support for failover
- Support for OData V4
1.3. Design Views and Analyse Data
- Power trend lines
- Map data updates and additions cities are available for South East Asia, Central America, and South America
- Extend dashboard dimensions to 10K pixels
1.4. Publish Data Sources and Workbooks
- Downgrade workbooks in Tableau Desktop
- New in Web Authoring
1.5. Collaborate with Tableau Online and Tableau Server
- Upload custom images for user profiles
- Subscribe users in groups, and add custom messages
- Rename workbooks on Tableau Online or Tableau Server
2. Viz in Tooltip
In previous versions of Tableau, you were already able to add a Tooltip to the existing bookmarks or graphics. However, this functionality was quite limited – only displaying text in the pop-up window rather than displaying richer content.
In this new version you can now present full report visualizations in the tooltip. It allows you to display much more information and interact with other reports easily.
Let´s give an example of Viz In Tooltip and show you a simple trick to show more than one tooltip with different visualizations in one report.
2.1. Project preparation
For this example, we created a new project using the «Sample Superstore» data provided by Tableau.
After establishing the connection, we create three worksheets in order to show the different possibilities for this new feature.
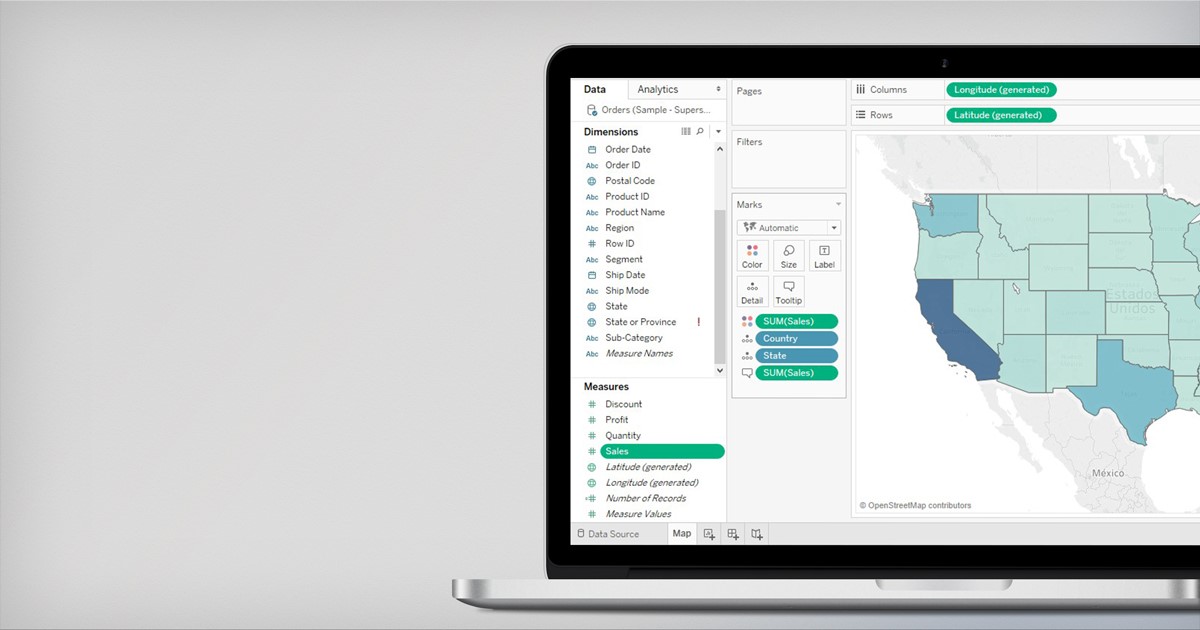
In the first worksheet, we create a map that represents the sales activities in each state using different colours.
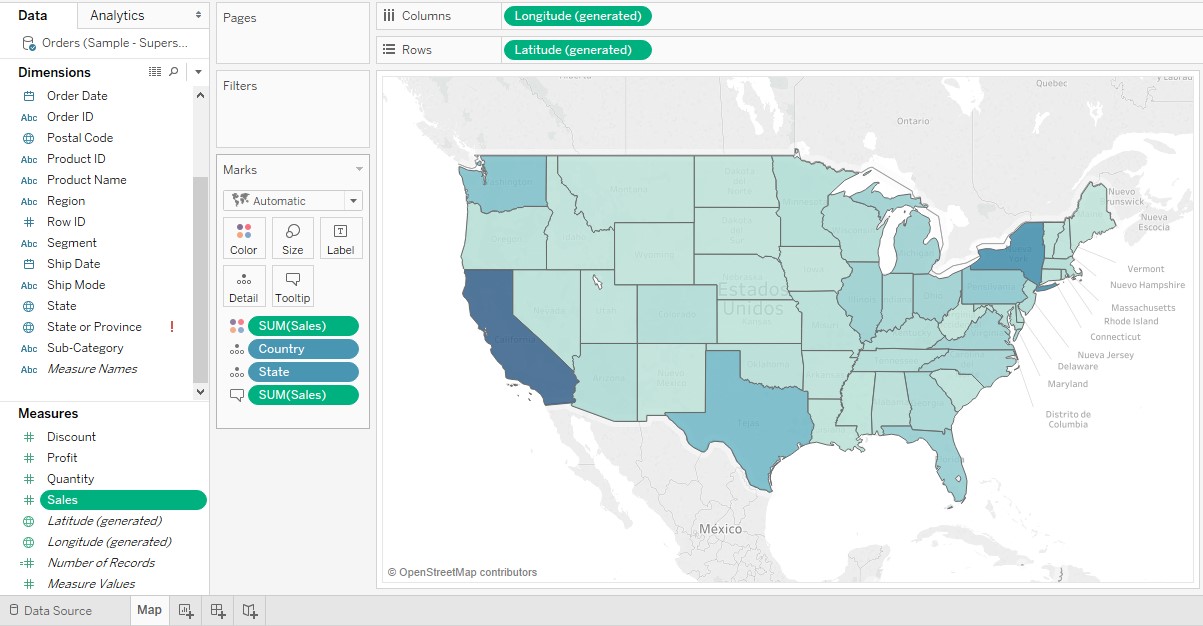
Figure 1: Map of the sales
The second worksheet represents the monthly evolution from sales filtered by the last two years.
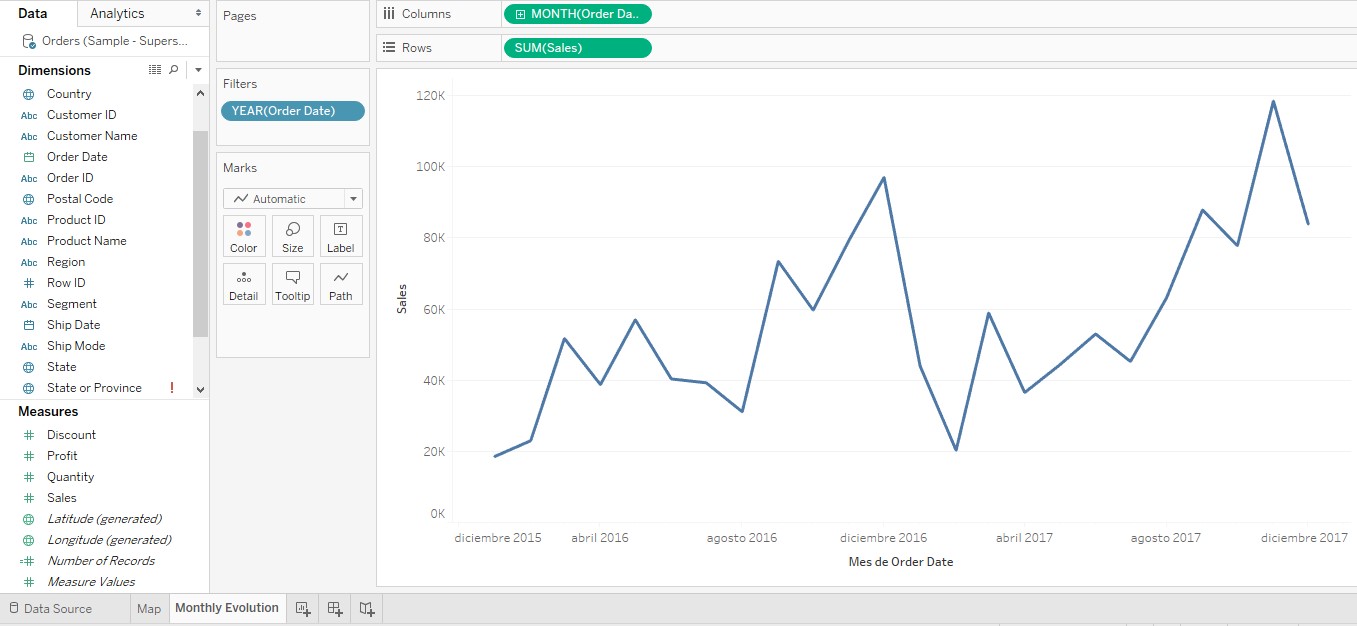
Figure 2: Monthly sales
And the third worksheet displays the sales summarized by category.
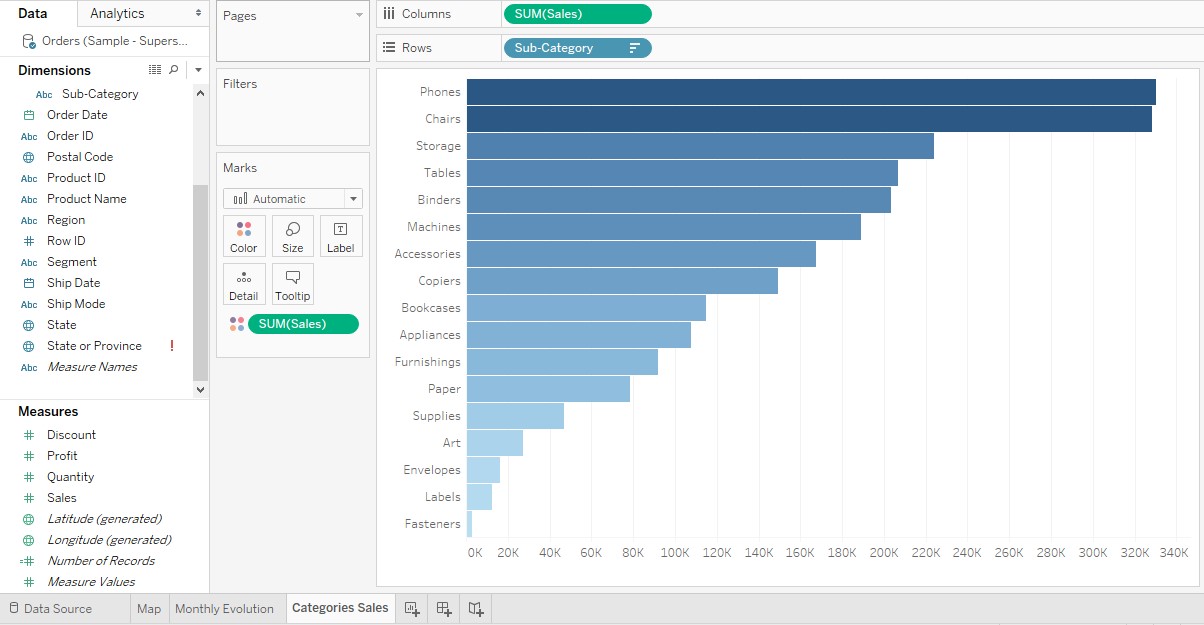
Figure 3: Main report with the sales by category
2.2. Viz in Tooltip Implementation
Once these 3 worksheets have been created, it is extremely easy to assign reports in any tooltip.
When you edit the tooltip section for the last report, you click the Insert button and select the Sheets option. You can then select which reports you want to visualise in your tooltip.
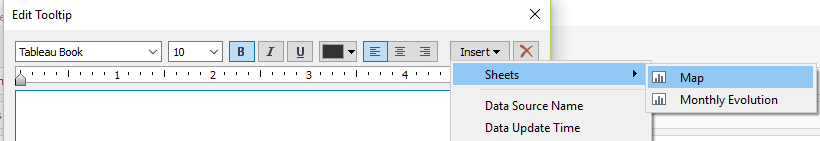
Figure 4: Editing the tooltip
Tableau will automatically generate the following code:
<Sheet name=»Map» maxwidth=»250″ maxheight=»250″ filter=»<All Fields>»>
You can manually change the size of the report or the fields that you want to filter (you will see “All fields” by default).
In this case we’ll insert two reports into one tooltip:
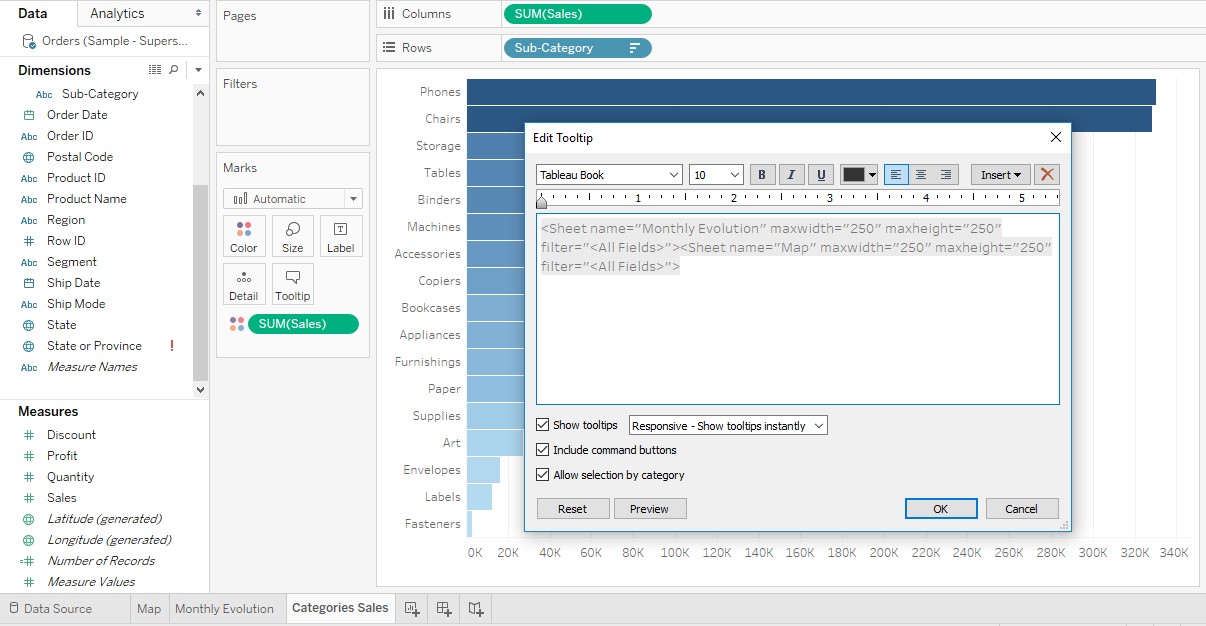
Figure 5: Editing the tooltip
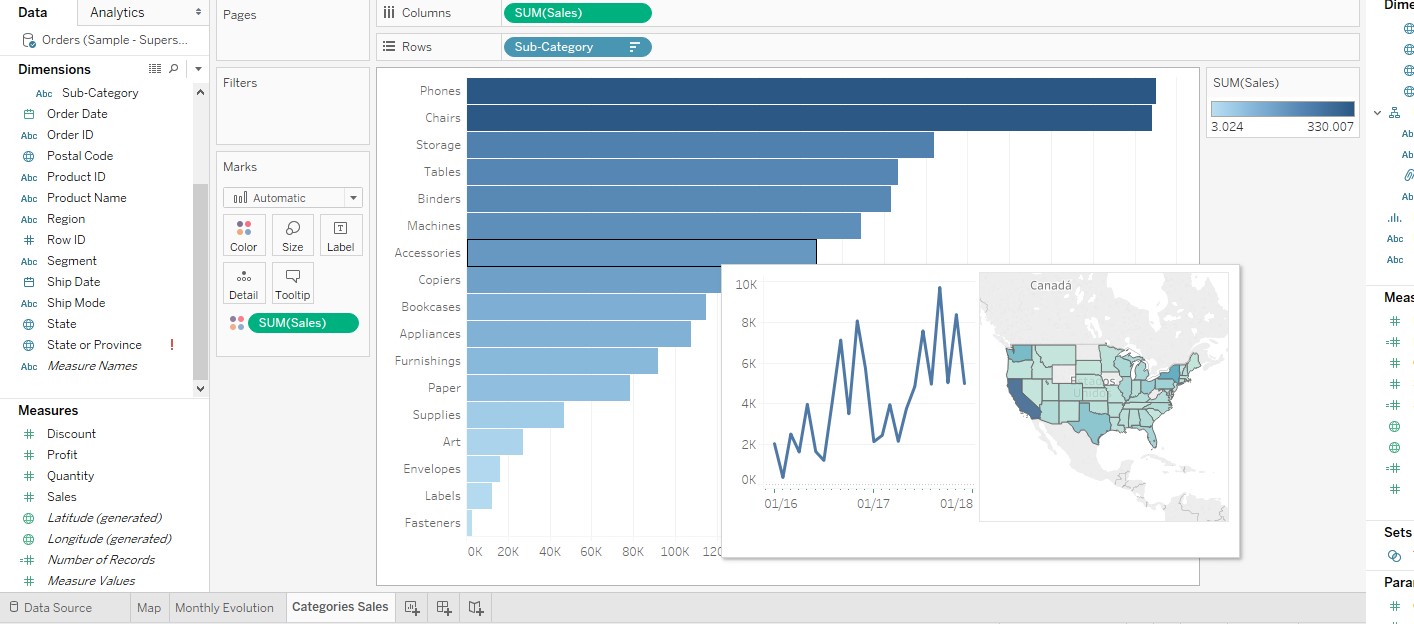
Figure 6: Tooltip with 2 Viz in horizontal
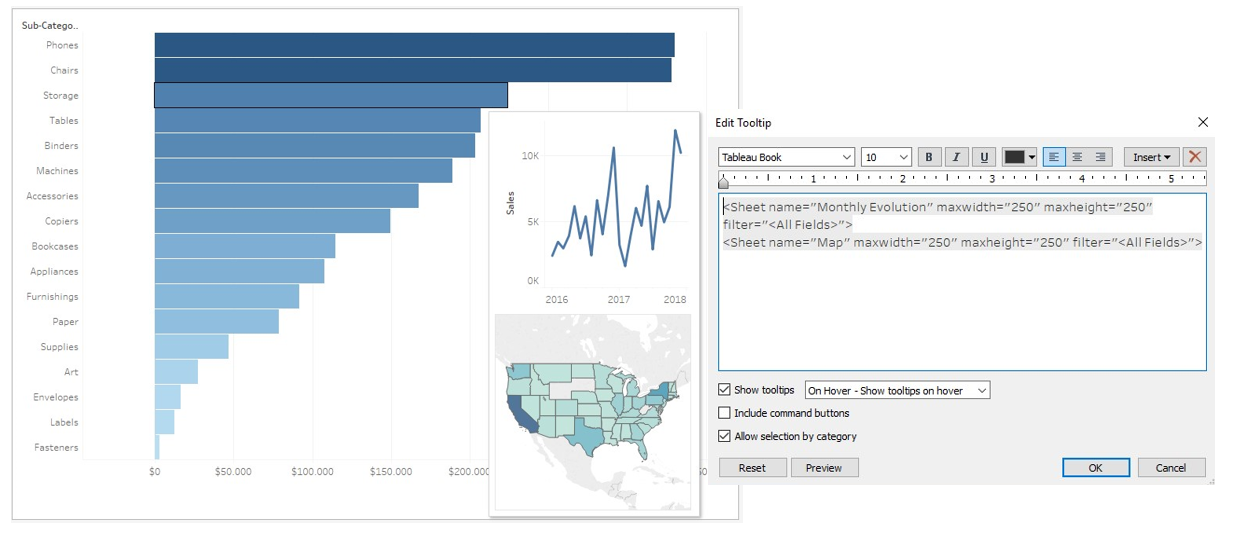
Figure 7: Tooltip with 2 Viz in vertical
2.3. Icon for your tooltip
As you might have noticed however, you cannot easily show two tooltips that display different visualizations. If you want to show 2 visualizations, they will be shown in the same tooltip per default.
Figure 8: Tooltip with 2 Viz in horizontal
The following trick will show you an option to enable two tooltips with two different report visualizations as per the example below:
Figure 9: Main report using 2 Viz in different tooltips
This can be done by adding a double axis to the report and then using one of them to define another shape – in our case a globe.
First you need to create a calculation measure that allows the shape not to overlap with the bar:
> Total of bar value + space interval to set the shape (the offset is a variable parameter that assigns the space desired distance):
INT(sum(Sales)+(TOTAL(sum([Sales]))*[Offset])

Figure 10: Creating double axis
Once you have created the double axis in the columns with «Sales» and «Sales Offset», you must convert the second measure to shape.
Finally, you can assign two tooltips with a specific report visualization for each of the measures using Viz In Tooltip.
- Measure Sales > Bar >> Tooltip with monthly evolution (Cfr. Report 2)
- Measure Sales Offset > Shape (Globe icon) >> Tooltip with Map (Cfr. Report 1)
This allows you to organise the information you want to show in one report in a more efficient way!
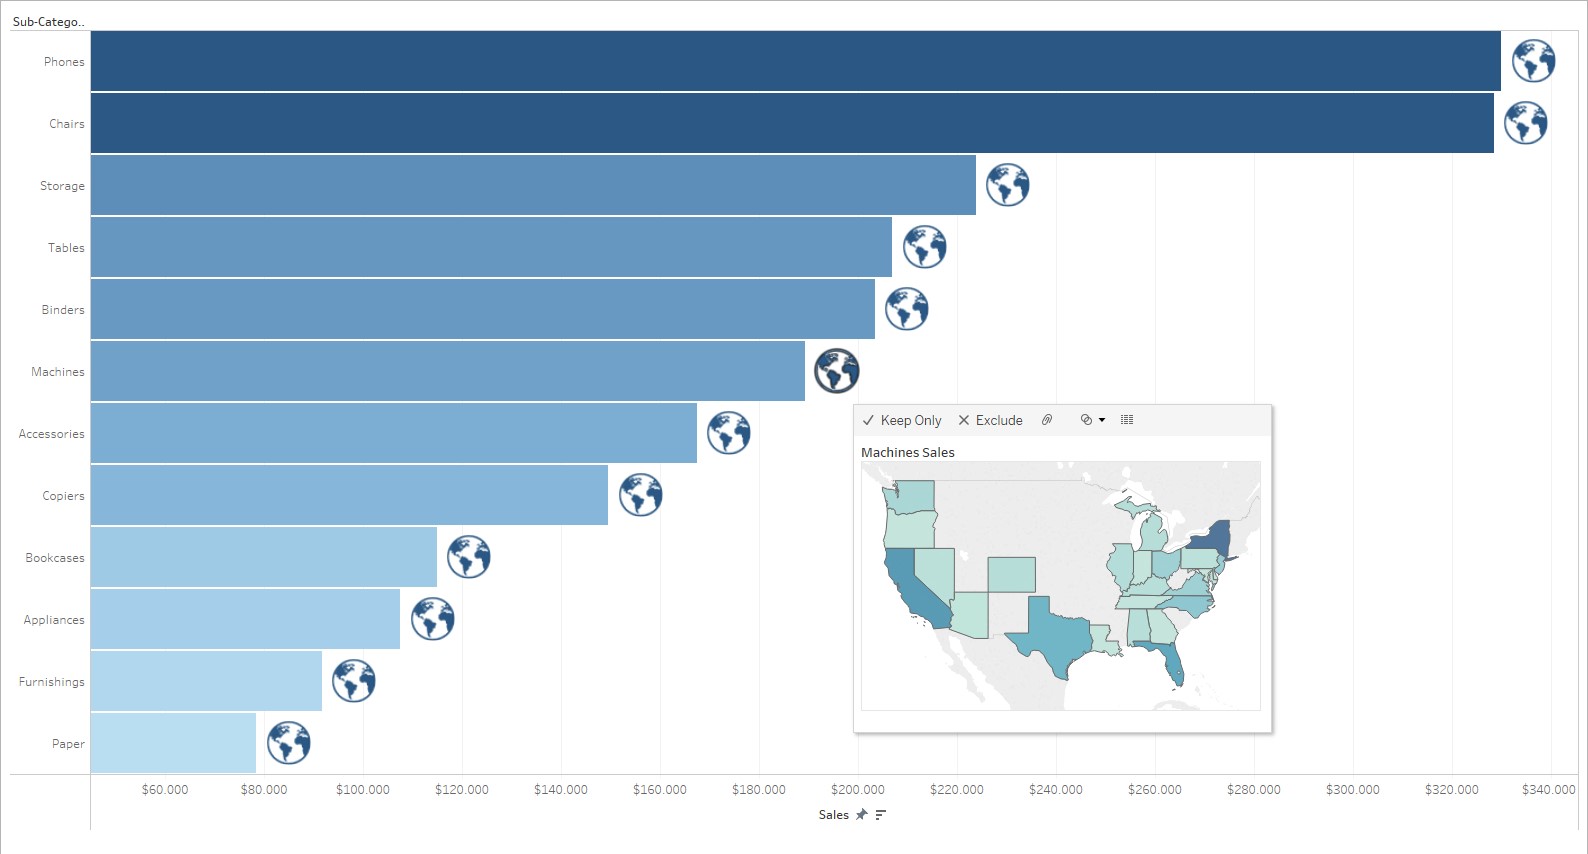
Figure 11: Tooltip of the shape showing the map
Conclusion
We are very exited about Tableau 10.5 and are looking forward to working with this version.
Don’t hesitate to contact us if you are looking to embark upon a Tableau project and need some help.
We are more then happy to get you started, offer support or training, or assist you in the development of your project!