13 Feb 2019 Tableau 2019.1: Ask Data
Last 13th of February Tableau 2019.1 was released, offering a lot of interesting features, but today we are focusing on the most anticipated – Ask Data.
Nowadays NLP is a key piece in technology; at a time when virtual assistants are becoming more and more popular (think Siri, Alexa, Google Assistant or Cortana), the use of natural language to interact with our technologies is becoming essential in our daily lives.
“Our customers want to enable more people than ever to use analytics within their organizations, and they are looking for more intuitive and natural ways to interact with data.” That is what Tableau’s chief product officer, Francois Ajenstat, said during the keynote address at the Tableau Conference 2018. In fact, the business intelligence environment is the perfect place to implement NLP technologies, so that enterprises don’t need data analysis experts to analyse their data.
Bearing all this in mind, Ask Data has arrived at the perfect moment, giving us an easy way to ask questions about our data. As Tableau experts say, “data can be heard”! In this article we are going to test this new feature, but first let’s take a look at some other novelties in the new version.
1. Tableau 2019.1 new features
Below we can see the new features found in Tableau 2019.1.
1.1 Install and Deploy Tableau
- Device layout preview on the web.
- Okta Integration improvements.
- Tableau Online Admin Insights.
- Device layout preview on the web.
- Automatic dashboard phone layouts.
- Export to PowerPoint.
1.2. Connect to and Prepare Data
- OAuth enabled for Snowflake Connector.
- Google Ads Connector.
- Microsoft Azure SQL Data Warehouse Connector.
- Tableau Prep Conductor.
- Secure RServe connections.
- Connect to Dropbox, OneDrive and Google Drive on the web.
- Connect to GBQ in the browser.
- Mixed content types.
1.3. Design Views and Analyse Data
- Ask Data
- Url action improvements.
- Nested sorting improvements.
- Dashboard zone names.
- Vector Maps
1.4. Mobile
- Automatic dashboard phone layouts.
- Device layout preview on the web.
- Tableau Mobile for Workspace ONE.
- Redesigned Tableau Mobile App.
2. Ask Data
With Ask Data we can query a published data source using plain language. Just by typing a question, Ask Data will produce a visualization to meet our needs; it is available in both Tableau Server and Tableau Online.
NLP is not the only top technology added to Tableau by Ask Data: it also includes machine learning components, working when Ask Data decides which is the proper visualization to display.
Let’s look at some of its features:
2.1. Visualize as you type
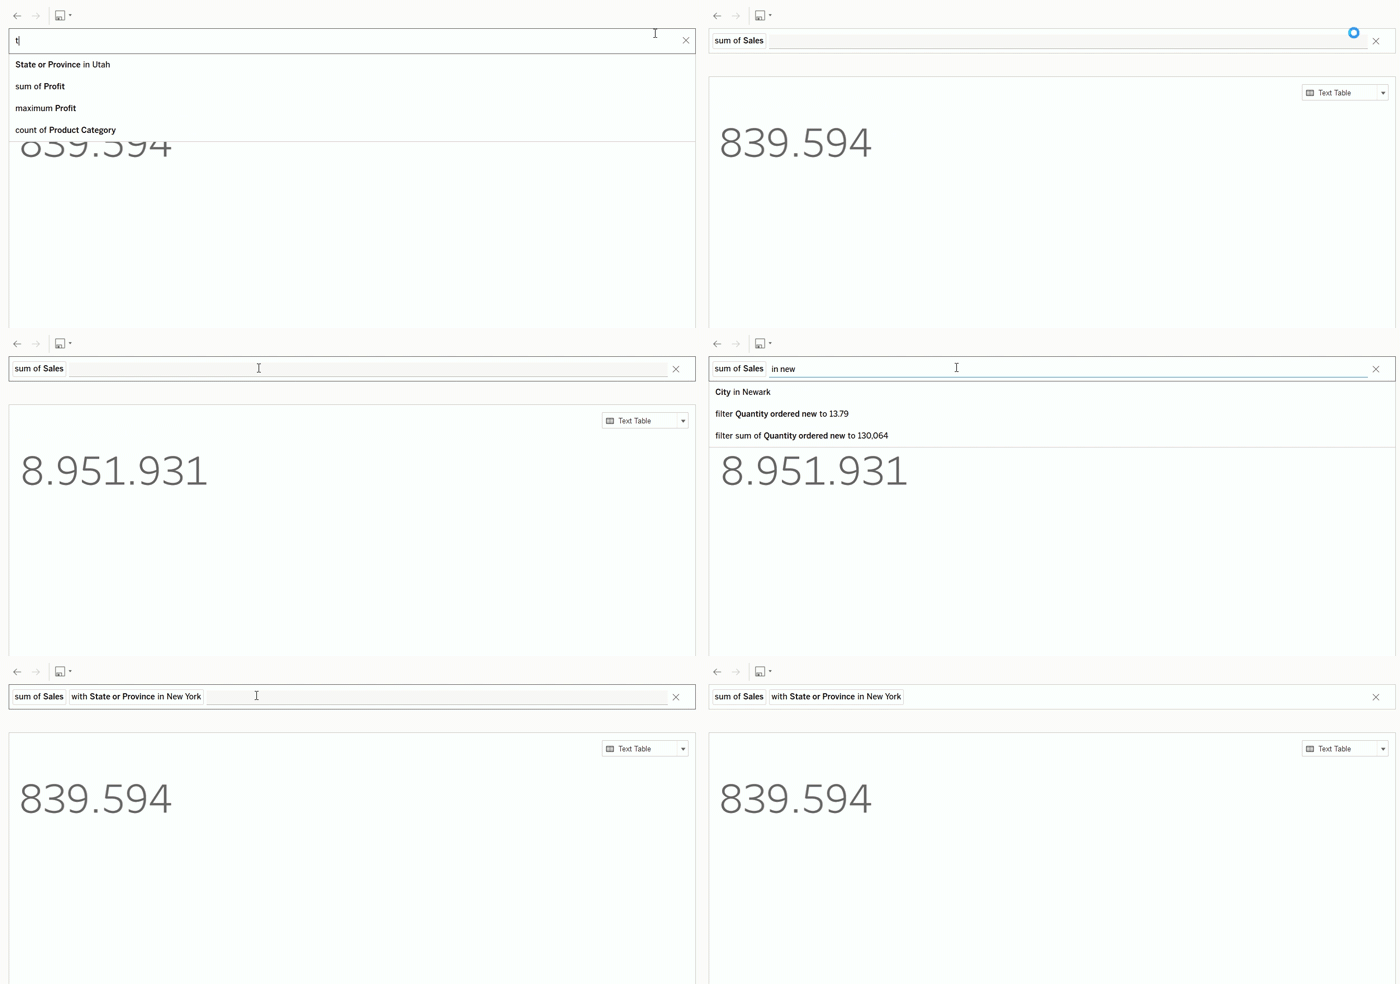
We can make a query using natural language. Ask Data will recognize the keywords and provide the wanted visualization.
2.2. Aggregations, grouping and sorting
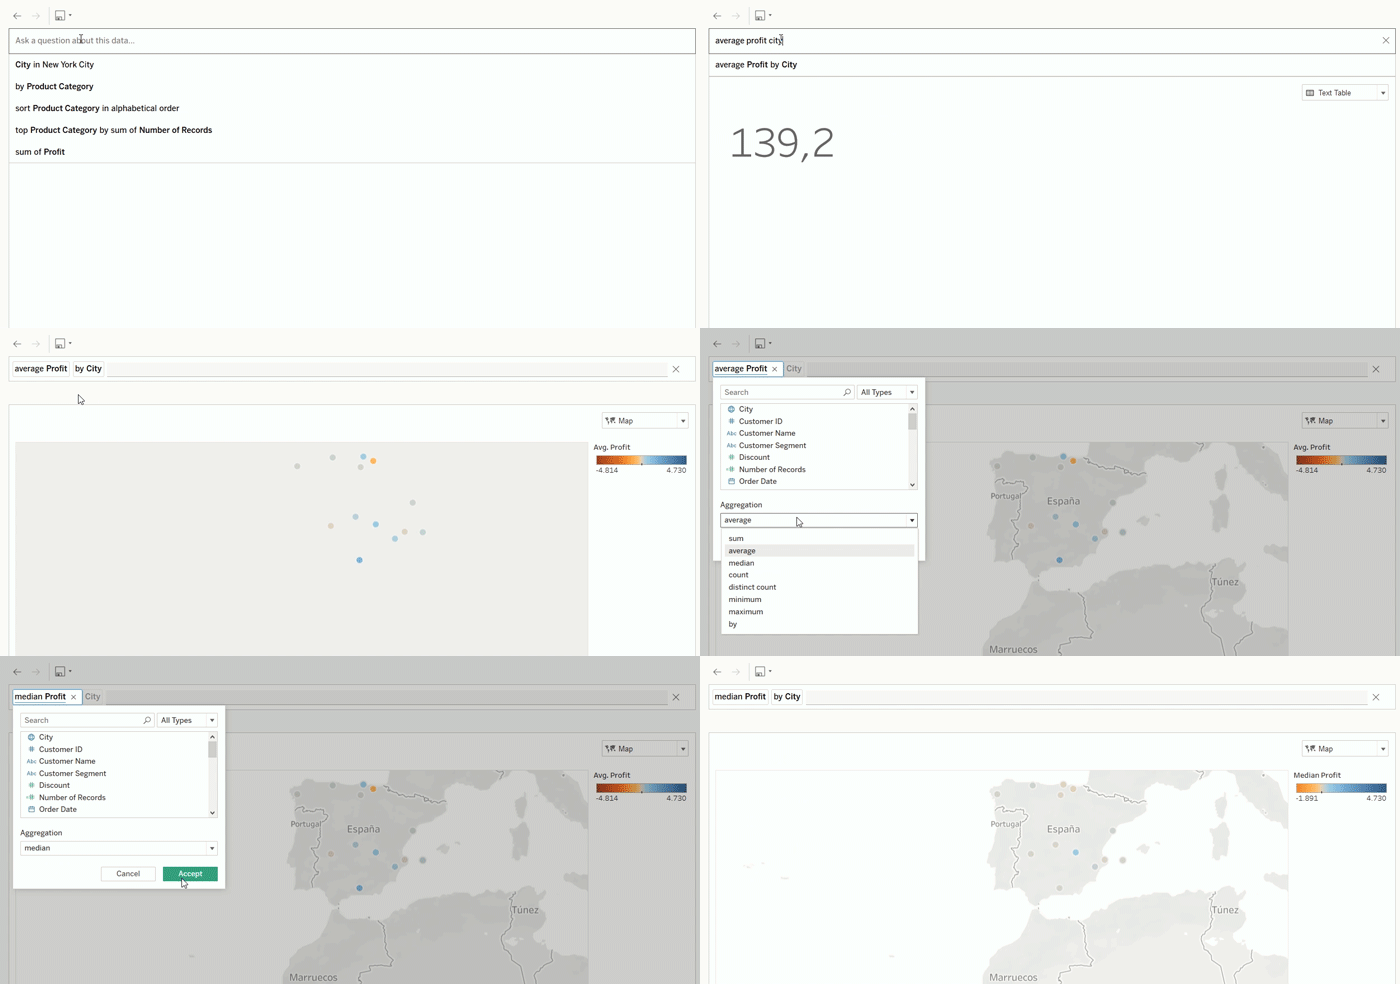
With Ask Data we can group using our dimensions. It also has five different types of aggregations: sum, average, median, count and distinct count. Note that we have the option to select maximums and minimums.
2.3. Synonyms
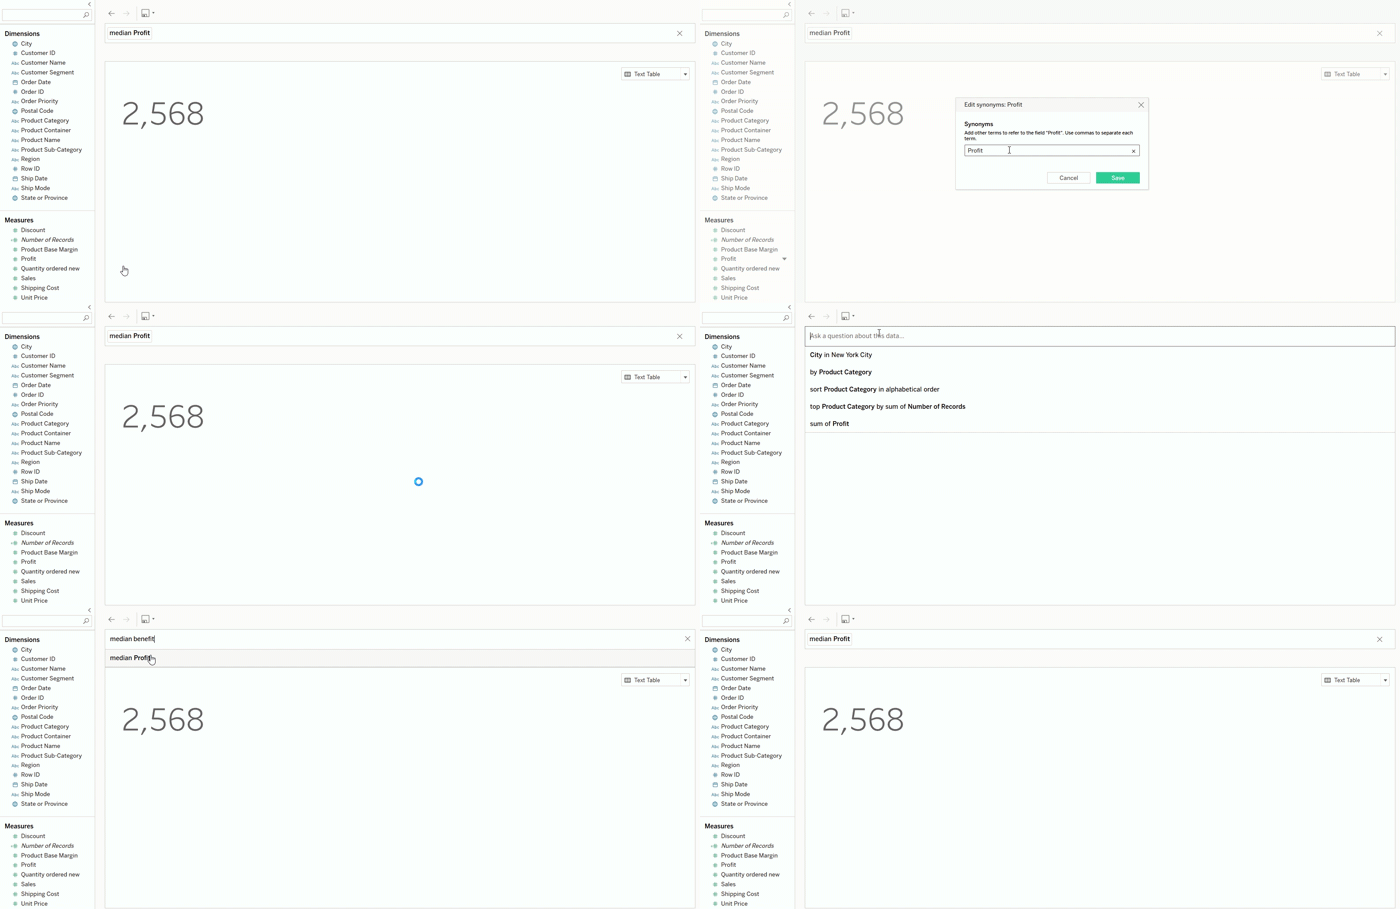
Ask Data doesn’t have default synonyms. However, we can add, delete and edit them to reference dimensions and measures from our data.
2.4. Choose the visualization you need
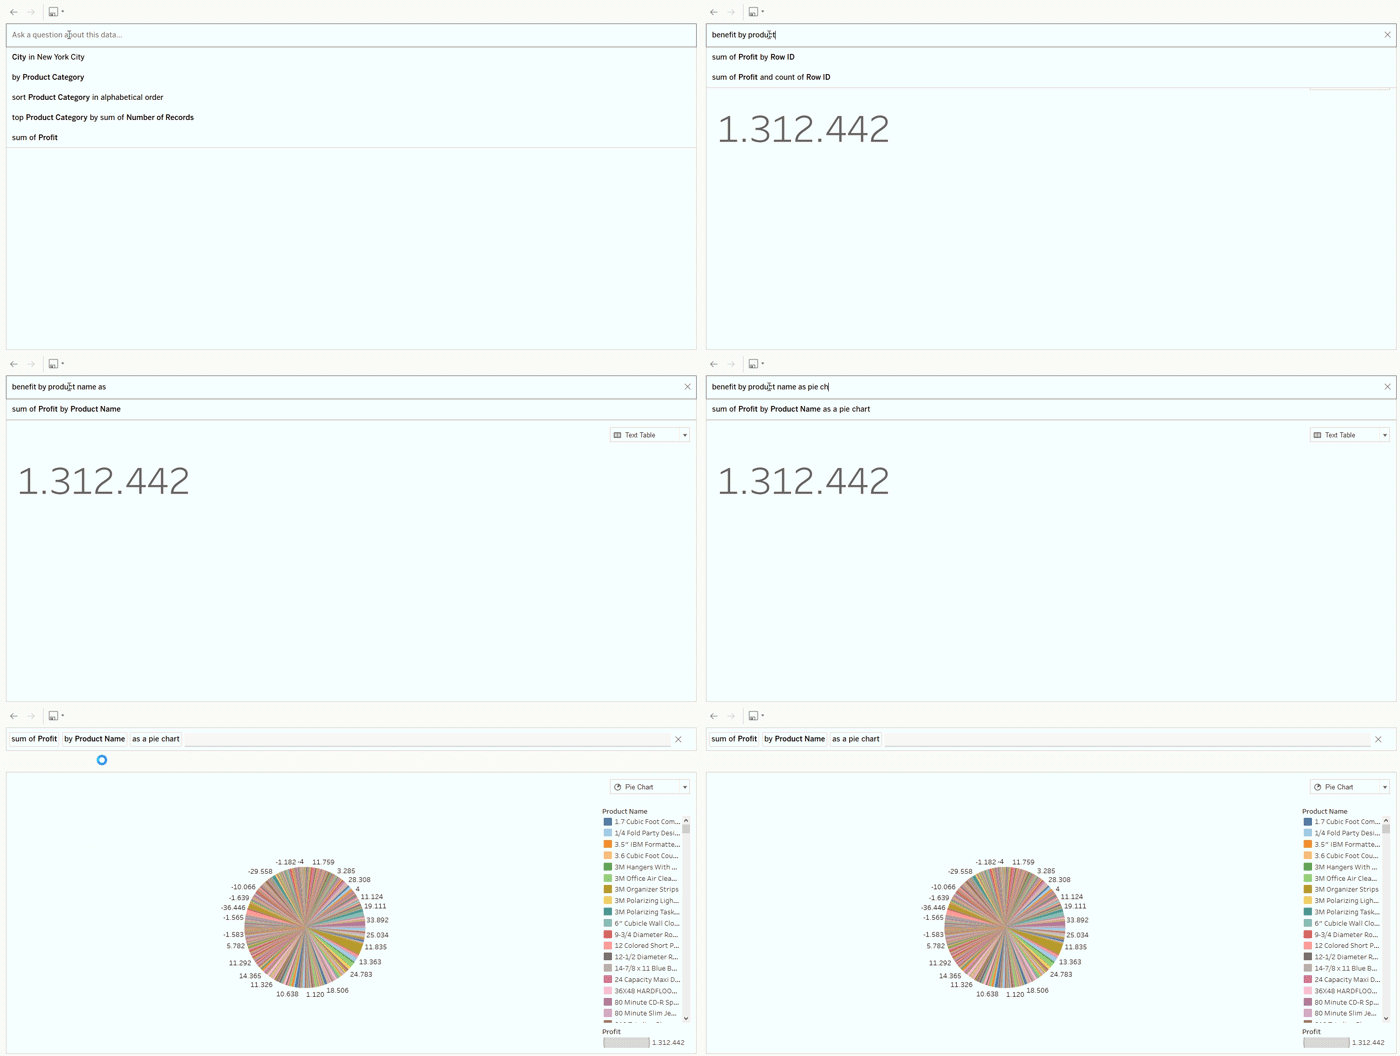
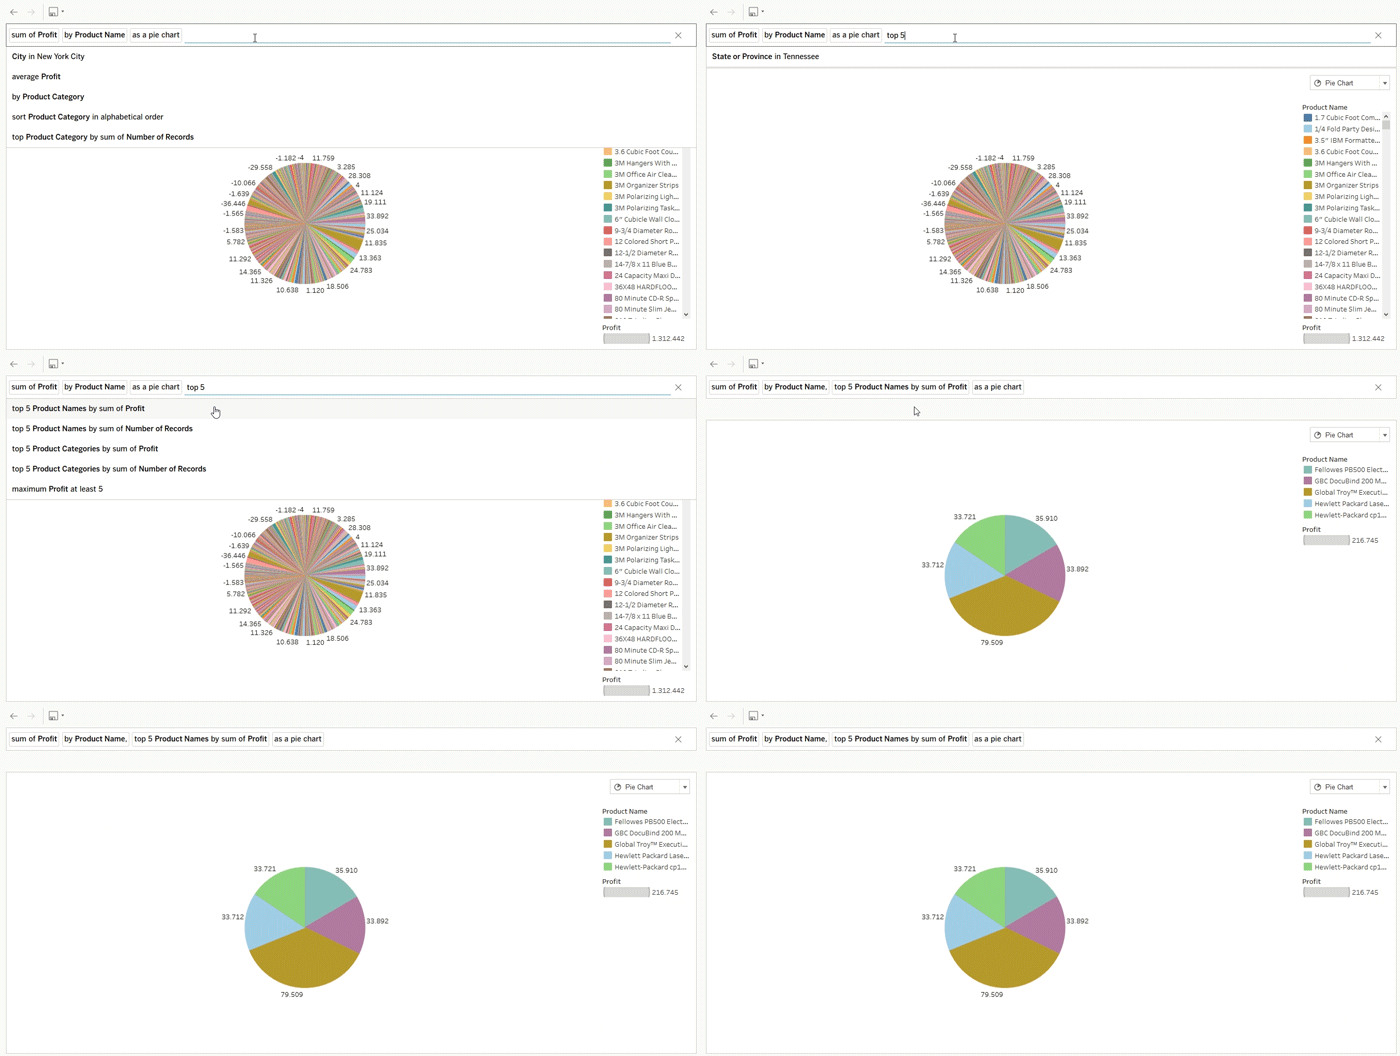
Tableau’s default visualizations are available in Ask Data. You can choose which one you want to display just by typing its name.
We can also select the top N or the bottom M elements of our viz if we need to, as in this case.
2.5.User interface
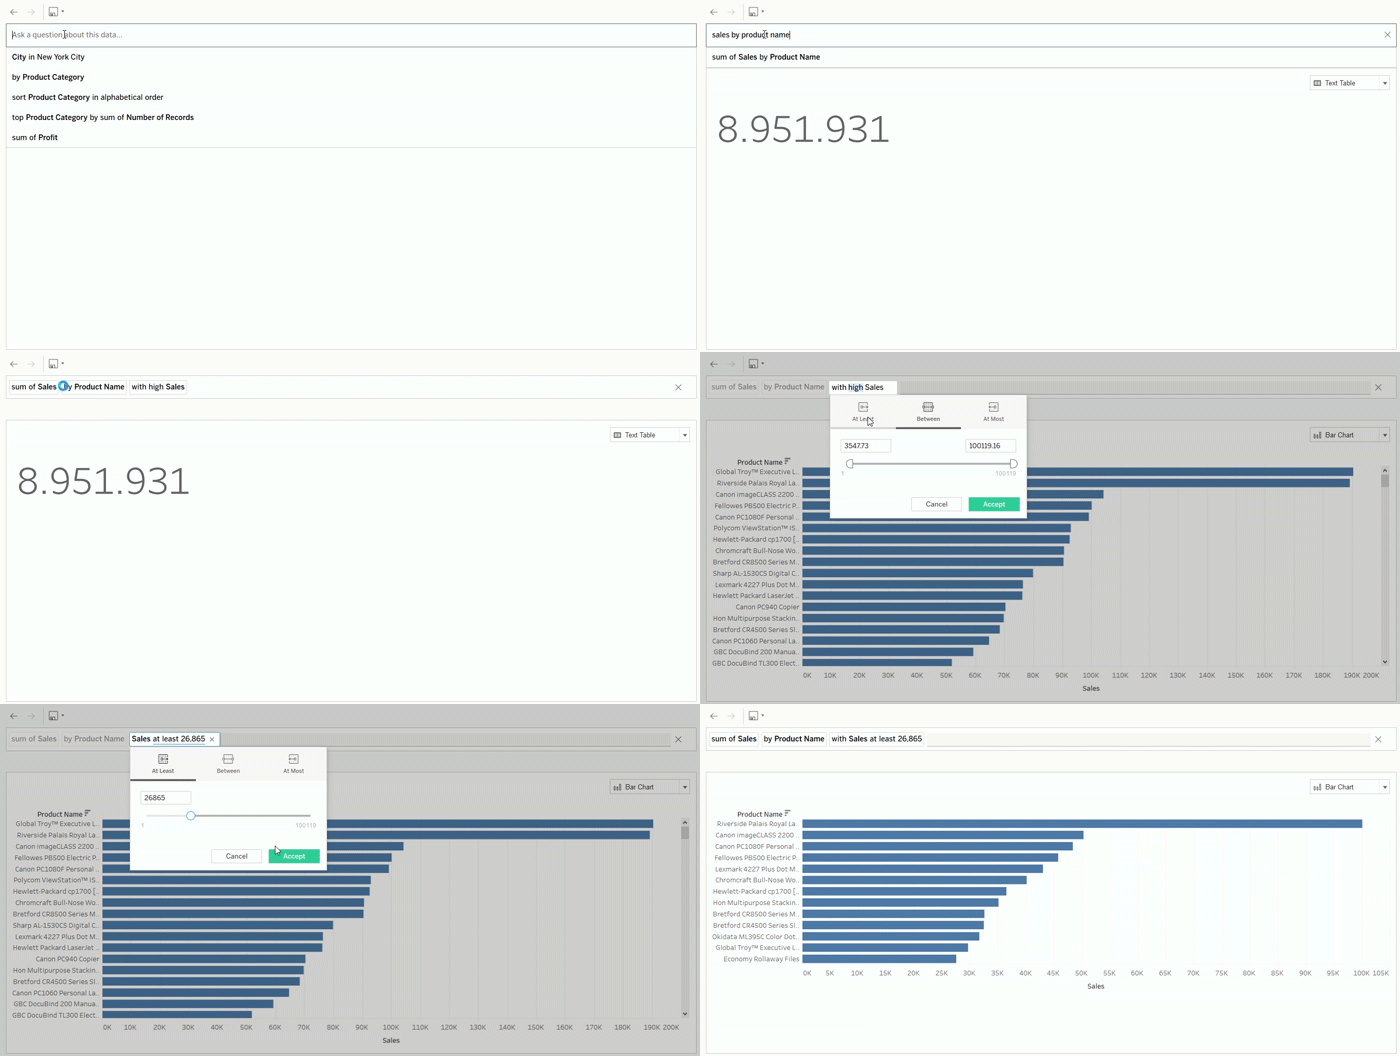
One of the most interactive features of Ask Data is a user interface that can refine our queries.
Conclusion
NLP is the perfect tool to get feedback from our data easily, and that is why it is gaining popularity in the business intelligence world. Ask Data is not only useful for answering our questions, but also for creating visualizations for our dashboards, just by asking!
Here we have seen only a few examples of what we can do with Ask Data, but the possibilities are endless, so we encourage you to try it and play with your data. Questions are there to be answered!
At ClearPeaks we are experts in Tableau, always updated with the latest features and working on enhanced visualizations. If you need more information about Tableau or about how we can help you, don’t hesitate to contact us.

