09 Oct 2017 Tableau Tricks – Using Shapes and Bar Charts to get Instant Insights
As Business Intelligence professionals, developing visually-intuitive dashboards for optimal data insights is one of our daily task. This is the first blog article of a series of articles where we will share useful tricks for developing key analytics tools with Tableau in order answer your questions or test your hypothesis.
In this blog article, we will explain how to combine shapes and bar charts to compare KPI performances over two periods of time. The main benefit of this approach is that the analysis is highly intuitive, so we get the data insights straight away.
Use Case
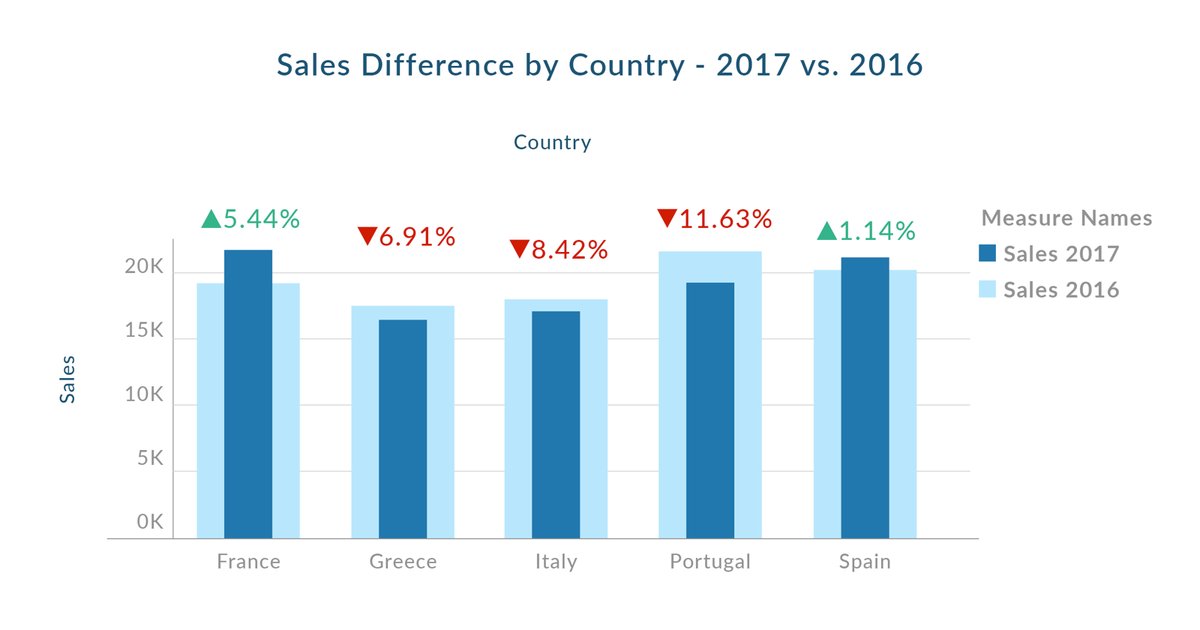
Imagine that you are the Head of Sales for the Mediterranean territory of a manufacturing company and you would like to know the difference between 2017 sales and 2016 sales by country (by percentage). As you can see, with this approach you can visually compare the sales by year for each country in a clear and easy way.

Below are all the steps that we need to follow in order to generate this analysis:
| Step 1 | First, we need to create three calculated fields: “Sales 2017”, “Sales 2016” and “Sales Diff %” |
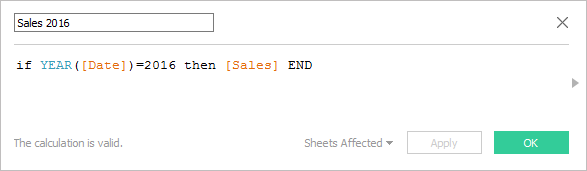
Figure 1: Formula to calculate sales in 2016
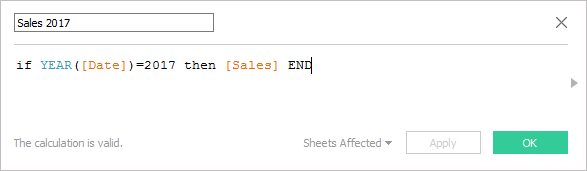
Figure 2: Formula to calculate sales in 2017
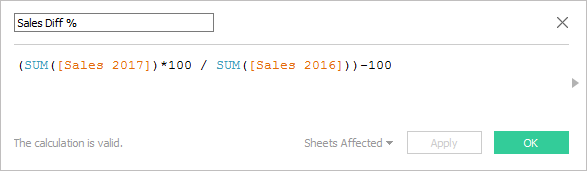
Figure 3: Formula to calculate % difference between sales in 2017 and 2016. We multiply it by 100 because afterwards this value will be converted to string
| Step 2 | Secondly, we have to create the bar chart, moving the “Country” dimension to Columns and the “Sales 2016” and “Sales 2017” measures to Rows. |
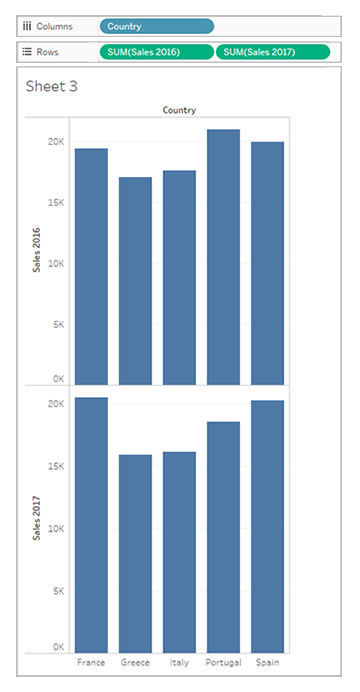
Figure 4: Tableau bar chart with separate measures
| Step 3 | Then, you have to apply some steps to change the look and feel of the bar chart. Here, we moved “Measure Names” to the Color tile, applied “Dual Axis” to one of the bar charts and resized the size of the bars from the Size tiles. |
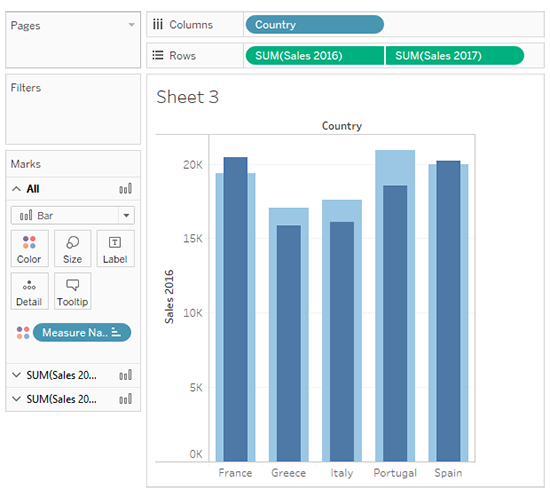
Figure 5: Tableau bar chart with “Dual Axis” applied, and with the bar size narrower for “Sales 2017” measure
| Step 4 | After customizing the look and feel, we need to create two new calculated fields, “Icon UP” and “Icon Down”. These fields will indicate if the sales in 2017 are increasing (Icon UP) or decreasing in relation with 2016. |
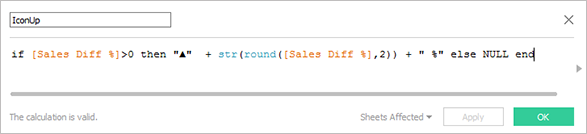
Figure 6: Formula with the text when de “Sales Diff %” is positive
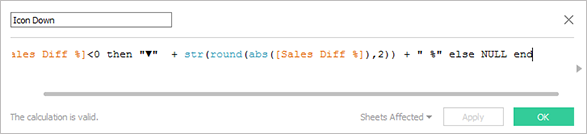
Figure 7: Formula with the text when de “Sales Diff %” is negative
| Step 5 | Finally, we have to move these two calculated fields into the Label tiles to display the yearly sales variation. Note that you will also need to change the Color label to make this analysis more intuitive. |
| In the “Sales 2016” mark, we put “Icon Down” into Label tile. |
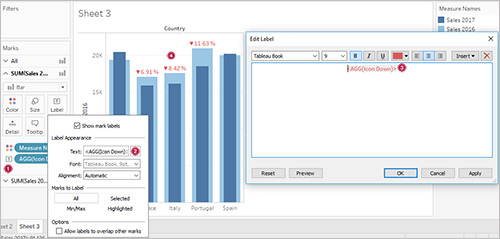
Figure 8: In the “Sales 2016” mark, we put “Icon Down” field into Label tile
| In “Sales 2017” mark, we put “Icon Up” into Label tile. |
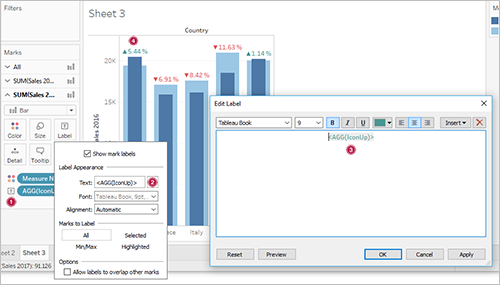
Figure 9: In the “Sales 2017” mark, we put “Icon Up” field into Label tile
And this is the final result:
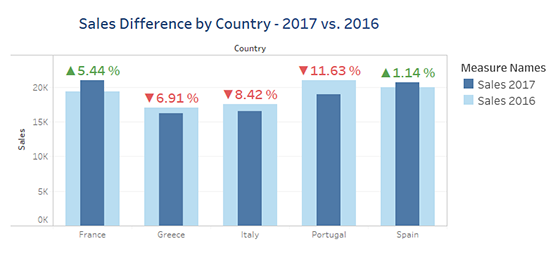
Figure 10: Bar chart to compare sales between 2017 and 2016 with text that shows the % difference
Conclusions
We can use some icons as text instead of using shapes, so that we take advantage of embedment into Labels or Tooltips.
These kind of analysis are very engaging when we perform data analysis or when we are currently in the data discovery processes because they allow us to get insights in a very quick and visual way.
As a Tableau partner, we are certified with the last Tableau Certifications, so do not hesitate to contact us if you have any data challenge in mind.