31 Oct 2018 Turn data into action in real time using Oracle Stream Analytics (OSA)
More than ever before, companies across most industries are challenged with handling large volumes of complex data in real time. Mobile data, in particular, has surged due to the boom in mobile devices and high-speed connectivity. High-velocity data brings high value, so companies are expected to process all their data quickly and flexibly, creating a need for the right tools to get the job done.
To meet this challenge, you need a solution with a different approach: first, you need a way to bring in all the different data sources much faster than traditional ETL, and you also need to be able to load in raw form, which means loading all metadata in the form it was generated — as a log file, database table, mainframe copybook or a social media stream. Second, you need a way to discover insights unencumbered by predefined models, and subsequently to visualize those insights with the visualizations automatically updated on live data. Once all that’s in place, you’ll be able to get meaningful insights from the changes in your business.
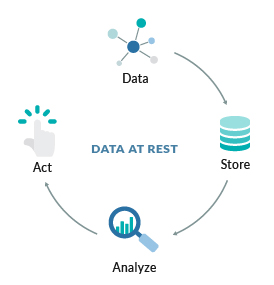
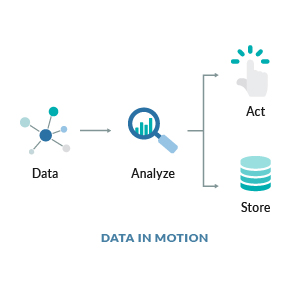
Below we can see the differences between traditional BI and streaming analytics:
 |  |  |
|
| |
Figure 1: Difference between Traditional BI and Streaming Analytics. | ||
Oracle Stream Analytics (OSA), previously known as Oracle Stream Explorer (OSE), is a graphical tool that provides “Business Insight into Fast Data”, via a web-based platform for exploring, analysis and manipulating streaming data in real time. OSA offers a compelling, friendly and visually stunning real-time streaming analytics user experience for business users to dynamically create and implement instant insight solutions. The best part of this tool is that it allows users to explore real-time data through live charts, maps, visualizations, and graphically build streaming pipelines without any hand coding.
Along with all the traditional and real-time data sources, the inclusion of Kafka is a real plus for OSA in the Big Data game. It’s a completely new integration method to work with many new-build data pipelines using it as a backbone technology. Its Big Data credentials include support for Kafka as the source and also as the target, as well as the option to execute across multiple nodes for scaling performance and capacity with Apache Spark.
OSA allows users to process and analyze large-scale real-time information by using sophisticated correlation patterns, enrichment, and machine learning. It offers real-time actionable business insights on streaming data, and automates actions to drive today’s agile businesses. They execute in a scalable and highly available clustered Big Data environment, using Spark integrated with Oracle’s Continuous Query Engine to address critical real-time use cases in modern enterprises.
1. Key features:
- Reusable business solution patterns available for users to select a familiar solution analysis.
- Graphical visualization through Graphical Editor of real-time data in various chart styles, maps and tabular displays.
- Analyze and correlate geospatial information in streams, graphically define and introspect location data and rules.
- Predictive analysis based on a wide selection of machine learning models, integration with industry-standard PMML format.
- Change data capture through integration with Oracle GoldenGate, analysis and transformation of captured operational mission-critical transactions.
- Rich set of event-stream sources and targets such as the streaming of CSV, JSON, and Avro files in Kafka and JMS queues.
- Robustness, scalability and speed through parallel, in-memory processing in Spark Big Data environment.
2. Common use cases:
The OSA platform targets a wealth of industries and functional areas. The following are typical use cases:
- Marketing and Retail: Real-time marketing to create advertisements and offers tailored to the geographical and situational context of the customer, dynamic pricing based on situational factors.
- Supply Chain and Logistics: Ability to track shipments in real time and detect and report on potential delays in arrival. Control stocking levels based on change in demand and shipping predictions.
- IT Systems: Monitor and recognize failures and performance bottlenecks in applications or servers and trigger corrective measures. Identify security risks and incidents and initiate response.
- Telecommunications: Ability to perform real-time call detail (CDR), record monitoring and distributed denial of service attack detection.
- Financial Services: Perform real-time risk analysis, monitoring and reporting of financial securities trading and calculate foreign exchange prices.
- Transportation: Ability to create passenger alerts and detect baggage location in case of flight discrepancies due to local or destination-city weather, ground crew operations, airport security, etc.
- Public Sector/Military: Detect dispersed geographical enemy information, abstract it, and decipher the probability of enemy attack. Ability to alert the most appropriate resources to respond to an emergency.
- Insurance: Ability to learn and to detect potentially fraudulent claims.
An important aspect of stream analytics is that it must respect the temporal dimension of the events, and to achieve this the processing must be continuous and fast. OSA can process millions of events per second on the commodity hardware with the latency at the microsecond level. Oracle’s new version of OSA, 18.1, is now available in three capacities:
- In the cloud as part of Oracle Data Integration Platform Cloud
- On premise asOracle Stream Analytics
- On premise as part of Oracle GoldenGate for Big Data
3. Prerequisites of Oracle Stream Analytics:
The following software is required to run OSA:
- Oracle JDK 8 Update 131 and higher versions.
- Repository Database
- Oracle Database versions 12.2.0.1 or higher, 12.1.0.1 or higher, and 11.2.0.4 or higher.
- Alternatively, you can use MySQL version 5.6 or 5.7.
- A running Hadoop cluster, version 2.7 or higher.
- A running Kafka cluster, version 0.10.2.0 or higher.
- Locally installed Spark, version 2.2.1 built for Hadoop 2.7.
- Install Spark and JDK in the same node where you plan to install OSA.
- Google Chrome, version 60 or higher.
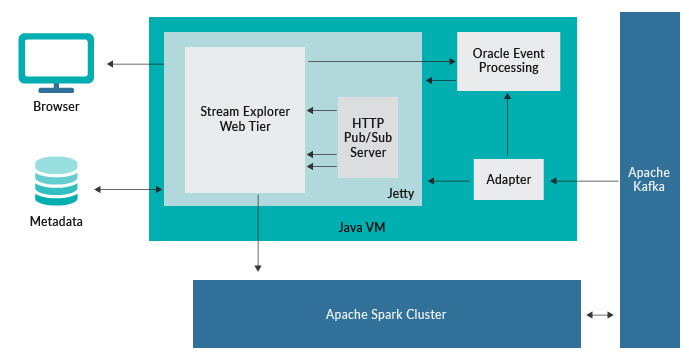
Figure 2: High Level Architecture.
OSA’s great architecture is built on the industry-leading Spark Streaming standard to allow horizontal scaling in a cluster using on-premise or cloud big data architecture. Spark provides high-speed parallel in-memory processing to scale to any size load, and offers high availability through redundancy across the cluster. OSA combines the standard Spark framework with its CQL event-processing framework to add patented event processing with exactly-once delivery guarantees. Distributed caching is provided through the Oracle Coherence In-memory cache that is seamlessly embedded as part of the Spark deployment.
As seen in the Architecture diagram, a web application like Jetty Server is deployed along with the Internal Pub/Sub Server, using a metadata store to manage its configuration and also to get the definition of applications to be deployed to one of two event-processing platforms: either Oracle Event Processing or Apache Spark Cluster, depending on the processing throughput that’s required. For massive scalability you deploy the application on Apache Spark, otherwise event processing can handle the load through vertical scalability. Another element is Apache Kafka, used to ingest more data from other sources or as a target for exploration. An Adapter is used to collect the results from the explorations running in Spark and forwards them to OEP or Stream Explore to view the results or to use them as inputs to another application.
4. How does Oracle Stream Analytics work?
As shown in the Data flow diagram below, Stream Analytics starts with ingesting data from all the different sources through gateways which filter, aggregate and send the events to a data pipeline. A data pipeline can query data using time windows, look for patterns, and apply conditional logic while the data is still in motion. The query language used in Stream Analytics is called Continuous Query Language (CQL) and is similar to SQL. The pipelines analyze and forward the results to the Visualization layer for users to explore and act on.
It provides an interactive UI to explore streaming data through visualizations or live data views and builds streaming pipelines without coding. Users can introspect data from streams and get immediate feedback on how patterns applied on the live data create actionable results. Streaming pipelines can be built through a graphical designer that shows a diagram of stages that incoming data runs through. Data can be reviewed and manipulated in a spreadsheet-like tabular view, allowing users to add, remove, rename, or filter columns to obtain the desired result.
Though CQL is declarative, there is no need to write any code in Stream Analytics. The web-based tool automatically generates queries and the Spark Streaming pipeline. Once data is analyzed and a situation is detected, the pipeline can terminate to trigger BPM workflows in Oracle Integration Cloud or save results into a Data Lake for deeper insights and intelligence using Oracle Analytics Cloud.
Geospatial analysis is often a component of event processing as location is a typical form of ephemeral information that needs to be acted upon in real time. Oracle Stream Analytics provides functionality to build location-aware applications and detect events such as entry and exit from observed areas as well as proximity and speed of traced objects.
Map views allow users to graphically define areas of interest by defining geo-fences and to track locations of objects over time as well. Maps can be colour-coded, based on statistical data and can visualize proportions based on size.
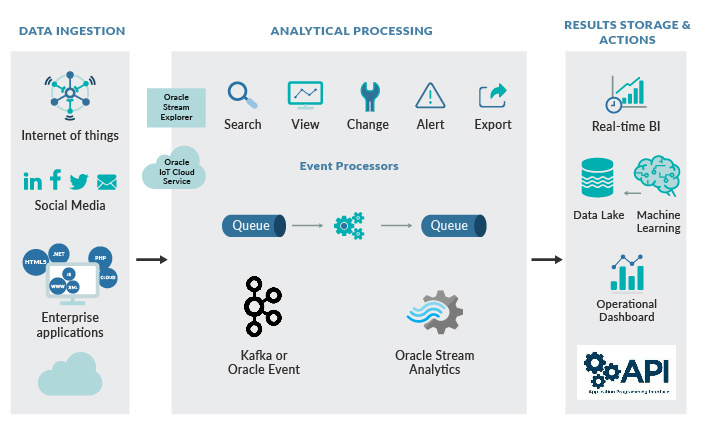
Figure 3: Data Flow Diagram.
To try OSA for yourself, you can download it here.
To start with, we sign in to Oracle Stream Analytics:
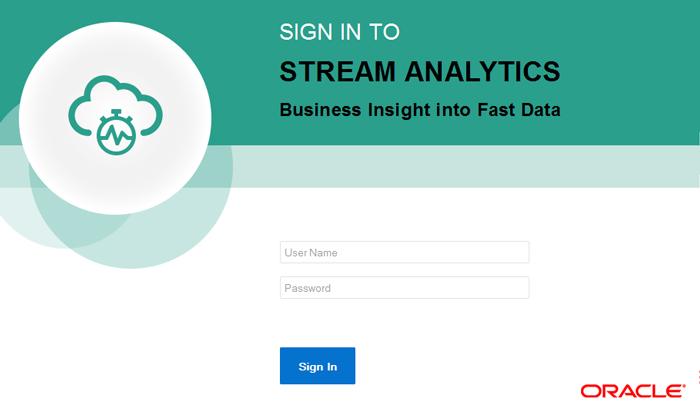
Figure 4: Login Screen.
From here, click on the Catalog link to see a list of all the resources. Some of the resource types include:
- Explorations– front-end for seeing contents of streams in real-time, as well as applying light transformations.
- Streams– definitions of sources of data such as Kafka, JMS, EDN Events or simulated Business Events from CSV Files.
- Connections– servers and sources from which the streams are defined.
- Targets– destination for transformed streams.
- Pattern – rich set of pattern library to analyze complex event patterns.
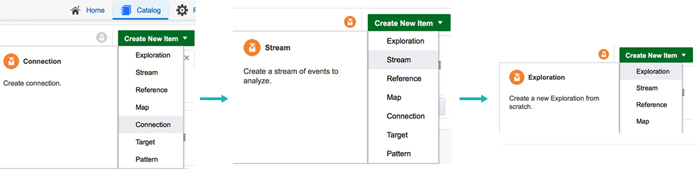
Figure 5: Data Exploration Steps.
The above picture shows the steps to follow to explore data. First we will create a connection to the Twitter data feed, Kafka, JMS Connection or Oracle Database. We just need to pass the corresponding connection details to the GUI window. The next step is to create a stream based on the required set of parameters which is also a completely GUI-based interface; then we can start the exploration of the live-stream data.
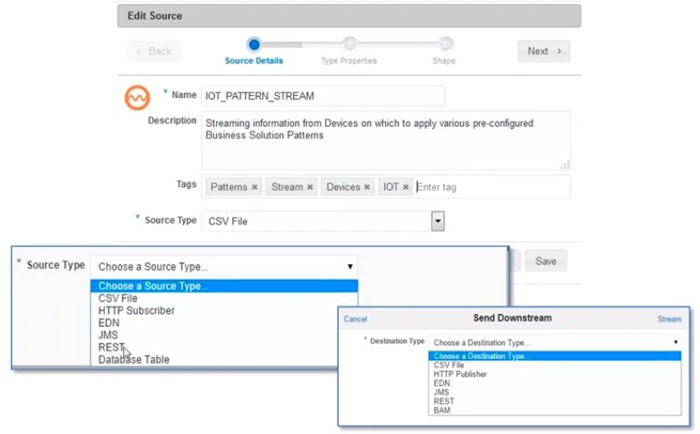
Figure 6: Different Source Types.
As shown above, you can see a combination of standard messaging protocols, mainstream and emerging technologies like MQTT (Message Queuing Telemetry Transport) as well as tools to help us during development like CSV or HTTP Subscriber and so on. It can read/publish fast-streaming data from/to Kafka, EDN, REST and Twitter. Out-of-the-box, zero coding, with a very intuitive web interface.
5. What streaming patterns are available?
OSA provides an extensive pattern library to analyze complex event patterns for a wide array of use cases such as Real-Time Log Analytics, Digital Marketing, Predictive Maintenance, Fraud Detection, Smart Inventory, Dynamic Pricing, etc. For example, patterns can detect correlated events, such as a door closing within 10 seconds of opening, spikes in values, such as a temperature spike of 30% above the average within a given time, or detecting a W-pattern in financial trading. Patterns can also detect if the weight of manufactured items is slowly trending lower or if the reading falls outside acceptable norms: this signals a potential problem or future maintenance need.
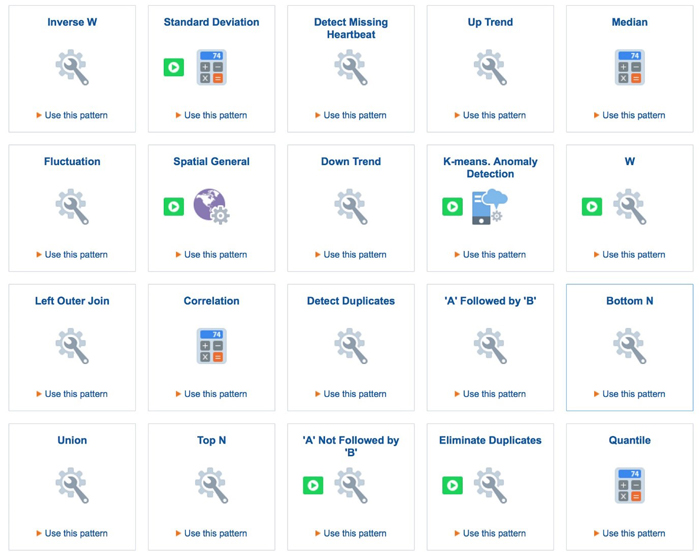
Figure 7: Oracle Stream Analytics Pattern Library .
Conclusions
Oracle Stream Analytics provides very comprehensive stream analytical capabilities to help you explore real-time data and make decisions. It is one of the best tools which can be used to identify business threats and opportunities by filtering, aggregating, correlating, and analyzing a high volume of data in real time. OSA not only allows you to consume streams, but also to produce them. You can export any of your streams in real time to many targets, like CSV Files, REST API, Kafka, MQTT and HTTP Publisher.
If you’d like to know more about what OSA can do for your business, just contact us here at ClearPeaks !