19 Jun 2019 Tableau 2019.2: Origin-Destination Maps
This May Tableau 2019.2 was released, offering a lot of interesting features; in this blog article we are going to have a look at them, focusing on the new mapping functions, in particular the spatial calculation support provided by MakePoint and MakeLine, allowing us to create two-point origin-destination maps easily, just by using latitude and longitude coordinates.
We will run through how to use this feature to display paths between origins and destinations on a map, but first let’s check out the other new features of this release.
1. Tableau 2019.2 new features
Below we can see the new features to be found in Tableau 2019.2.
1.1. Customize Language
- Select from ten different languages for Tableau.
1.2. Connect to and Prepare Data
- Connect to PostgreSQL + PostGIS and Pivotal Greenplum + PostGIS spatial data.
- Use features added to the Marketo connector.
- Connect to TabPy external services using SSL.
1.3. Design Views and Analyze Data
- Use parameter actions to set parameter values interactively.
- Pan, zoom, and explore with vector tile background maps.
- Customize how your map looks with new map styles and layers.
- New spatial calculations: MakeLine and MakePoint.
- Replace sheets in dashboards.
- Use text for navigation buttons in dashboards.
- Show and hide floating containers in dashboards.
- Customize reference line tooltips.
- Disable the sort icon.
1.4. Prepare, Author, and View Data on the Web
- Ask questions in a conversational style with Ask Data.
- Apply simple calculations with Ask Data.
- Create multiple sheets from Ask Data.
- See how people are using Ask Data.
- Additional enhancements to Ask Data.
- Create, edit, and remove parameters in web authoring.
- Save custom views with the Viewer role.
- Use parameters with stored procedures in Tableau Online and Tableau Server.
- See your view’s total marks and more in the status bar.
- Drop field menu in web authoring.
1.5. Save and Publish Data Sources and Workbooks
- Export stories to PowerPoint.
1.6. Collaborate with Tableau Online and Tableau Server
- Discover the new face of Tableau Server and Tableau Online.
- Subscribe to existing data-driven alerts.
2. Mapping Feature: MakePoint and MakeLine
Before this new Tableau release, creating paths between an origin and a destination was only possible with some workarounds, but now, with these new capabilities, we can do it much more easily.
To show you the new mapping feature and how to create a two-point origin-destination map, we will use the bike-trip data provided by Citi Bike NYC on their webpage, as we have done in previous use-case examples.
The data set contains the latitude and longitude for the start and end stations for each trip; we will use these fields to display the trips made by Citi Bike NYC users in May 2019.
The first thing to do is to create the points for each start and end station, using the MakePoint function.
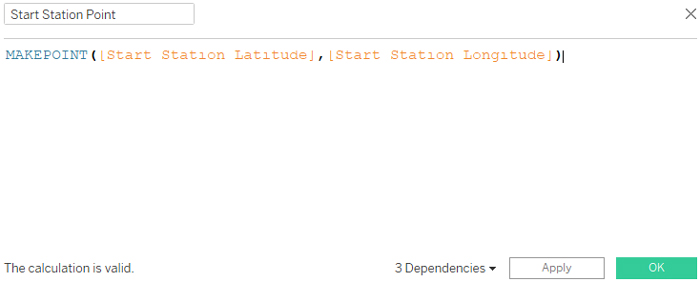 | 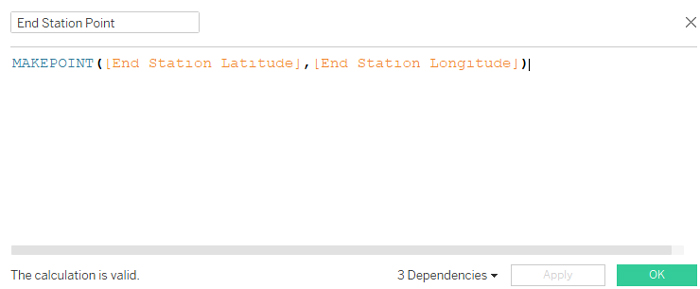 |
Figure 1: Calculated fields containing the points for the start and end stations of each trip.
Once we have done that, we can calculate the paths that join them, representing each trip.
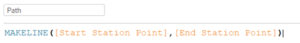
Figure 2: Calculated field that contains the line between start stations and end stations.
With the paths now created, we just have to add the calculated field to the marks of a chart and the map with the paths will be created automatically.
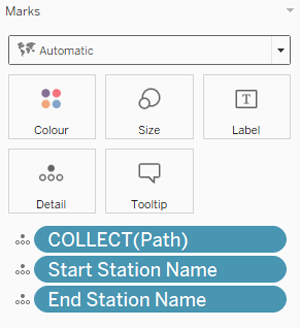
Figure 2: Marks of the map with the paths representing the trips.
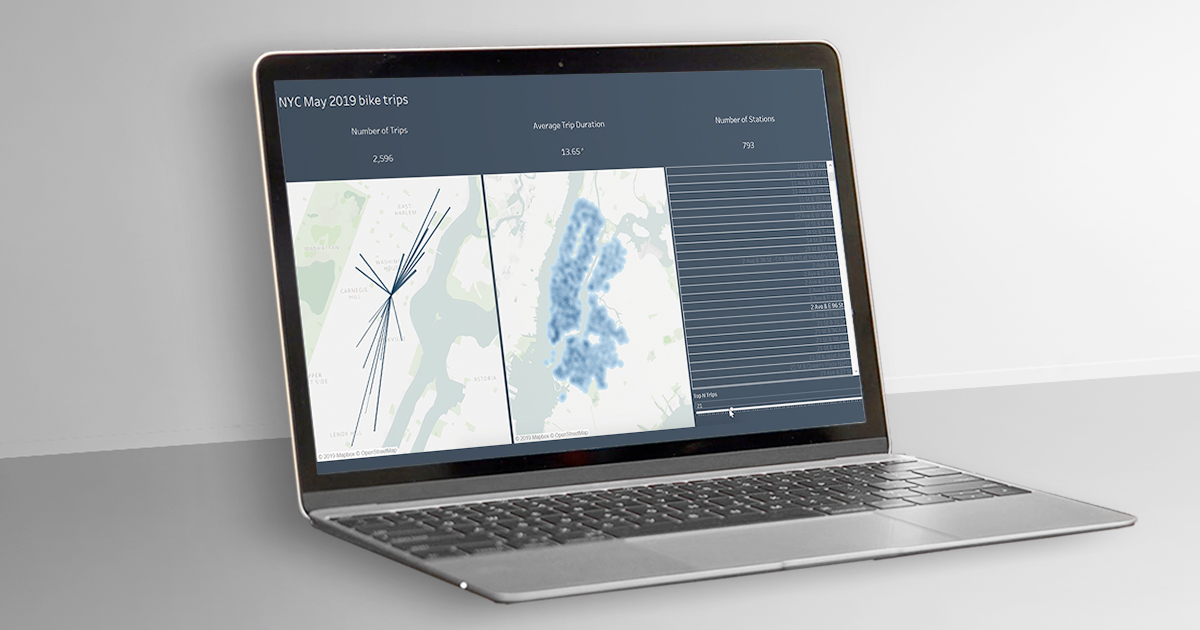
Now let’s try the map in a dashboard – here we can see an analysis of the trips made from each station by Citi Bike NYC users in May 2019.
Conclusion
With the new Tableau update we can easily create origin-destination paths on our maps using the MakePoint and MakeLine functions. Now, with the coordinates of the points of interest, we are able to create maps showing paths using just a calculated field without any workarounds.
At ClearPeaks we are experts in Tableau, always up-to-date with the latest features and working on enhanced visualizations. If you need more information about Tableau or about how we can help you, please don’t hesitate to contact us.