28 Jan 2026 Power BI for Modern Financial Reporting
Finance teams can face complex challenges: executives demand faster insights, more frequent forecasting, and consolidated views of performance across entities and regions. Traditional tools like Excel often slow things down, as they’re heavily manual, poorly connected, and prone to errors.
Microsoft’s Power BI offers a modern, automated, and visual alternative for financial reporting. With its strong modelling capabilities and interactive dashboards, it lets organisations combine time intelligence, scenario analysis, and multi-entity consolidation into a single, governed solution.
In this post, we’ll see how Power BI empowers financial reporting by focusing on these three key elements:
- Time Intelligence: comparing performance across time periods.
- Scenarios: budget, forecast, and actual comparisons.
- Consolidations: integrating results from multiple entities.
We’ll also share some practical examples and reference schemas that you can use to start building your own financial dashboards.
Time Intelligence – Turning Data into Timelines
One of the most valuable aspects of financial reporting is understanding how performance evolves over time. Whether it’s revenue growth, cost control, or better margins, financial analysts constantly compare performance across periods, such as month-on-month, year-on-year, quarter-to-date, etc.
Why Time Intelligence Matters
- It enables trend analysis by identifying whether performance is improving or declining.
- It simplifies variance tracking by comparing this month’s sales with last month or last year.
- It supports rolling analysis, smoothing out seasonality by analysing trailing 12-month trends.
- It can detect seasonal patterns or structural shifts in the business.
How to Implement It in Power BI
Power BI’s DAX time-intelligence functions make these comparisons straightforward once you have a proper date table that includes:
- Continuous dates over multiple years.
- Columns for Year, Quarter, Month, Week, and Day.
- Flags for the current month, current year, and YTD periods.
In the following images you can see revenue by year and month for all entities:
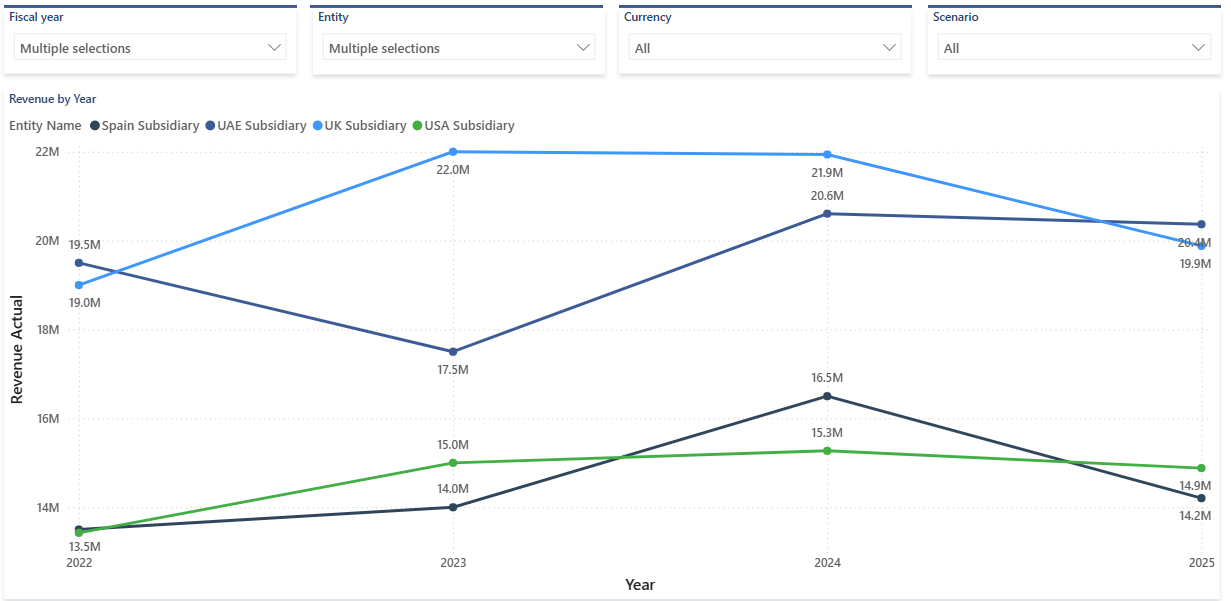
Figure 1: Power BI Chart Using Yearly Time Series
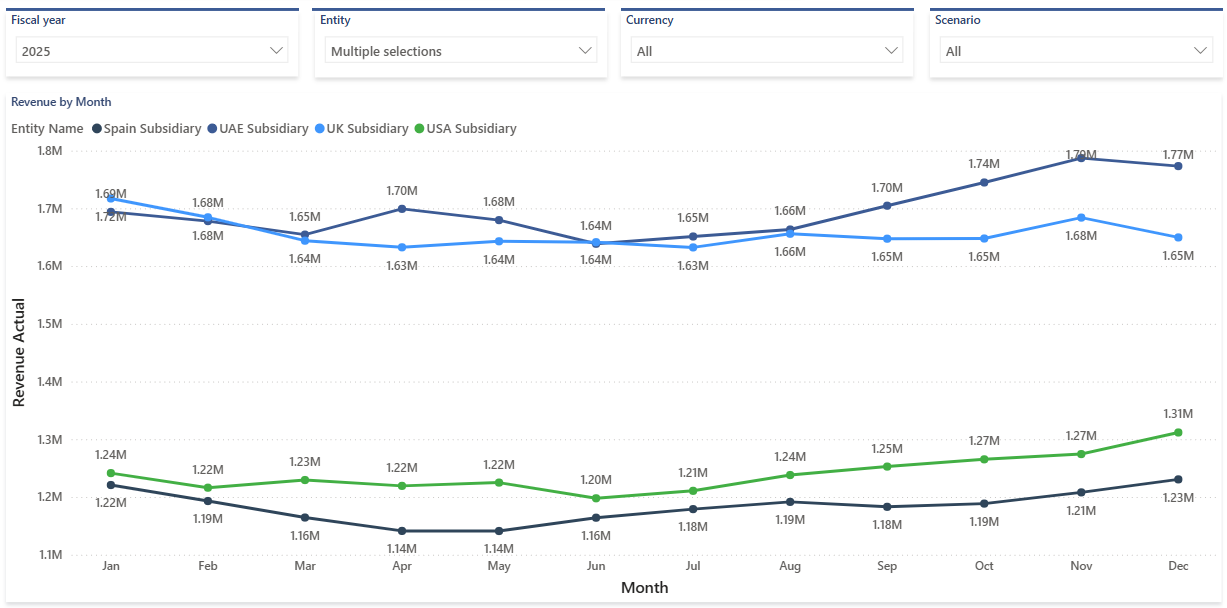
Figure 2: Power BI Chart Using monthly Time Series
By embedding these patterns into your model, you’ll turn static financials into dynamic time-based insights.
Scenario Analysis – Actuals, Budgets, and Forecasts
Finance teams work with scenarios, tracking what happened (Actuals), what was planned (Budgets), and what is expected to happen (Forecasts). Power BI provides a powerful environment to visualise and manage these different versions of financial data.
Scenario Dimensions
In a typical financial model, you’ll want a Scenario dimension with these three members:
- Actual: historical figures loaded from the ERP or accounting systems.
- Budget: approved targets for the fiscal year.
- Forecast: revised expectations, usually updated monthly or quarterly.
How to Structure the Data
You can organise your data in a single fact table with a dedicated column identifying the scenario, for example with what-if scenarios.
Power BI’s What-If parameters allow you to model hypothetical situations:
- “What if sales increase by 5%?”
- “What if the cost of goods sold rises by 3%?”
- “What if we delay project revenue by one quarter?”
These parameters enable slider-driven analysis, instantly recalculating key KPIs for management meetings or budget reviews.
Benefits of Scenario Modelling
- It unifies multiple perspectives (Actuals, Budgets, Forecasts) in a single model.
- It enables real-time variance analysis across any metric.
- It encourages proactive decision-making through what-if exploration.
- It automates processes that used to rely on multiple Excel workbooks.
By structuring scenarios effectively, you can deliver dashboards that offer business users both clarity and flexibility.

Figure 3: Bar chart, matrix and table of scenarios by entities
Consolidation – Bringing Entities Together
Large organisations often operate through various subsidiaries or business units; each entity may use its own currency, chart of accounts, and fiscal calendar. Consolidating these results manually is time-consuming and easy to get wrong.
Power BI’s data modelling capabilities can automate much of this process, ensuring a single version of the truth across entities.
Consolidation Challenges
- Multiple currencies, e.g. EUR, USD, GBP, AED.
- Different charts of accounts: subsidiaries may use local general ledger (GL) structures.
- Intercompany eliminations, where transactions between group entities must be excluded.
- Varying fiscal periods and the alignment of different calendars.
Modelling the Consolidation
A typical model includes:
- Fact table of financial data (Actuals, Budgets, etc.).
- Entity dimension with hierarchy (Group → Region → Company).
- Currency dimension with daily/monthly exchange rates.
- Scenario dimension, as explained above.
- Date dimension for time intelligence.
When entities are grouped in a hierarchy, visuals such as matrix tables or treemaps can show roll-ups from subsidiary to region to group total.
Visual Concepts
- Matrix comparing actual vs budget by entity.
- Hierarchical tree visual showing contribution from subsidiary through region to group total.
- Map highlighting regional performance.
- Currency filter to switch between local and consolidated views.
Benefits of Automated Consolidation
- It eliminates manual Excel workbooks and last-minute adjustments.
- It delivers group-wide visibility instantly after each data refresh.
- It ensures consistent KPIs and currency handling across the organisation.
- It supports secure access through Row-Level Security (RLS).
When consolidation is built into Power BI, Finance can focus on analysis, not data preparation.
Integrated Architecture – The Complete Picture
Bringing together time intelligence, scenario analysis, and consolidation requires a well-structured model. Here’s a simplified conceptual architecture:
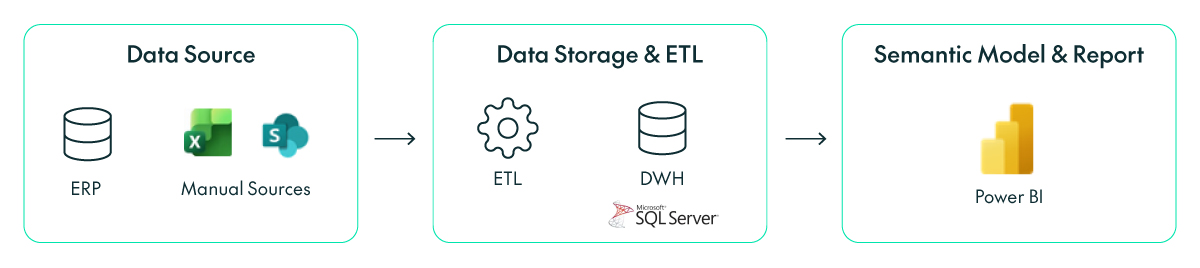
Figure 4: Standard architecture of a financial business intelligence project
Benefits
These are the benefits of integrating all financial data into one model:
- Automation: ensures that the latest numbers are always available.
- Consistency: KPIs and metrics are defined centrally, avoiding conflicting calculations.
- Governance: access controls, lineage, and refresh logs are managed via Power BI Service.
- Scalability: easily extended to new entities or currencies.
Typical Deliverables
- Executive summary dashboard (KPIs, trends, variances).
- Detailed P&L pages (actual vs budget, YoY variance).
- Entity consolidation view.
- Forecast accuracy report.
- Time-trend visual (rolling 12-month revenue/profit).
A complete Power BI financial reporting solution reduces reporting cycles, improves transparency, and supports faster decision-making across finance and management.
Practical Tips to Build the Solution
- Build a proper date table once; don’t rely on an auto-generated table.
- Model dimensions clearly (Scenario, Entity, Account, Currency).
- Use explicit measures in DAX and avoid implicit sums.
- Name measures clearly (e.g., “Revenue YTD USD”).
- Avoid bi-directional relationships unless absolutely necessary.
- Design for your audience: executives want clear KPIs and visuals, whilst analysts need detailed tables.
- Enable drill-throughs from Group to Entity to Account.
- Document calculations and maintain a data dictionary.
- Schedule refreshes and monitor dataset performance.
- Start small and iterate quickly, prioritising insights over complexity.
Datasets to Build Your Power BI Financial Model
Here’s a basic star schema you can use to build the semantic model, define the measures, and then create the report:
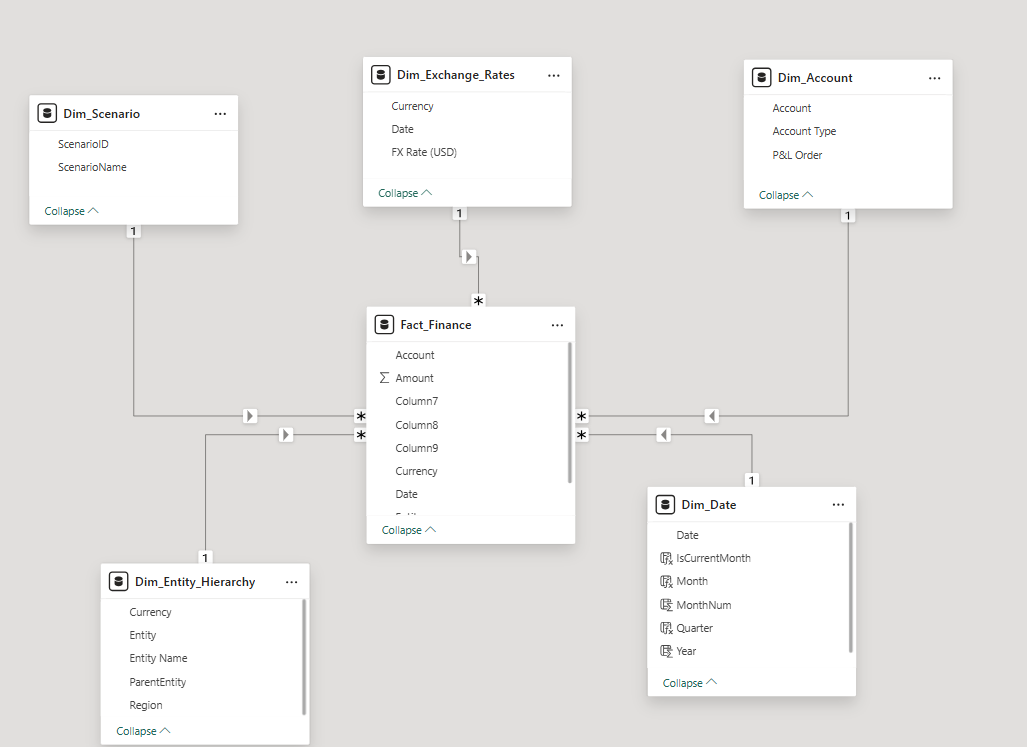
Figure 5: Standard data model of a financial business intelligence solution
Conclusion
Building financial reporting solutions in Power BI isn’t just about creating dashboards, but about transforming how finance teams operate. By embedding time intelligence, scenario management, and entity consolidation into a single automated model, organisations gain:
- Speed: reports refresh automatically, removing the need for manual consolidation.
- Transparency: every figure is traceable back to the source.
- Consistency: a single source of the truth across teams.
- Agility: what-if modelling means rapid responses to change.
Finance can switch from data preparation to value-adding analysis; Power BI becomes more than a reporting tool and works as a strategic decision-support platform.
If you’d like to explore this further, please get in touch with us. We can help you to design and implement a robust Power BI financial reporting solution, enabling your team to move faster with a single, consistent view of the numbers