20 Ago 2025 A USERELATIONSHIP-Free Approach to Displaying Historical Metrics in Power BI
The Challenge
Business reports often need to display dynamic historical views in Power BI, such as month‑on‑month or year‑on‑year KPI trends, based on a user‑selected reference date or period.
Many published solutions hinge on the DAX function USERELATIONSHIP. However, USERELATIONSHIP does not behave reliably under Row‑Level Security (RLS): filters can yield blanks or errors, and results can become unpredictable, making it a poor choice for enterprise semantic models.
For more information on the limitations of the USERELATIONSHIP DAX function, refer to the official Microsoft documentation: https://learn.microsoft.com/en-us/dax/userelationship-function-dax
The Solution
In this article, we’ll offer an alternative method that avoids the USERELATIONSHIP function to ensure compatibility with RLS, allowing users to select a date or time period via a slicer and dynamically view historical trends, for instance, the last six months or the last four years, for any metric.
Before diving into the implementation, please note that this solution assumes the existence of a Date dimension that contains at least the following columns:
| Column Name | Data Type |
| Date | date |
| Month | text |
| Month ID | integer |
| Year | integer |
| Year Month | text |
| Year Month ID | integer |
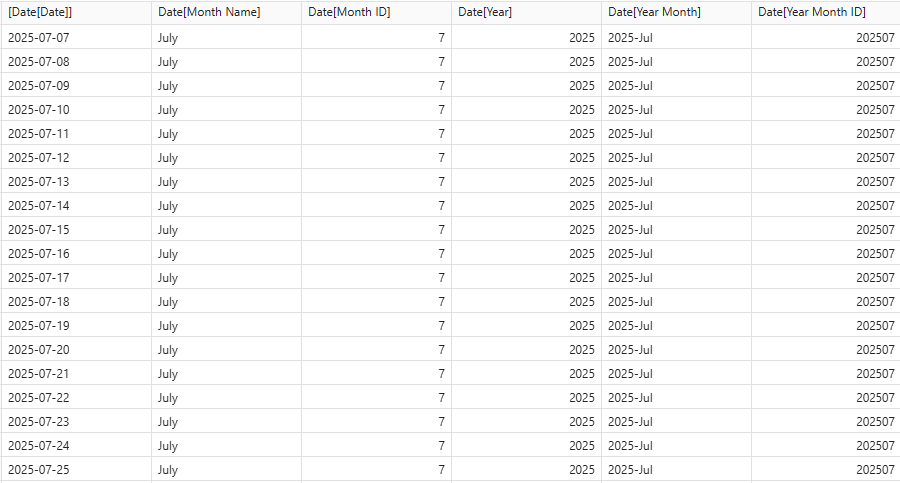
Bearing the above in mind, let’s look at how to implement this solution:
Step 1: Create a Disconnected Date Dimension
First, create a duplicate of your existing Date table. Name this new table Date Time Travel, using the following expression:
Date Time Travel = 'Date'
This new table must not have any relationship to any other tables in your model, not even the original Date table. It’s a completely disconnected helper table that will serve as the engine for our time travel logic.
Note: Ensure to configure this new dimension properly so that all columns display data in an orderly manner.
Step 2: Define a Calculation Group
Now create a Calculation Group named Time Travel Options; the column for this Calculation Group can be named Time Travel Option. In our example, we’ll create a calculation item called Last 6 months, which displays data from the six months leading up to the selected date.
Here’s the DAX expression for the calculation item:
Last 6 months =
//Defines the number of months that will be displayed in the visual
Var NumberOfMonths_ = 5 --- One month less because the initial position is zero

//Determines the final month that has been selected by the user
Var SelectedMonth_ = MAX('Date'[Year Month ID])

//Determines the final date that has been selected by the user
Var EndDate_ = MAX('Date'[Date])

//Determines the first date of the period by using the ‘EndDate_’ variable
Var StartDate_ = EOMONTH(EndDate_, - NumberOfMonths_)

//Determines the first month of the period by using the ‘StartDate_’ variable
Var FirstMonth_ = CONVERT(FORMAT(StartDate_, "yyyyMM"), INTEGER)

//Sets the selected value for the ‘Date Time Travel’ table, which establishes the data point displayed in the visual.
Var DataPoint_ = SELECTEDVALUE('Date Time Travel'[Year Month ID])

Var Result = IF(
//Evaluates if the data point previously defined above is between the first month and the month selected by the user
                    DataPoint_ >= FirstMonth_ && DataPoint_ <= SelectedMonth_,
//If so, the calculation is applied by removing any filters on the 'Date' table and selecting the specific 'Year Month ID' defined by the 'DataPoint_' variable
                    CALCULATE(
                                SELECTEDMEASURE(),
                                REMOVEFILTERS('Date'),
                                'Date'[Year Month ID] = DataPoint_,
                                'Date'[Date] <= EndDate_
                            ),
//Otherwise, a blank value is returned
                    BLANK()
                )

RETURN Result
This DAX logic ensures that the selected measure returns data only for the months within a six-month window relative to the selected date.
Note: You can adjust the number of months displayed by modifying the NumberOfMonths variable (e.g.: VAR NumberOfMonths_ = 12).
Step 3: Build the Visual
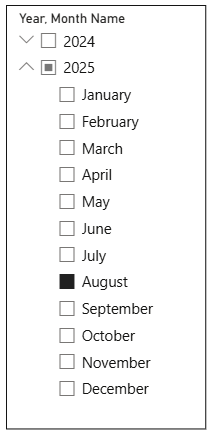
1. Add a slicer to your report and include the Year and Month Name columns from the Date table, as follows:
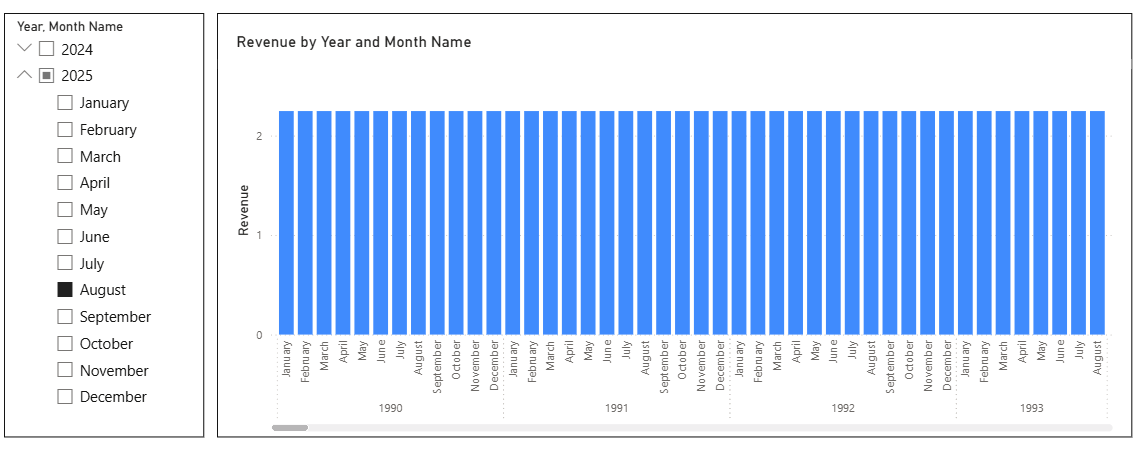
2. Add a visual to your report, for example, a column chart.
3. Set the Year and Month Name columns from the Date Time Travel table as the X-axis.
4. Place your chosen measure (e.g., Revenue, Units Sold, etc.) on the Y-axis. At this point, your page should look like this:
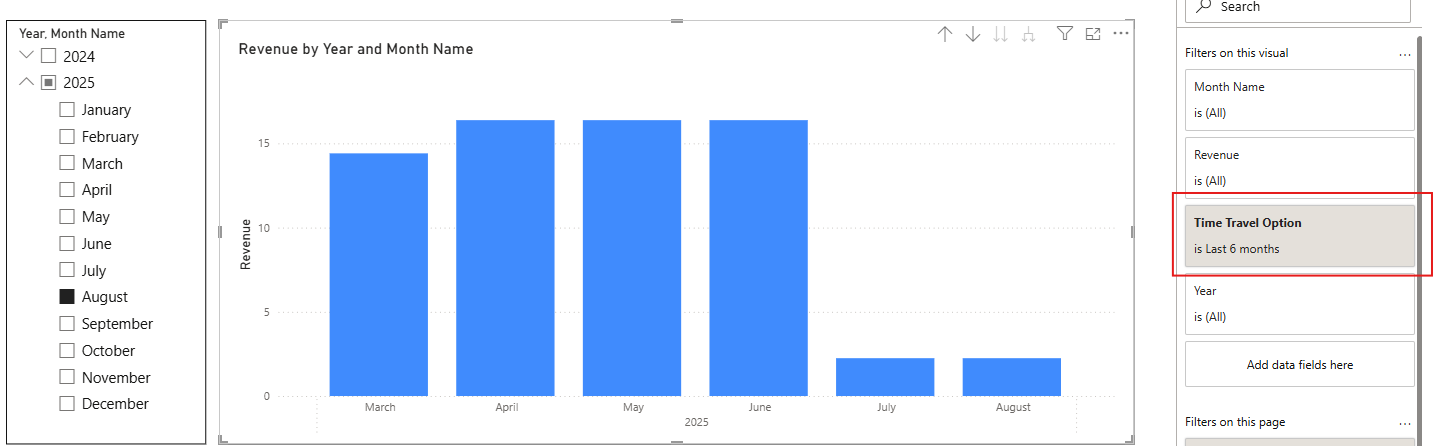
5. Apply a visual-level filter using the Time Travel Option column and select Last 6 months. This will create the dynamic view we want:
Key Benefits of This Approach
- The solution is RLS-safe: no dependency on inactive relationships.
- It adjusts dynamically based on the user’s selection in the main Date slicer.
- It provides a centralised design, controlling everything from the Calculation Group and a slicer, without scattered logic.
- It supports extensibility: you can easily add more calculation items (Last 12 Months, Last 4 Years, etc.) by replicating the logic with adjusted time frames.
- By using the Calculation Group, this solution becomes reusable, as the same logic can be applied to any existing measure without duplication.
Conclusions
If your model uses RLS, or if you simply want a more stable and flexible way to display historical metrics, this approach offers a solid alternative to the USERELATIONSHIP DAX function. By combining a disconnected date table with Calculation Groups, you can deliver powerful, user-driven time-travel analysis in Power BI, without the usual limitations.
You can take this even further by integrating dynamic slicers to let users choose the number of months or years to view, unlocking even more opportunities for customised time intelligence in your reports.
Here at ClearPeaks, we have years of experience guiding customers along their data journeys. If you’d like to see this solution in action or explore these and other Power BI applications, reach out to us today!