03 Dic 2025 Building an AI-Ready Semantic Layer with Snowflake Semantic Views
As more and more companies move towards AI-driven analytics, the semantic layer is no longer optional; it has become essential for delivering reliable, business-focused insights. With the introduction of Snowflake Cortex Analyst, data teams are now building semantic models not only for BI dashboards but also for LLM-based interactions, where natural language questions need to be turned into accurate SQL and business logic.
This change calls for a fresh approach to data modelling. Traditional models made for reporting tools often expose too many technical structures, inconsistent metrics, and names that only make sense to developers. Whilst a BI analyst can still manage these problems, an LLM can easily misunderstand them, which can lead to wrong answers and a lack of trust in the AI output.
A good semantic view helps to make data clear, structured, and easy to understand from a business point of view. It allows Cortex Analyst to:
- Understand business entities, metrics, and relationships
- Generate the right SQL for natural language questions
- Apply consistent business logic across different use cases
- Reduce confusion when interpreting data
Now we’ll go through the key considerations to bear in mind when designing a semantic layer using Snowflake’s Semantic Views, the declarative framework inside Cortex Analyst that defines how data is organised, connected, and exposed to AI agents.
Snowflake Semantic Views
Snowflake Semantic Views are YAML-based objects that describe how data inside Snowflake should be understood, connected, and queried by both people and AI systems. Rather than focusing solely on physical tables or SQL joins, a semantic view captures the business meaning of the data: which entities exist, how they relate to one another, and what metrics or rules apply.
Each semantic view works as a logical layer on top of your Snowflake data, presenting business-friendly objects like Customer, Order, Product, or Revenue. This layer enables Cortex Analyst to understand natural language questions such as “Show total sales by region last quarter” and to automatically generate the necessary SQL query behind the scenes.
A Snowflake Semantic View usually includes:
- Logical Tables – the main business objects.
- Dimensions and Time Dimensions – descriptive attributes and time-based details.
- Facts and Metrics – numerical values and reusable KPIs.
- Relationships – the connections between entities.
- Custom Instructions and Verified Queries – special business rules and validation examples.
Integration with BI Tools
One of biggest advantages of Snowflake Semantic Views is that you can use the same semantic layer for both AI agents like Cortex Analyst as well as BI tools.
This is a significant benefit as it removes the need to maintain separate logic, different KPI definitions, or multiple metadata layers. Everything is defined once – entities, metrics, dimensions, and business rules – and both AI and BI systems consume the same definitions.
Today, external partners like Sigma, Hex, and Omni can already read and query Semantic Views directly, and it seems more than probable that the number of partners supporting this feature will continue to grow.
Integration with Data Governance and Data Catalog Tools
Another interesting area for Semantic Views is their potential integration with Data Governance and Data Catalog tools.
Because Semantic Views store business definitions, descriptions, synonyms, and relationships in a structured YAML format, they can act as a reliable source for governance platforms, making it easier to share metadata, align business terms, and maintain data consistency across the company.
As the Snowflake ecosystem grows, it is very likely that more governance and cataloguing solutions will add native support for Semantic Views. This will give organisations better control over business logic and ensure that both AI and BI follow the same semantic definitions.
Integration with CI/CD Tools
A good practice when working with Snowflake Semantic Views is to manage the YAML files through a version control system like Git.
This allows teams to track changes, review updates and store a clear history of how the semantic layer evolves over time. It also supports collaboration and reduces the risk of inconsistent definitions.
To track this history, you can connect the semantic view to a CI/CD process. For example, pipelines can automatically validate the YAML file, run tests, check for file changes, or deploy updates to development, staging or production environments.
Using pipelines gives greater control over the release process and helps to prevent manual errors. Following these practices makes the semantic layer more stable, better organised, and easier to manage consistently across the whole data platform.
Semantic Views Foundations in Snowflake Cortex Analyst
Instead of showing physical tables directly, you define Logical Tables that represent business concepts and their relationships; these logical objects create a common language for both users and AI.
- Logical Tables: A Logical Table represents a business entity that comes from a single physical table or view. Examples: Customer, Order, Product, Sales.
- Dimensions: Dimensions hold descriptive details that give context to the data. They help the AI and users to understand the meaning behind the numbers. Each dimension should have a clear name, a short description, and optionally a set of synonyms to support natural language queries. Examples: Customer_Name, Region, Product_Category.
- Time Dimensions: Time is crucial because most business questions involve a time frame. Examples: Order_Date, Shipped_Date.
- Facts: Facts show measurable business events that can be added, counted, or averaged. Examples: Sales_Amount, Quantity, Number_Of_Orders.
- Metrics: Metrics are built from facts and define reusable business KPIs. You create them once and use them consistently everywhere, helping to prevent calculation discrepancies across teams. Examples:
- Total_Sales = SUM(Sales_Amount).
- Average_Order_Value = SUM(Sales_Amount) / COUNT(DISTINCT Order_ID).
- Filters: Filters let you slice the data in a business-friendly way, like “Active Customers” or “Premium Products”, making natural language queries more intuitive.
- Relationships: Clear relationships between logical tables show Cortex Analyst how entities connect, preventing incorrect joins or assumptions. Example: A Sale belongs to one Customer.
Recommended Data Modelling Approaches for AI
Now that we’ve grasped the semantic view basics, the next step is to choose the right data model structure to support the AI agent in Cortex Analyst. In practice, the way data is organised, how entities are related, and how facts connect to dimensions, has a direct impact on how effectively Cortex Analyst can understand, query, and explain business logic through natural language.
Cortex Analyst works best with two classic modelling approaches: Star Schema and Snowflake Schema.
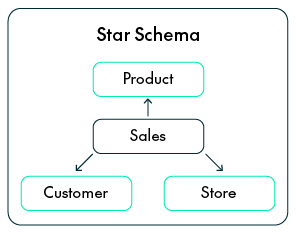
Star Schema
In a Star Schema, a central Fact Table connects directly to several Dimension Tables. Each dimension provides descriptive context to the Fact, helping to explain the who, what, when and where.
Advantages:
- Simple for AI reasoning: With clear, one-step joins, Cortex Analyst can easily create SQL from natural language without dealing with complex relationships.
- Faster queries: Because the Dimension Tables are denormalised, there are fewer joins, improving query performance.
- Easy for business users: Each Dimension clearly represents a real business concept like Customer, Product, Store, or Time.
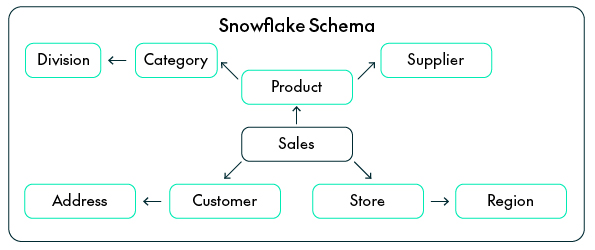
Snowflake Schema
The Snowflake Schema is an extension of the star model that normalises some of its Dimensions into smaller sub-dimensions. For example, a Product Dimension might connect to separate Category and Supplier tables.
Advantages:
- Keeps logical hierarchies: Snowflake schemas reflect real-world structures (like Category → Subcategory → Product), which helps Cortex Analyst to understand relationships more naturally.
- Less redundancy: Normalising data keeps attributes consistent when they appear across different models or business areas.
- Easier maintenance: If something changes, for example, a region moves to a new division, you only need to update it in one place.
Use the Snowflake Schema when your data environment is big and shared across several domains.
How to build an AI-ready Semantic Model
The next step is to translate your business logic into the semantic layer used by Cortex Analyst.
This is where you define how the AI understands your business: the main entities, how they are connected, and what every number or attribute really means.
Define Clear Business Entities
Every semantic view starts by identifying the main business concepts that describe how the company works, the Logical Tables. Each table should represent a real entity, like Customer, Order, Product, Store, or Employee.
The idea is to move away from technical database names and instead to use names that reflect business meaning. Try to avoid generic or system-generated names such as T_CUST_01 or SALES_TBL. Logical tables can come from either physical tables or database views; what matters most is that they describe what the business sees, not how the data is stored. LLMs and natural language query tools reason using business concepts, not technical structures. Having clear entities like “Customer” or “Product” helps Cortex Analyst to turn human questions into the right SQL without ambiguity.
import lazy_loader as lazy
name: ELECTRONIC_SHOP_SM
tables:
  - name: CUSTOMER
    base_table:
    database: ELECTRONIC_SHOP
    schema: PUBLIC
    table: VM_CUSTOMER
  - name: PRODUCT
    base_table:
    database: ELECTRONIC_SHOP
    schema: PUBLIC
    table: VM_PRODUCT
  - name: STORE
    base_table:
    database: ELECTRONIC_SHOP
    schema: PUBLIC
    table: VM_STORE
  - name: SALES
    base_table:
    database: ELECTRONIC_SHOP
    schema: PUBLIC
    table: VM_SALES
Standardise Business Keys
Every entity needs a unique and consistent identifier. Across all related tables, this identifier should always have the same name and format. For example, if CUSTOMER_ID identifies a customer in one table, it should be written exactly the same in all other tables, not as CUST_ID or CUSTOMERKEY. This consistency ensures that joins and relationships work properly and stops the AI from thinking that different identifiers belong to different entities.
Cortex Analyst creates its query logic using the relationships you define; if identifiers are inconsistent, the AI might generate incorrect joins or return incomplete results.
import lazy_loader as lazy

name: ELECTRONIC_SHOP_SM
tables:
  - name: CUSTOMER
    base_table:
      database: ELECTRONIC_SHOP
      schema: PUBLIC
      table: VM_CUSTOMER
    primary_key:
      columns:
        - Customer_ID
  - name: PRODUCT
    base_table:
      database: ELECTRONIC_SHOP
      schema: PUBLIC
      table: VM_PRODUCT
    primary_key:
      columns:
        - Product_ID
  - name: STORE
    base_table:
      database: ELECTRONIC_SHOP
      schema: PUBLIC
      table: VM_STORE
    primary_key:
      columns:
        - Store_ID
  - name: SALES
    base_table:
      database: ELECTRONIC_SHOP
      schema: PUBLIC
      table: VM_SALES
    primary_key:
      columns:
        - Sales_ID
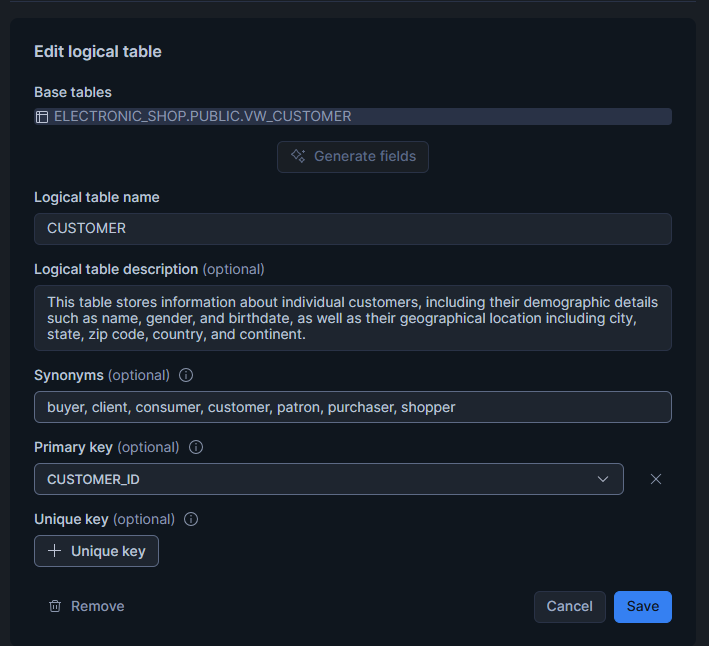
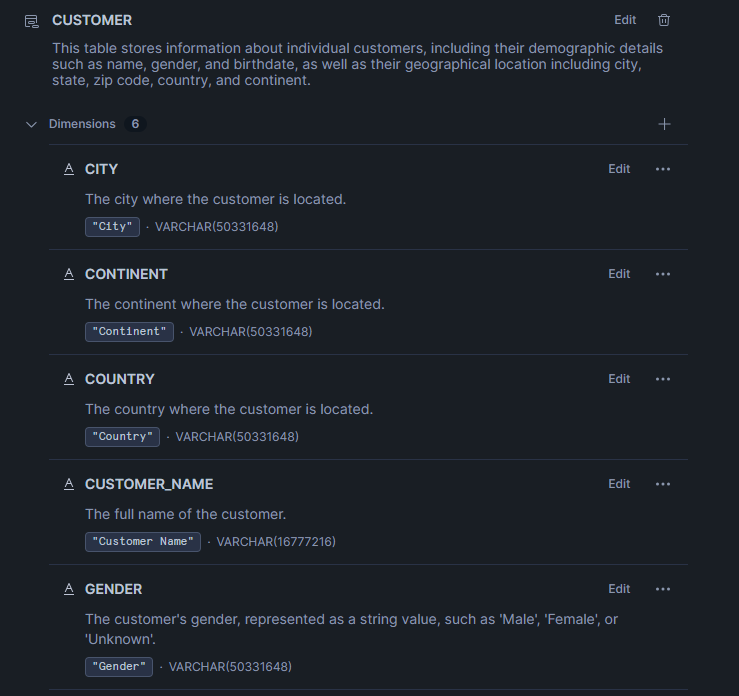
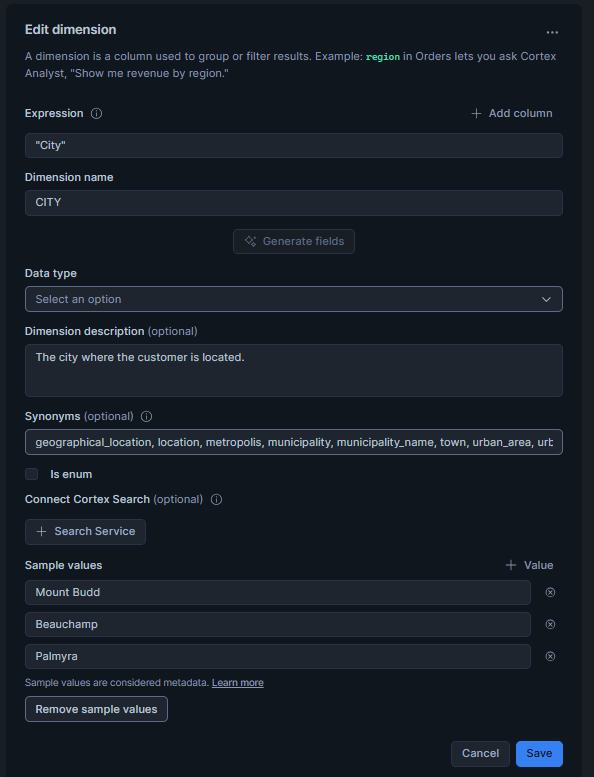
Design Business-Friendly Dimensions
Dimensions give descriptive context to the facts; they help both the AI and business users to understand the who, what, where, and how behind each measure. Attributes inside a dimension should have clear, readable names and consistent formatting.
In addition, you should add synonyms that reflect how business users naturally refer to each concept. Descriptions should explain the meaning, not the technical details, so instead of using cryptic column names like CUST_SEG_CD, use something much more descriptive, like Customer_Segment.
import lazy_loader as lazy

name: ELECTRONIC_SHOP_SM
table:
  name: CUSTOMER
  synonyms:
    - client
    - customer
    - parent
    - buyer
    - purchaser
    - customer
  description: "This table stores information about individual customers, including their demographic details such as name, gender, and birthdate, as well as their geographical location including city, state, zip code, country, and continent."
  base_table:
    database: ELECTRONIC_SHOP
    schema: PUBLIC
    table: WALCUSTOMER
  dimension:
    - name: City
      synonyms:
        - town
        - municipality
        - metropolitan area
        - urban area
        - location
        - municipality_name
        - geographical_location
        - urban_center
      description: "The city where the customer is located."
      expr: "City"
      data_type: VARCHAR(16777216)
    - name: Continent
      synonyms:
        - region
        - geographical_area
        - luminous
        - geographical_region
        - area
        - territory
      description: "The continent where the customer is located."
      expr: "Continent"
      data_type: VARCHAR(16777216)
    - name: Country
      synonyms:
        - nation
        - land
        - territory
        - state
        - region
        - area
        - locale
        - nationality
      description: "The country where the customer is located."
      expr: "Country"
      data_type: VARCHAR(16777216)
    - name: Customer_name
      synonyms:
        - customer
        - Client
        - Parent
        - buyer
        - purchaser
        - consumer
        - client
        - Account_holder
        - client_name
        - Full_name
      description: "The full name of the customer."
      expr: "Customer Name."
      data_type: VARCHAR(16777216)
    - name: Gender
      synonyms:
        - sex
        - male_female
        - demographic
        - biological_sex
        - sex_category
      description: "The customer's gender, represented as a string value, such as 'Male', 'Female', or 'Unknown'."
      expr: "Gender"
      data_type: VARCHAR(16777216)
    - name: State
      synonyms:
        - Province
        - Region
        - Territory
        - Area
        - jurisdiction
        - Local
        - location
        - location
        - north
        - Perish
      description: "The state or province where the customer resides."
      expr: "State"
      data_type: VARCHAR(16777216)
  primary_key:
    column: customer_ID
Design Time Dimensions
Time dimensions tell us when events happen, which is essential for identifying trends, analysing growth, and comparing periods.
Every fact table should link to a time attribute, such as Order_Date, Invoice_Date, or Delivery_Date. Make sure that date formats stay consistent (for example, YYYY-MM-DD) and that different types of date are clearly separate, like order dates versus shipment dates.
import lazy_loader as lazy

time_dimensions:
  - name: Delivery_Date
    synonyms:
      - Shipment_Date
      - Dispatch_Date
      - Delivery_Schedule
      - Expected_Delivery
      - Ship_Date
      - Estimated_Arrival_Date
      - Delivery_Scheduled_Date
    description: "The date on which the sales order was delivered to the customer."
    expr: "Delivery Date"
    data_type: DATE
  - name: Order_Date
    synonyms:
      - order_timestamp
      - purchase_date
      - transaction_date
      - sale_date
      - date_ordered
    description: "The date on which the sales order was placed."
    expr: "Order Date"
    data_type: DATE
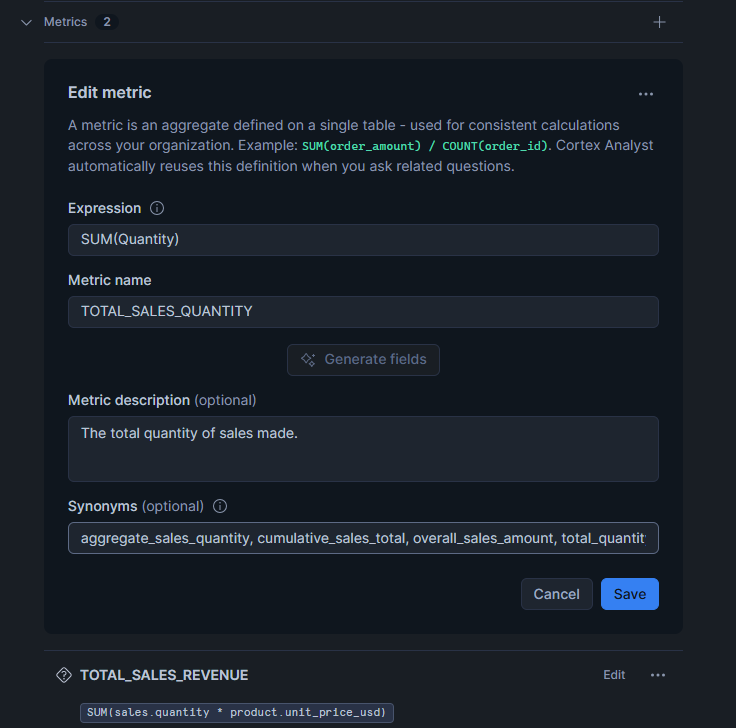
Define Facts and Reusable Metrics
Facts represent measurable business events and form the numerical backbone of your semantic view. Each fact must be clearly defined with its business context (for example, sales amount, units sold, or discount applied). From these facts, you can build metrics that represent key business KPIs, like Total Sales or Average Order Value.
These metrics should be defined once and reused across all analyses to keep aggregation logic consistent.
import lazy_loader as lazy

facts:
  - name: Product_ID
    expr: "Product_ID"
    data_type: NUMBER(38,0)
  - name: Unit_Cost_USD
    synonyms:
      - unit_cost
      - cost_per_unit
      - unit_expense
      - unit_expenditure
      - cost_per_item
      - item_cost
      - unit_price_cost
      - expense_per_unit
    description: "The cost of the product in US dollars per unit."
    expr: "Unit Cost USD"
    data_type: NUMBER(38,2)
  - name: Unit_Price_USD
    synonyms:
      - unit_price
      - price_per_unit
      - usd_price
      - unit_selling_price
      - unit_revenue
      - unit_sale_price
      - price_per_item
    description: "The price of the product in US dollars, rounded to two decimal places."
    expr: "Unit Price USD"
    data_type: NUMBER(38,2)
  - name: Unit_Profit
    synonyms:
      - gross_profit
      - profit_per_unit
      - unit_margin
      - net_gain
      - earnings_per_unit
      - profit_per_item
    description: "The profit earned from the sale of one unit of a product, calculated as the difference between the selling price and the cost of the product, expressed in a monetary value with two decimal places."
    expr: "Unit Profit"
    data_type: NUMBER(38,2)

metrics:
  - name: TOTAL_SALES_QUANTITY
    synonyms:
      - total_sales_volume
      - overall_sales_amount
      - aggregate_sales_quantity
      - total_quantity_sold
      - cumulative_sales_total
    description: "The total quantity of sales made."
    expr: SUM(Quantity)
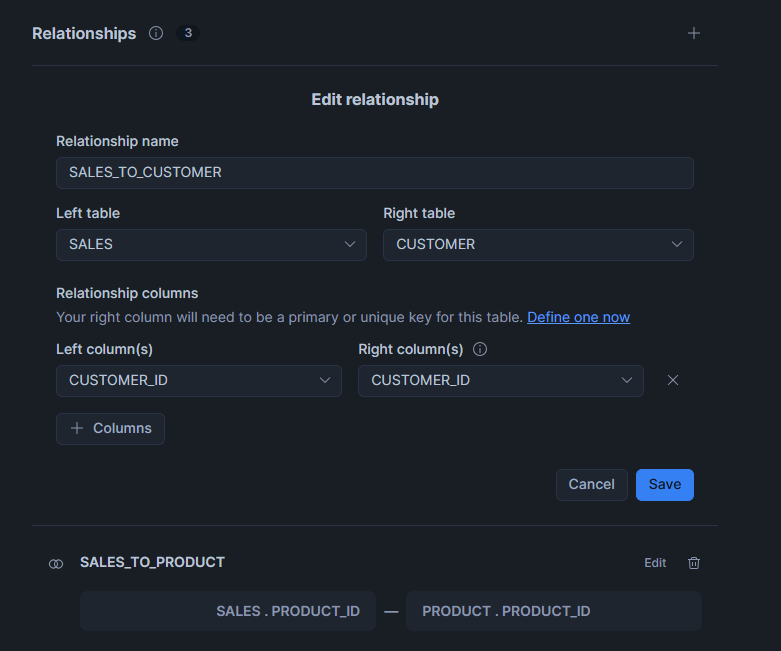
Define Relationships
Relationships describe how entities are logically connected: for example, each sale belongs to one customer and relates to one product.
When these links are properly defined, Cortex Analyst can create the right joins automatically. It’s best practice to avoid hidden or implicit relationships so that all connections are transparent.
import lazy_loader as lazy

relationships:
  - name: SALES_TO_CUSTOMER
    left_table: SALES
    relationship_columns:
      - left_column: Customer_ID
        right_column: Customer_ID
    right_table: CUSTOMER
  - name: SALES_TO_PRODUCT
    left_table: SALES
    relationship_columns:
      - left_column: Product_ID
        right_column: Product_ID
    right_table: PRODUCT
  - name: SALES_TO_STORE
    left_table: SALES
    relationship_columns:
      - left_column: Store_ID
        right_column: Store_ID
    right_table: STORE
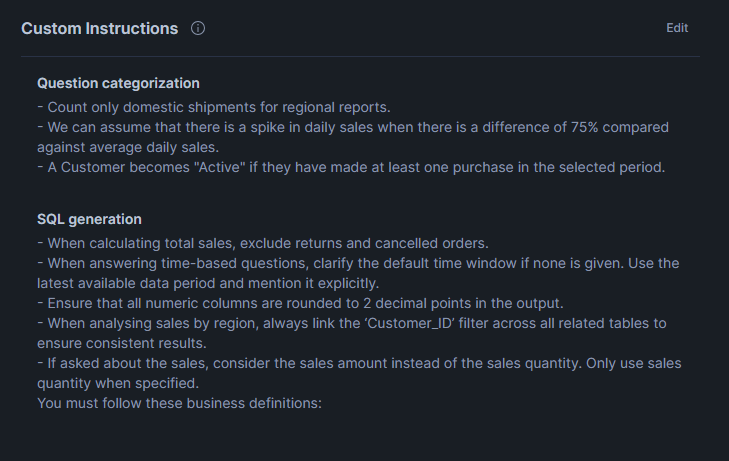
Define Custom Instructions
Custom Instructions work as business logic guides for the AI tool, helping Cortex Analyst to understand special situations, adjust calculations, or format results according to company rules.
You can use them to apply business constraints, default filters, or conditional logic that doesn’t exist directly in the raw data. For example, you might want the AI to automatically exclude cancelled orders or always display revenue in USD.
By including this kind of business behaviour inside the semantic view, you reduce ambiguity for the AI, guaranteeing consistent query results across the organisation.
import lazy_loader as lazy

module_custom_instructions:
  sql_generation: |-
    - When calculating total sales, exclude returns and cancelled orders.
    - When answering time-based questions, clarify the default time window if none is given. Use the latest available data period and mention it explicitly.
    - Ensure that all numeric columns are rounded to 2 decimal points in the output.
    - When analysing sales by region, always link the ‘Customer_ID’ filter across all related tables to ensure consistent results.
    - If asked about the sales, consider the sales amount instead of the sales quantity. Only use sales quantity when specified.
    You must follow these business definitions:
  question_categorization: |-
    - Count only domestic shipments for regional reports.
    - We can assume that there is a spike in daily sales when there is a difference of 75% compared against average daily sales.
    - A Customer becomes "Active" if they have made at least one purchase in the selected period.
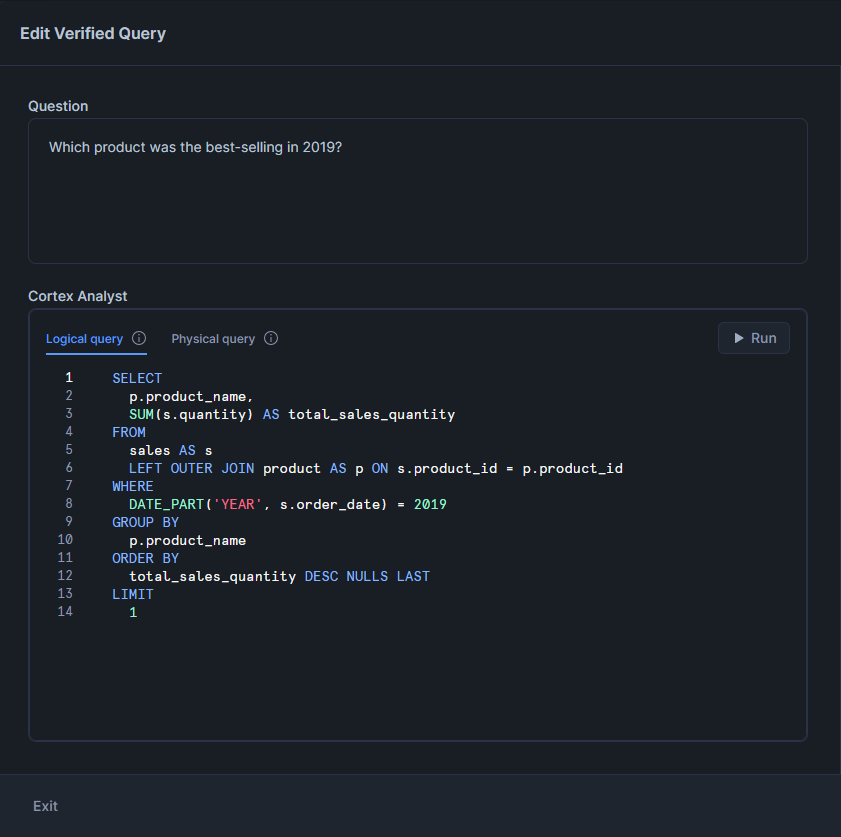
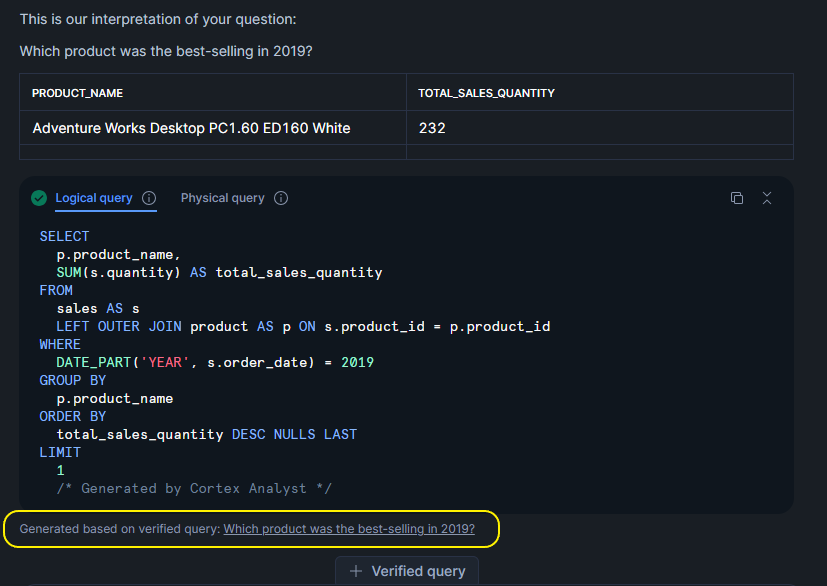
Verified Queries
Verified Queries are curated examples that help to confirm that the semantic view is working correctly. Each verified query links a natural-language question to the SQL that should be generated for it. Verified Queries are valuable for testing, maintaining accuracy after schema changes, and documenting the business logic behind the data.
Creating a Verified Query Repository (VQR) allows data teams to check that Cortex Analyst always returns correct results, strengthening trust between data teams and business stakeholders.
import lazy_loader as lazy

verified_queries:
  - name: Which product was the best-selling in 2019?
    question: Which product was the best-selling in 2019?
    sql: |-
      SELECT
        p.product_name,
        SUM(s.quantity) AS total_sales_quantity
      FROM
        sales AS s
        LEFT OUTER JOIN product AS p ON s.product_id = p.product_id
      WHERE
        DATE_PART('YEAR', s.order_date) = 2019
      GROUP BY
        p.product_name
      ORDER BY
        total_sales_quantity DESC NULLS LAST
      LIMIT
        1
    use_as_onboarding_question: true
    verified_by: Ruben Garcia
    verified_at: 1756725638
  - name: How many unique customers made at least one purchase in 2020?
    question: How many unique customers made at least one purchase in 2020?
    sql: |-
      SELECT
        COUNT(DISTINCT s.customer_id) AS unique_customers
      FROM
        sales AS s
      WHERE
        DATE_PART('YEAR', s.order_date) = 2020
    use_as_onboarding_question: false
    verified_by: Ruben Garcia
    verified_at: 1756725629
Business Value and Conclusions
A well-structured semantic layer built with Snowflake Semantic Views provides a stable, predictable base for AI-generated analytics in Cortex Analyst. By defining clear logical entities, consistent primary keys, and explicit relationships, the semantic layer removes the ambiguity that often exists in raw warehouse schemas. This helps Cortex Analyst to choose the correct join paths and to generate SQL that follows the intended data model.
Adding descriptions and synonyms to the semantic view is equally important. Descriptions clarify the real meaning of each field, whilst synonyms make it easier for the AI to recognise the different terms users might employ to describe the same concept. Together, this metadata improves natural language understanding and reduces confusion during query generation.
Another important advantage is centralising metrics and calculation logic inside the semantic view. With KPIs defined in a single place, Cortex Analyst isn’t forced to infer formulas or rely on assumptions. This prevents issues like inconsistent aggregations, different calculation methods across teams, or errors caused by manually written expressions.
Time dimensions and standardised date fields also play a key role, helping the AI to understand valid time filters and to compare different time periods without manual adjustments. This makes operations like YTD, QTD or MoM easier for the system to process.
Custom Instructions give teams more control over how the AI interprets special cases or domain-specific rules. They act as guidance for the reasoning engine, ensuring that filters, formatting, and business constraints are applied consistently.
In summary, a well-designed Snowflake Semantic View simplifies governance, reduces technical risks, and helps Cortex Analyst to translate natural-language questions into reliable SQL. As data models grow and evolve, the semantic layer becomes one of the most important parts of the system for maintaining accuracy and consistency in AI-driven analytics.
If you’d like to explore how Snowflake Semantic Views and Cortex Analyst can help you to build an AI-ready semantic layer for your organisation, our expert team can support you from architecture design through to implementation and governance. Get in touch with us today to discuss your use case and see how we can help you to accelerate the delivery of reliable, business-focused analytics.