16 Feb 2017 DATA QUALITY WITH EDQ – PART 1: DATA PROFILING
 This is the second article in our blog series about Data Quality. In the first part of the series we introduced the main concepts of Data Quality. The focus of this article is to introduce Data Profiling with EDQ.
Introduction
Enterprise Data Quality (EDQ) is Oracle’s total solution for data governance and data quality management. It is part of the Oracle Fusion Middleware product range and the current version, 12.2.1.2, can be downloaded here.
There is a virtual machine for testing EDQ with a sample dataset, available for download too at the following link. You can also find extensive documentation on the Oracle webpage – go to the following links for documentation and more resources. Oracle EDQ can be used to profile, audit, standardize, normalize, and deduplicate our data. The list below summarizes the key features of EDQ:
| • | Integrated data profiling, auditing, cleansing and matching |
| • | Browser-based access to the different client applications used to operate and configure the product |
| • | Ability to handle all types of data |
| • | Connection to files (text, XML, Office) and any JDBC and ODBC compliant data sources and targets |
| • | Multi-user project support |
| • | SOA support to create processes that may be exposed to external applications as a service |
| • | A single repository to hold data, gathered statistics, and project tracking information |
| • | Fully extensible architecture allowing the insertion of any required custom processing |
EDQ is fully extensible, offering extensions for Address Verification and Watchlist Screening, for example, and can be integrated as batch processing or as real-time processing with other integration tools. In this article we will review the basic profiling capabilities of EDQ and explain how we can profile our data using EDQ in just a few steps.
1. Data Profiling
The first step in a data quality project is profiling the data. Data profiling is the analysis of data to clarify its structure, content, relationships and derivation rules. Profiling helps not only to understand anomalies and to assess data quality, but also to discover, register, and assess enterprise metadata, and so the purpose of data profiling is both to validate metadata when it is available and to discover metadata when it is not. EDQ comes with several built-in transformations to profile our data quickly and to start discovering patterns and quality issues. Some of the most important transformations for profiling are:
Quickstats profiler:
Analyses high-level completeness, duplication, and value frequency across many attributes, and highlights possible issues. For example, we could use this transformation to identify duplicate values in columns that should contain unique values, or columns with more unique values than expected.
 |
Figure 1: Example of the results of the Quickstats profiler in EDQ. We can start discovering issues in the data using this transformation, for example, fields with null values, or with more unique values than expected. |
Data types profiler:
Analyses attribute values for their data types, and assesses data type consistency. In the example below, we can see that some columns have inconsistent data types, and we can clearly identify wrong values (the Street column has 1 numeric value and the rest text, the Cell column has 6 Date/time values, the Active columns have 15 numeric values, etc.).
 |
Figure 2: Example of the results of the Data types profiler in EDQ. This transformation is very useful to find data type consistency issues. |
Max/Min profiler:
Finds minimum and maximum values – longest, shortest, lowest, and highest.
 |
Figure 3: Example of the results of the Max/Min profiler in EDQ. One of the basic profiles that we can do on our data is an analysis of the maximum and minimum values of each field to find wrong values. |
Frequency profiler:
Analyses value frequency across many attributes. In the image below, we can see how this transformation can be used to rapidly identify consistency problems in the values of the data.
 |
Figure 4: Example of the results of the Frequency profiler in EDQ. We can already see data quality. |
Patterns profiler:
Analyses character patterns and pattern frequency across many attributes.
 |
Figure 5: Example of the results of the Patterns profiler in EDQ, very useful to find data quality issues in fields such as zip codes, telephone numbers, or email addresses. |
Record completeness profiler:
Analyses records for their completeness across many attributes.
 |
Figure 6: Example of the results of the Record completeness profiler in EDQ. |
Other profiling transformations include, but are not limited to, number profiler, character profiler, date profiler, and RegEx patterns profiler.
2. Data Profiling with Oracle EDQ
EDQ developments are called projects, which contain processes that run processors (transformations). There is also the possibility to include processors in jobs, to make them accessible to external applications. All these developments are created using the Director application, accessible from the EDQ Launchpad on the EDQ server:
 |
Figure 7: The EDQ Launchpad. All the client applications are accesible from this page. |
The Director is a Java application, and is the main application for the operation of EDQ.
It is divided into five different panes:
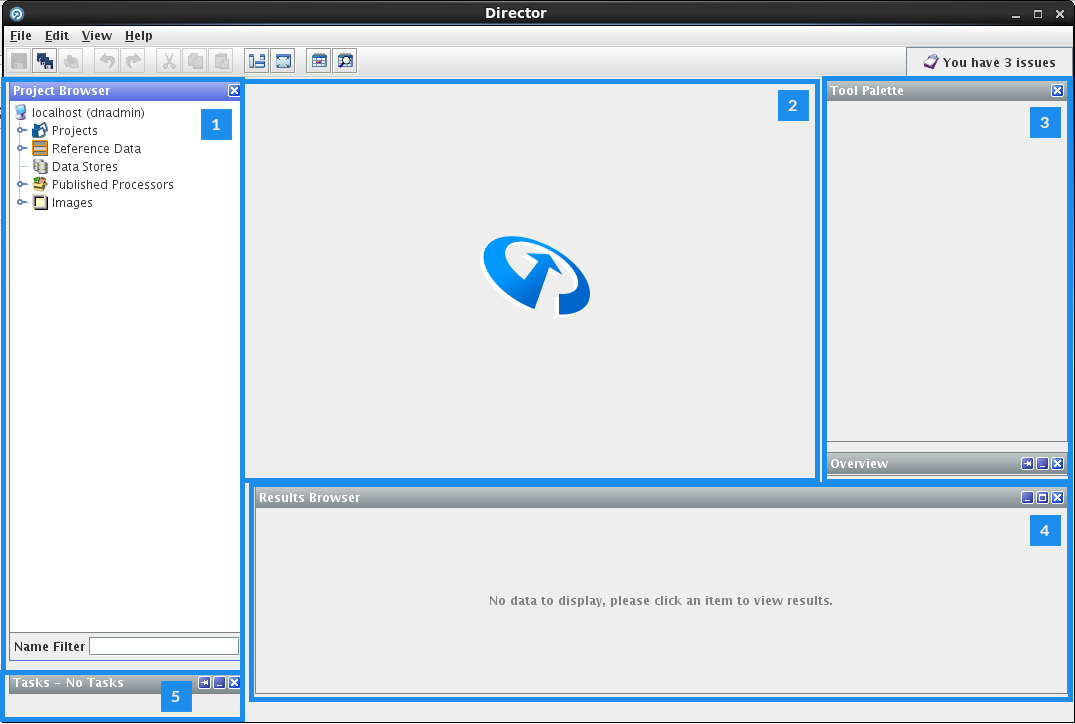 |
Figure 8: The Director client application, the main application for developing in EDQ. |
The projects and processors, together with the data stores, staged data, reference datasets, and other files, will be shown in the Project Browser pane
(1). The main section of the application is the Project Canvas
(2), where the different processes and jobs are built. The Tool Palette
(3) will show the different tools available for use in different data quality processes and jobs. The Results Browser
(4) will show the results of the processor selected on the canvas. Finally, the Tasks window in the bottom left corner
(5) shows the progress of the execution of the processes as they are running. To start profiling our data, the first thing we need to do is create a new project in the Director:
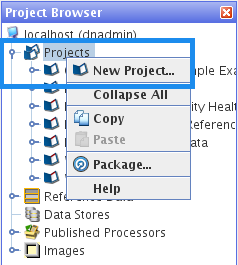 |
Figure 9: Creating a project in EDQ. |
Then we need to add a data store to connect to:
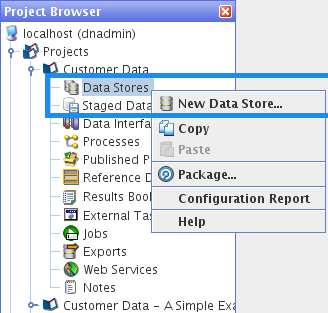 |
Figure 10: Creating a new data store in EDQ. |
Once we have a valid data store we can connect to, we have to create a snapshot of the desired tables in the data store. All the processing done in EDQ will be done on this snapshot, so the original data source will remain unchanged.
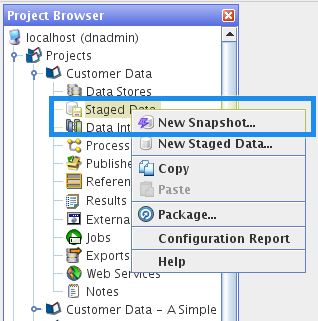 |
Figure 11: Creating a data snapshot in EDQ. |
Finally, we need to create the process that will contain all the profiling transformations or processors:
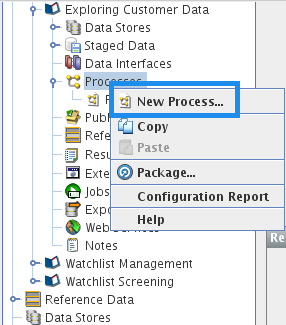 |
Figure 12: Creating a process in EDQ. |
After selecting our created snapshot, we can select the processors that we need on the next screen of the New Process window, checking the box ‘Add Profiling’, or we can leave it un-checked and manually drag and drop the processors one by one to the process canvas from the tool palette.
 |
Figure 13: A simple data profiling process, containing the Reader processor and six profiling processors. |
If we add the processors to the process manually, we will have to connect the output of the reader transformation to the input of the profiling transformations.
To run the process, we simply need to save it then click on the run icon:
 |
Figure 14: Executing a process in EDQ. |
The execution progress will be shown in the Tasks window, and once all the processors have finished the results of each individual transformation will be shown in the Results Browser. All these results can be exported to Excel using the buttons above the results in the Results Browser.
3. Creating Issues
A lot of common problems that could jeopardize the quality of BI or Analytics solutions can be identified with data profiling. EDQ includes features to create a collaborative environment between the different users involved in the data governance processes. For example, we can create issues and assign them to DBAs, application developers, ETL developers, BI developers, and business owners as they are found. To do this, simply right-click on any value that might indicate a data quality issue in the Results Browser, and select Create Issue.
 |
Figure 15: Creating issues in EDQ. |
The issues can be reviewed via the Issue Management application, accessible from the EDQ Launchpad or from the Director:
 |
Figure 16: Link to the Issue Manager application accessible from the Director in EDQ. The Issue Manager application can also be accessed from the EDQ Launchpad. |
4. Creating Reference Datasets
The data profiling step is useful for creating datasets that can be used later on as reference for data auditing. To do this, simply right-click on the valid values for a given field and select Create Reference Data.
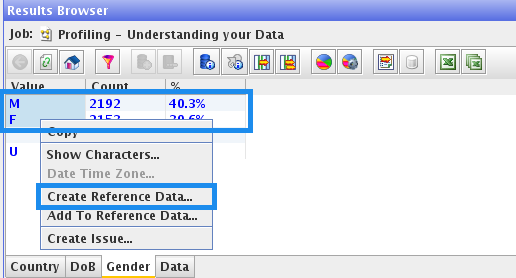 |
Figure 17: Creating reference data in EDQ. |
 |
Figure 18: Reviewing reference data in EDQ. |
We can add extra rows if there are missing values in our data.
After saving, this dataset will be the single source of truth for the field, and it can be used in other processes for auditing the data.
We can also create reference data from patterns instead of from individual values. EDQ also comes with many different types of reference data out-of-the-box, which can speed up the creation of data auditing processes.
5. Data Auditing
There are a number of processors available to audit data, called data checks. The most important ones are:
| ✓ | Data Type Check: checks that a string attribute contains data of the expected data type |
| ✓ | Duplicate Check: checks for records that are duplicated across selected attributes |
| ✓ | Email Check: checks email addresses are in a valid syntactic format |
| ✓ | Invalid Character Check: checks a string attribute for invalid characters |
| ✓ | Pattern Check: checks values for an attribute against reference data of valid and invalid character formats |
| ✓ | No Data Check: checks whether or not values in an attribute contain any meaningful data |
| ✓ | RegEx Check: checks values for a string attribute against reference data of valid and invalid regular expressions |
| ✓ | Business Rules Check: checks data against a set of business rules |
These processors allow the output streams to be divided for valid and invalid records to be handled separately or together as they are audited:
 |
Figure 19: Different streams of data from a data check transformation in EDQ. The records with populated email can be treated separately from the records without email using the different outputs. |
Data can be audited using reference data created by users. For example, the List Check and Pattern Check processors allow specifying reference datasets to determine valid and invalid records:
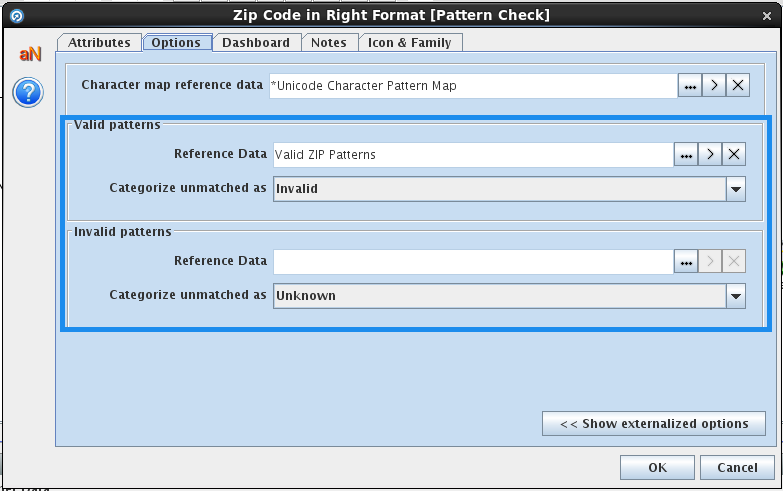 |
Figure 20: Using reference data for auditing in EDQ. |
This way the processors will check if the selected field of each record in the database matches the reference data. We can drill down in the results of these processors to see the matching and un-matching records, and export the records to Excel to share them with DBAs, business users, or other users.
6. Data Profiling with ODI
Oracle Data Integrator comes with some data profiling capabilities, which although not as complete as EDQ, are enough for small projects with basic profiling needs. The table below shows the comparison between the data profiling features included in ODI and the more advanced features of Oracle EDQ:
 |
Figure 21: Data Profiling Feature. |
Conclusion
EDQ offers some great features to profile and audit data in a quick and simple way, and in a collaborative environment to raise issues with other users involved in the data quality assurance process. Tasks that we would normally do manually on the databases can be done with EDQ much faster, speeding up the process of finding quality issues in our data. A good profiling and auditing of our data is the first requisite for a successful quality assurance process, which in turn is a requisite for the success of any Analytics / BI project.
Click here to read the next article in the Oracle EDQ series, in which we explain data standardization and cleansing using EDQ.
Don´t hesitate to contact us if you would like to know more about the Data Quality Services we offer!

