19 Nov 2025 How to Optimise Your Power BI Reports Using Measure Killer
If you’ve worked with Power BI for any length of time, you’ll know how easily models can grow out of control. Reports evolve, requirements change, and new fields or measures are added constantly. The result?
- Bloated models with hundreds of unused columns and measures.
- Slow refreshes that frustrate users and consume resources.
- Messy reports with hidden pages, outdated visuals, or redundant bookmarks.
Cleaning this up manually is often painful and always time-consuming. You need to track dependencies, check whether measures are still in use, identify unused fields, and validate best practices. This can take hours or even days of digging into metadata, DAX expressions, and M code.
This is exactly where Measure Killer comes into play!
What is Measure Killer?
Measure Killer is a third-party optimisation tool for Power BI, designed to scan and analyse both your semantic models and reports. Instead of having to check manually for unused objects, this tool provides a structured, automated view of your model.
Using the free version and focusing on the developer view, you can choose between Single Model and Report and Shared Model on Local Machine (see Figure 1). The first option analyses a single report and its semantic model, whilst the second reviews different reports that share a semantic model. With this second option, make sure to load all affected reports so you can identify every impacted element before deleting or modifying the shared semantic model.
It not only tells you what is used and what is not, but also generates scripts and visual insights that help you to act immediately. For Power BI developers, this means spending less time cleaning up and more time delivering insights.
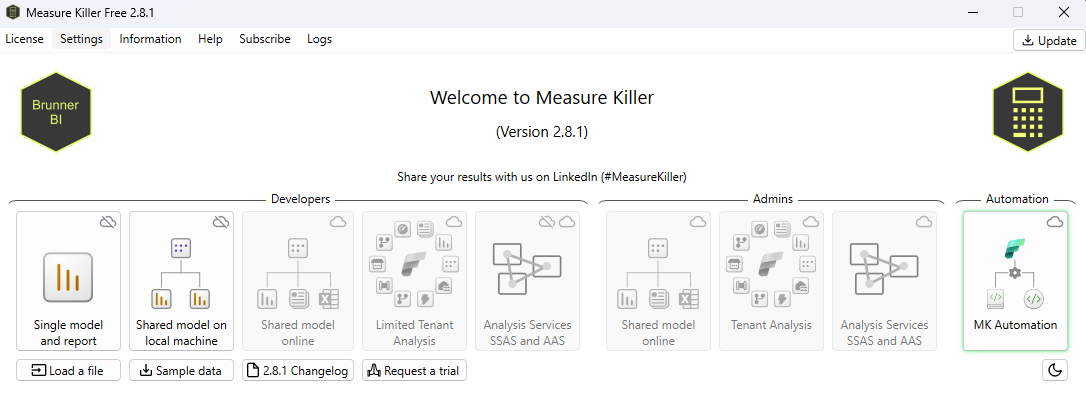
Figure 1. Measure Killer Main Menu View
In this blog post we’re going to focus on the Single model and report option from the free version. After connecting to our report, we’ll execute it and see the following features and its semantic model.
Core Features
These are the features that most Power BI developers (and admins) regularly rely on:
A. Results View
- See all objects in your model: measures, calculated columns, tables, etc.
- Understand status (used, unused, or used by an unused object).
- Track how many times each element is used, helping you to identify critical vs. redundant components.

Figure 2. Results Tab from the Measure Killer Interface
B. Tables View
- Group objects by table.
- See the percentage of used elements per table.
- Identify tables holding large volumes of data where only a portion is actually relevant.

Figure 3. Tables Tab from the Measure Killer Interface
C. Report Results
- List all report pages, including hidden ones.
- Display the number of visuals per page.
- Get visibility into bookmarks and their configurations.

Figure 4. Report Results Tab from the Measure Killer Interface
D. Kill DAX Artifacts and Columns
- Instantly remove DAX objects like unused measures (see Figure 5). You can reverse changes by clicking on the Restore.
- Generate M scripts that you can paste directly into Power Query to reduce the size of your model by removing unused columns (see Figure 6).
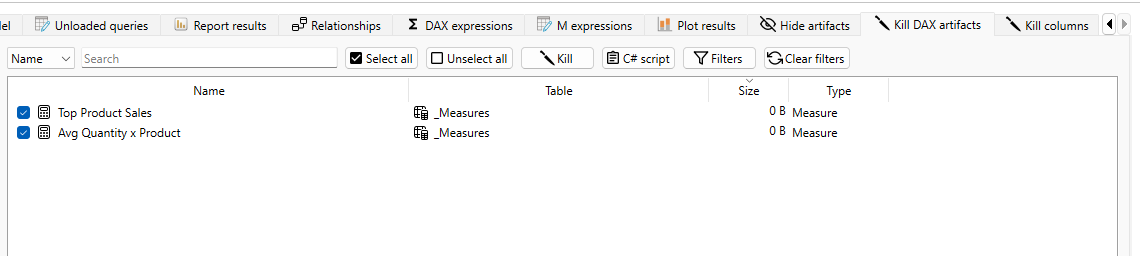
Figure 5. The Kill DAX Artifacts Tab from Measure Killer
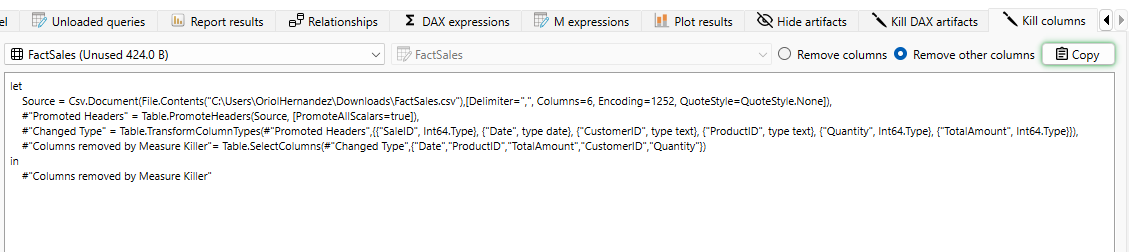
Figure 6. The Kill Columns Tab from Measure Killer
E. Best Practices Analyser
- Evaluate your model against Microsoft best practices for both the model and report:
- Each area includes a default set of rules for analysis. In the Info tab of each section, you can review all available rules, both those currently applied and those not included. To enable or disable any of the optional rules, open the main Measure Killer window and adjust them under Settings.
- Compute a violation score based on the severity assigned to each rule (see Figure 7).
- Maintain consistency and avoid design mistakes that could affect performance.
Model Best Practices
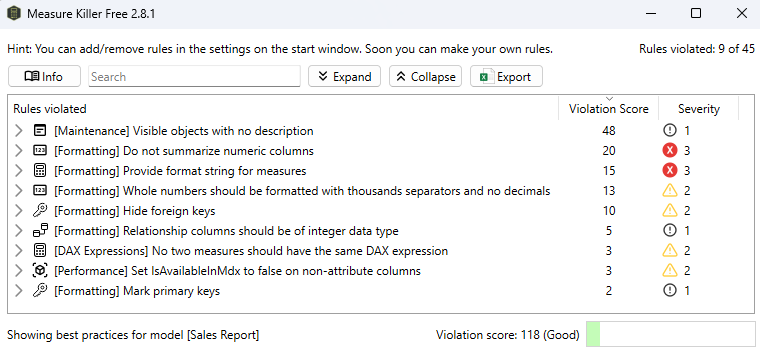
Figure 7. The Model Best Practices Tab from Measure Killer, using all included rules by default
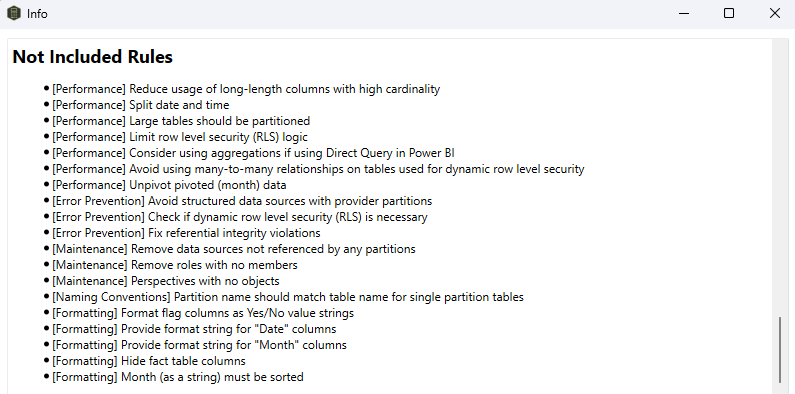
Figure 8. List of rules not included in the Model Best Practices by default
Advanced Features for Power Users
Beyond the essentials, Measure Killer offers more advanced capabilities for better control and deeper insights.
A. DAX & M Expressions Search
Quickly locate, search, and analyse all your DAX measures and Power Query M code in one place, the perfect option for large models with hundreds of objects.
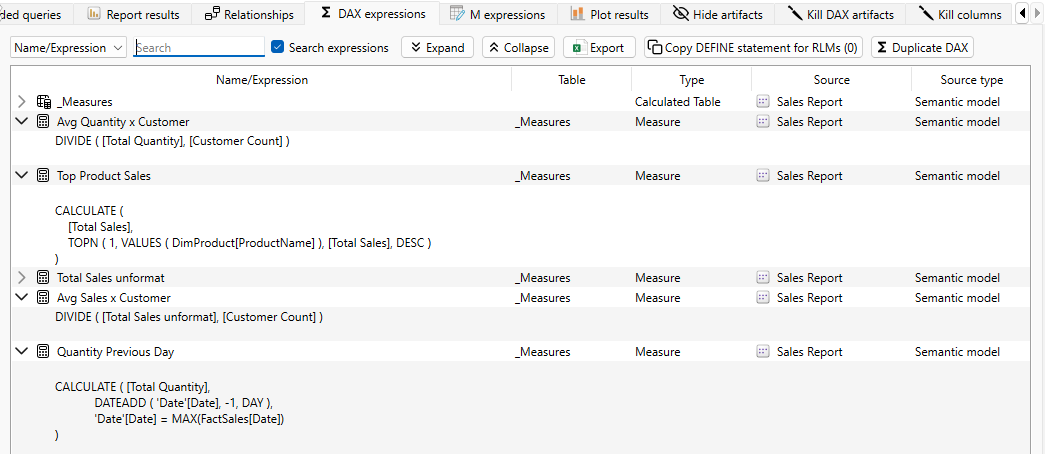
Figure 9. The DAX Expressions Tab from Measure Killer
B. Plot Results
- Visualise your model with bar and line charts.
- Example: See the breakdown of used vs. unused elements by type (see Figure 10).
- Example: Track model size over time to detect sudden spikes and validate optimisations.
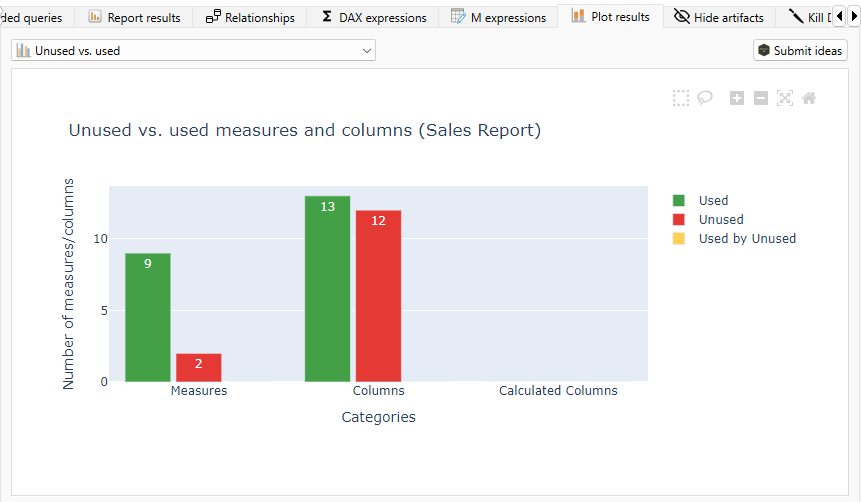
Figure 10. The Plot Results Tab, Unused vs. Used visual, from Measure Killer
C. What-If Analysis
- Simulate the impact of removing certain pages or elements.
- Understand how much size reduction you’d achieve before committing.
- Identify heavy report pages that significantly increase your dataset size.
D. Tenant-Level & Enterprise Analysis (Premium Feature)
For organisations using Power BI Service or Microsoft Fabric:
- Analyse all workspaces, datasets, and reports at once.
- Get lineage tracking, refresh performance, and usage metrics.
- Adjust and customise best practice rules for enterprise standards.
- Review and validate Row-Level Security (RLS) configurations to ensure proper data access across the enterprise.
Using Measure Killer: Improving the Performance of Our Report
Once we’ve got the Execution Summary Pane and the Report results / Tables tabs, we can see where to optimise our report and semantic model. Start by removing the unused measures and columns, using the Kill DAX Artifacts and Kill Columns tabs respectively.
- For measures: Select the ones you want to remove and click on Kill; you don’t need to run the model again to see the changes (see Figure 11).
- For columns: Copy the corresponding M Code and paste it into Power Query Editor > Advanced Editor (see Figure 12); in this case you’ll have to run the model again to see the changes.
It’s important to remember that if you’re dealing with calculated tables (like a Date table), Kill Columns can’t delete their columns. Measure Killer will still flag which ones aren’t being used, but because the table was created with DAX, you’ll need to remove those columns manually in Power BI Desktop.
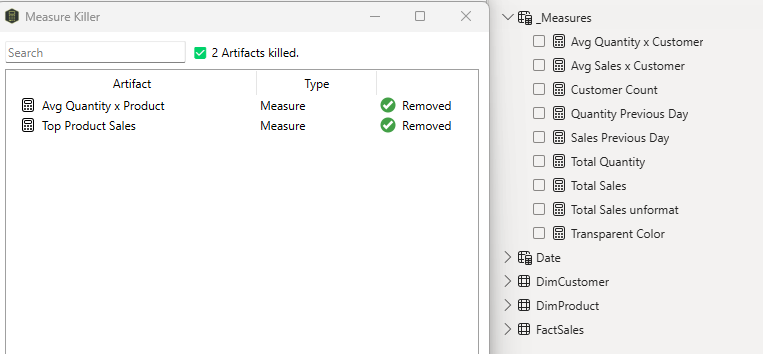
Figure 11. Killed measures sync with Power BI
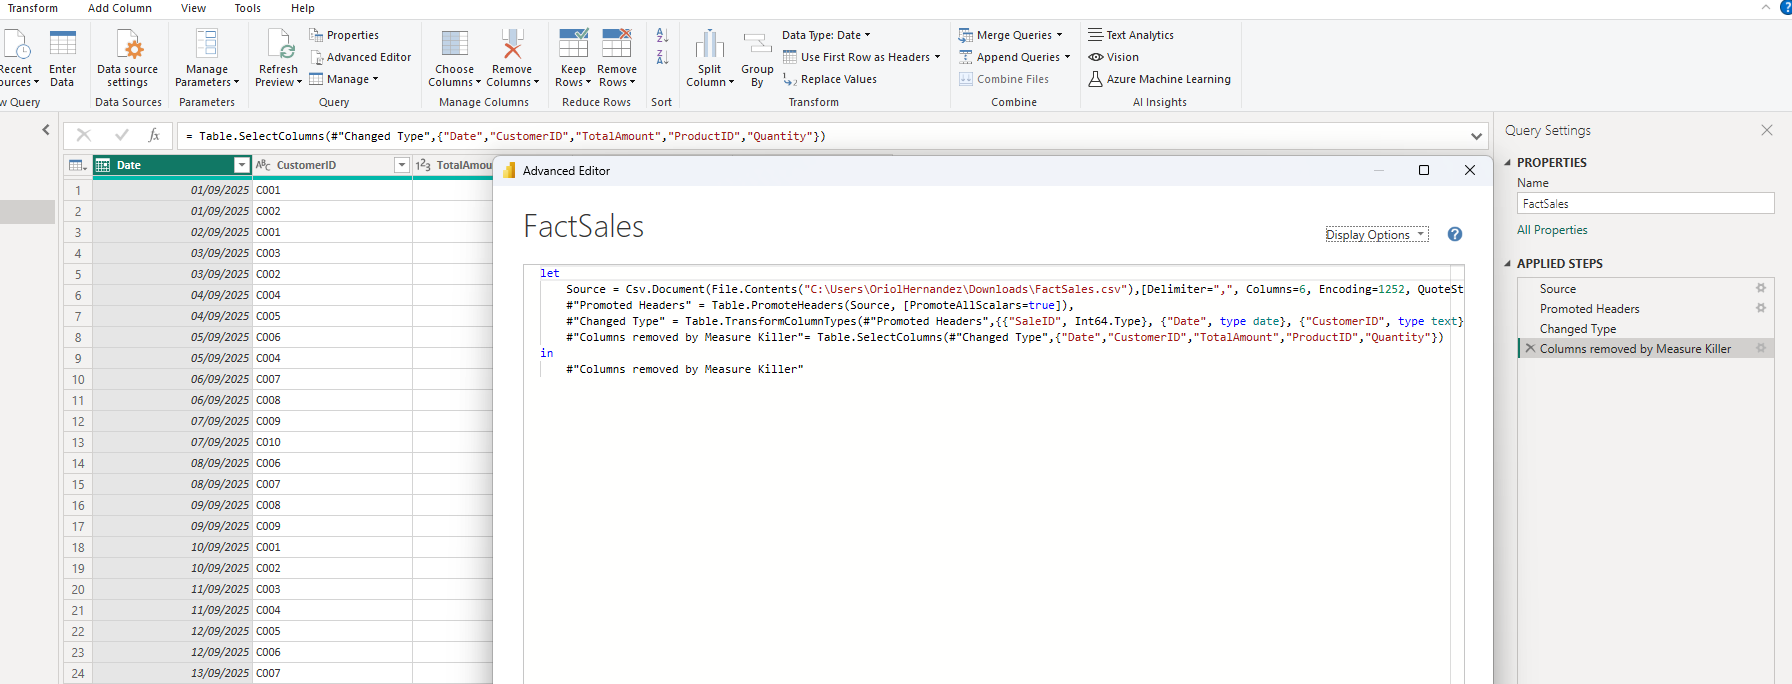
Figure 12. Unused columns are filtered by adding a selection or deletion step in Power Query Editor
After deleting the selected measures and columns, go to the Plot Results tab to see the difference:
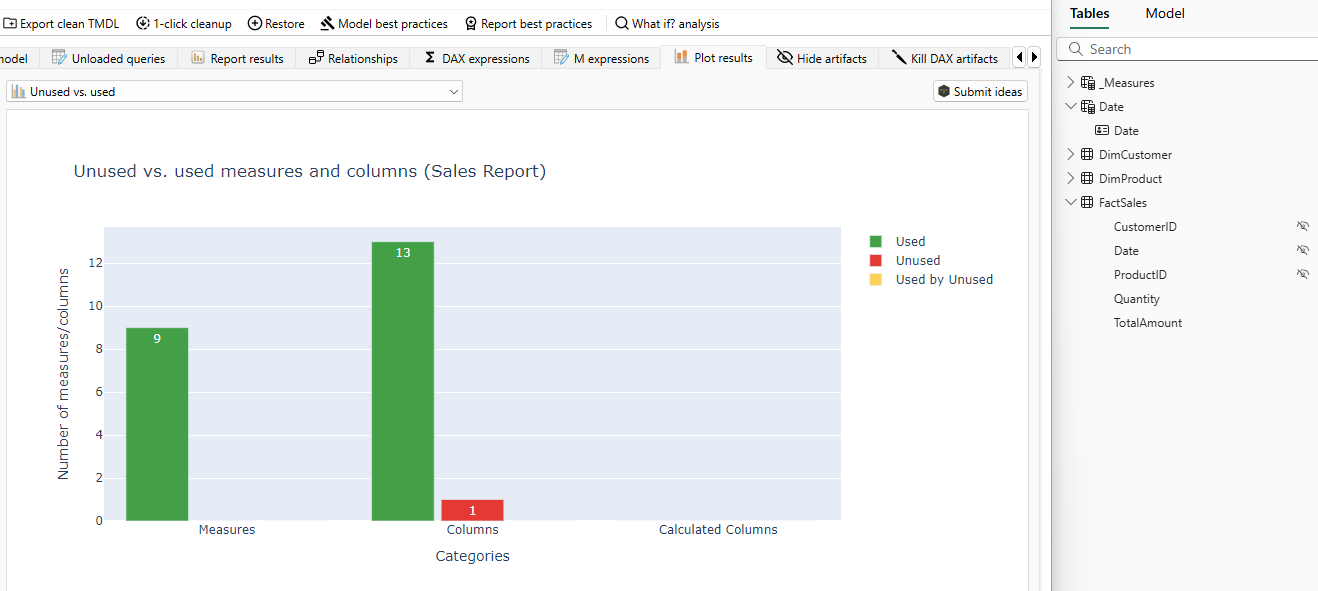
Figure 13. Plot Results Tab, Unused vs. Used visual, after cleaning the model
From there, we can focus on following the provided best practices, first on the model, then on the report. We should focus on the rules with a Severity 3 rating, as these are the most critical and have the biggest impact on the violation score. Another valid approach is to first tackle the rules with the highest total violation score, regardless of their severity level.
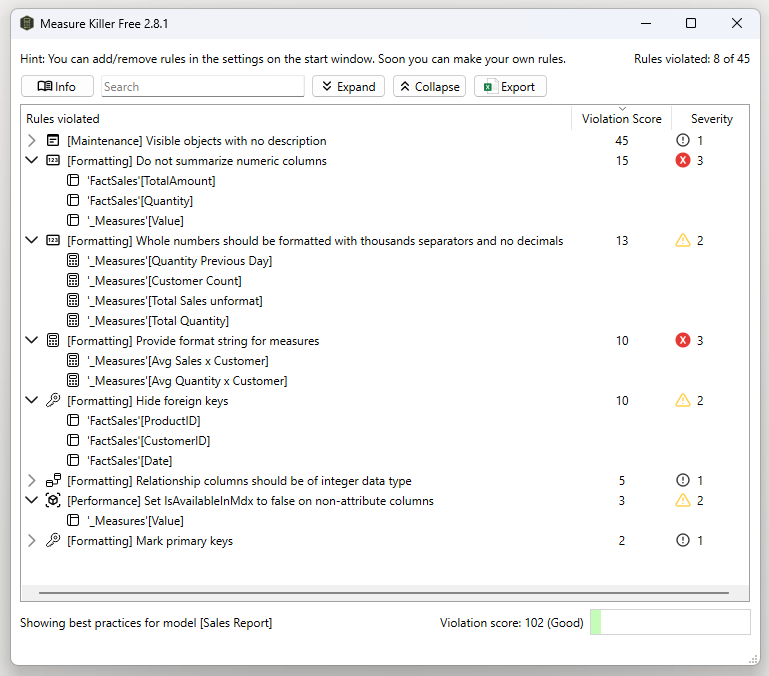
Figure 14. Model analysis of best practices showing severity score
In our case, we followed the first approach. After checking the Severity 3 (and some Severity 2) rules, these were the improvements:
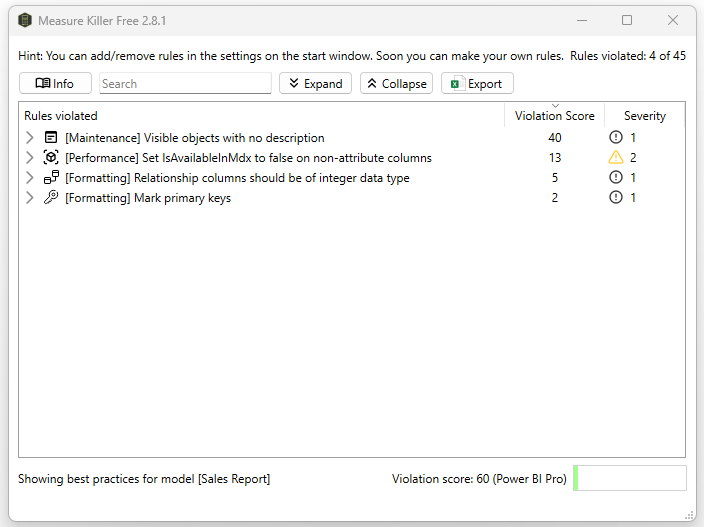
Figure 15. Model analysis enhanced after fixing high severity violations
It’s worth noting that in our example, where we’re working with very little data, the improvement in size is almost negligible. But with a semantic model containing millions of rows, the impact on performance would be much more significant.
Conclusion
To sum up, Measure Killer is more than just a “nice-to-have.” For anyone building, maintaining, or administering Power BI solutions, it becomes a time-saving accelerator and a quality check:
- Efficiency: Cut down hours of manual dependency checks.
- Optimisation: Reduce dataset size, improve refresh times, and streamline reports.
- Governance: Enforce best practices across both models and reports.
- Visibility: Understand exactly what’s in your model, what’s in use, and what isn’t.
In short, Measure Killer helps you move from reactive cleanup to proactive optimisation. It’s a tool that gives you confidence that your models are lean, fast, and built on solid best practices; turning your attention toward insights rather than maintenance.
If you’d like support refining your Power BI models, reviewing your semantic layers, or implementing third-party tools like Measure Killer effectively across your organisation, get in touch with our team of experts. We’ll help you to optimise your reporting ecosystems, improve performance, and adopt best-practice design from the ground up.