18 Feb 2026 Oracle Analytics Cloud January 2026 Update Highlights
Oracle Analytics Cloud (OAC) has delivered its first release of 2026. The January update focuses on natural language-driven analytics, with new AI agent capabilities, improved mechanisms for users to provide feedback for AI-generated insights, and simplified ways to uncover patterns and anomalies in data. Along with these enhancements, the release also brings usability and modelling refinements designed to help teams to build analytics solutions that are more reliable and easier to maintain.
Let’s take a closer look at what’s new and see how these new features can help you to get even more value from your analytics workflows.
OAC Provides Domain-Specialised AI Chatbots
One of the most notable additions in this release is the introduction of domain-specialised AI agents, designed to enable a more conversational and guided analytics experience. Using Retrieval Augmented Generation (RAG) together with custom instructions, these agents allow analytics consumers to interact with both data and documentation using natural language, whilst still respecting governance and security.
To demonstrate this, let’s look at an example from Human Resources. In this scenario, we configure an AI agent to act as a virtual HR assistant, combining a workforce dataset with official HR policy documentation.
We begin by navigating to Create->AI Agent, then select the dataset that will be used by the agent, and define its behaviour with supplemental instructions:
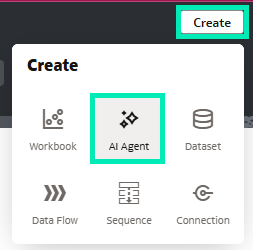
Figure 01: Create AI Agent
In these instructions we specify the agent’s role, the scope of questions it should answer, and how it should respond when the requested information is not available. We also upload the HR policy document as part of this configuration, enabling the agent to reference and apply policy context in its answers:
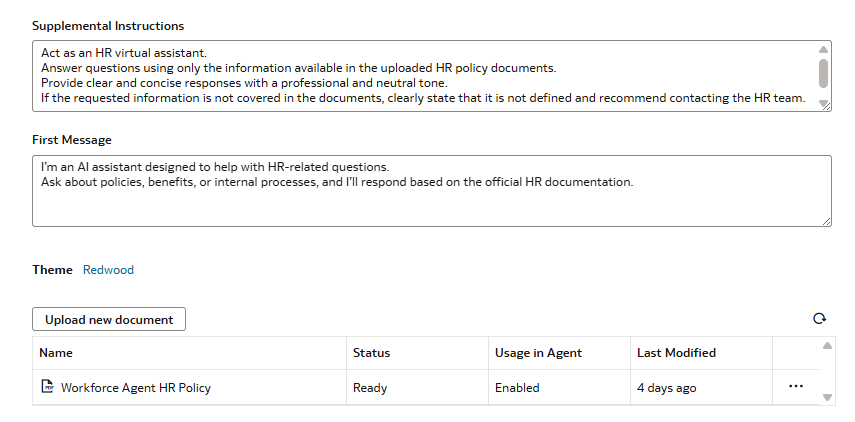
Figure 02: AI Agent Configuration Screen
Once the agent has been defined, we can preview it directly within Oracle Analytics, allowing us to test prompts and to check that the agent behaves as expected before making it available to other users.
For example, we can ask questions like “How many employees are currently eligible for remote work?”. The agent returns a clear numeric answer based on the workforce dataset, accompanied by a short explanation aligned with HR policy, confirming that the agent has successfully combined data-driven insights with policy context in a single response.
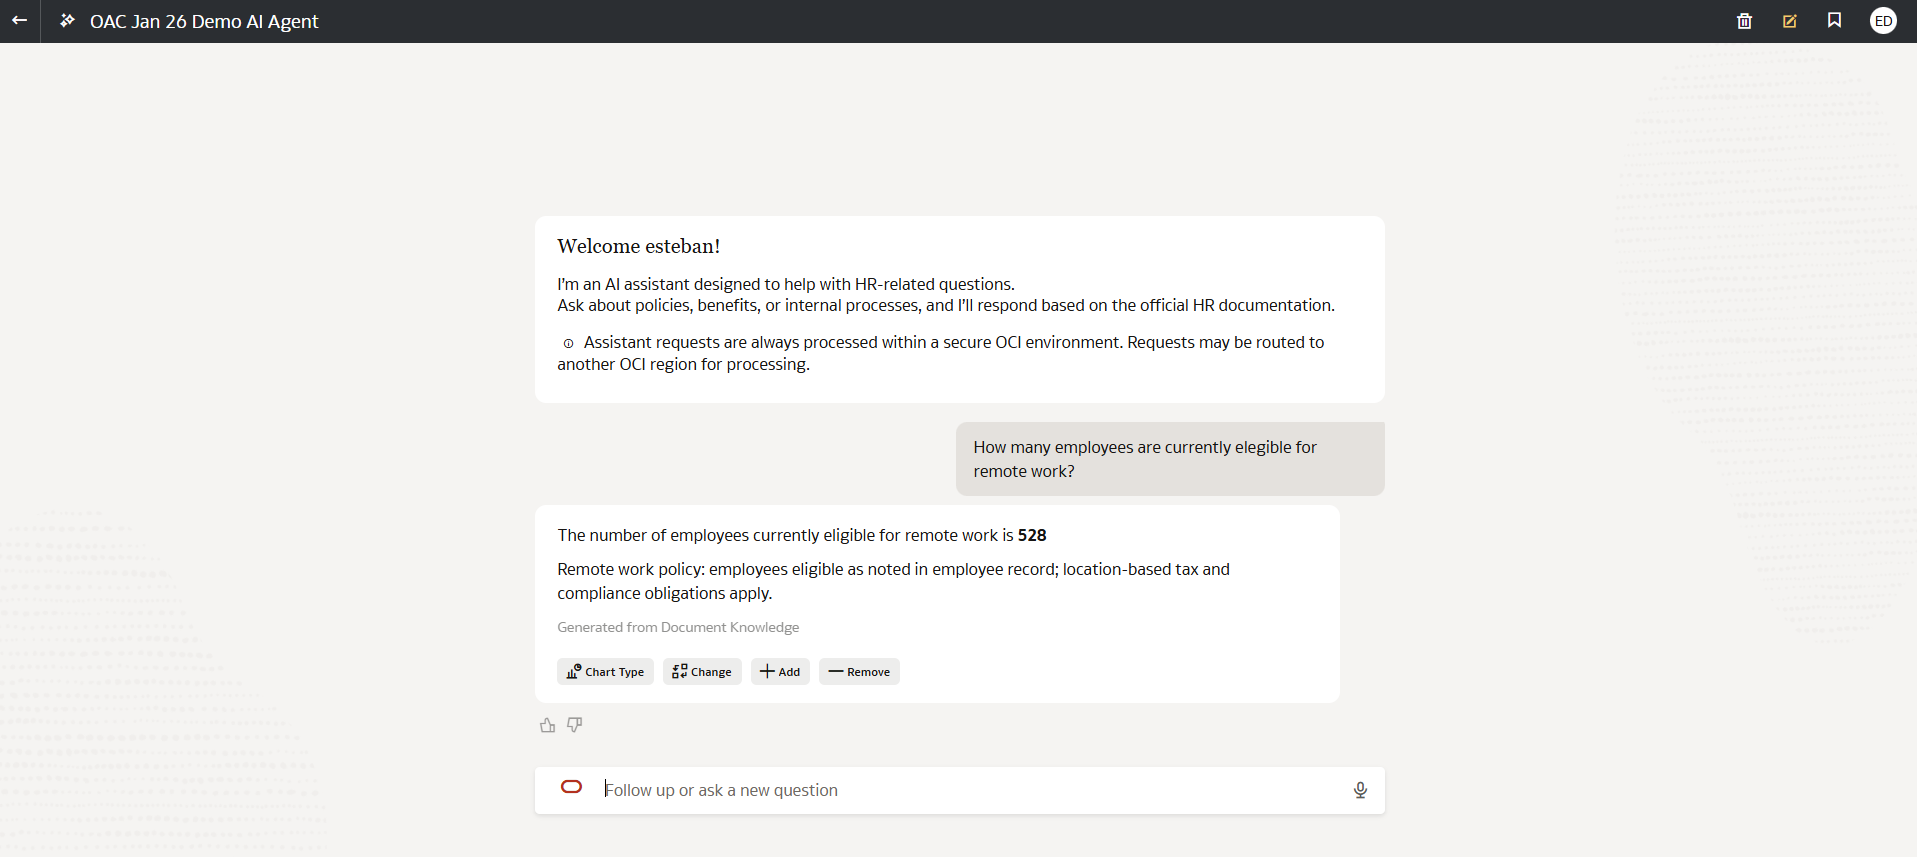
Figure 03: AI Agent preview showing a data-driven response
To further validate its behaviour, we also tested a scenario outside its defined scope, asking a question that could only be answered by accessing another dataset available in the demo instance, but which the HR agent was not configured to use: “How many tweets did we have last year searching for ‘chatbot’?”
As expected, the agent did not attempt to answer the question, but instead responded that the requested information was not available within its configured context, showing that it respected the defined data scope and access boundaries:
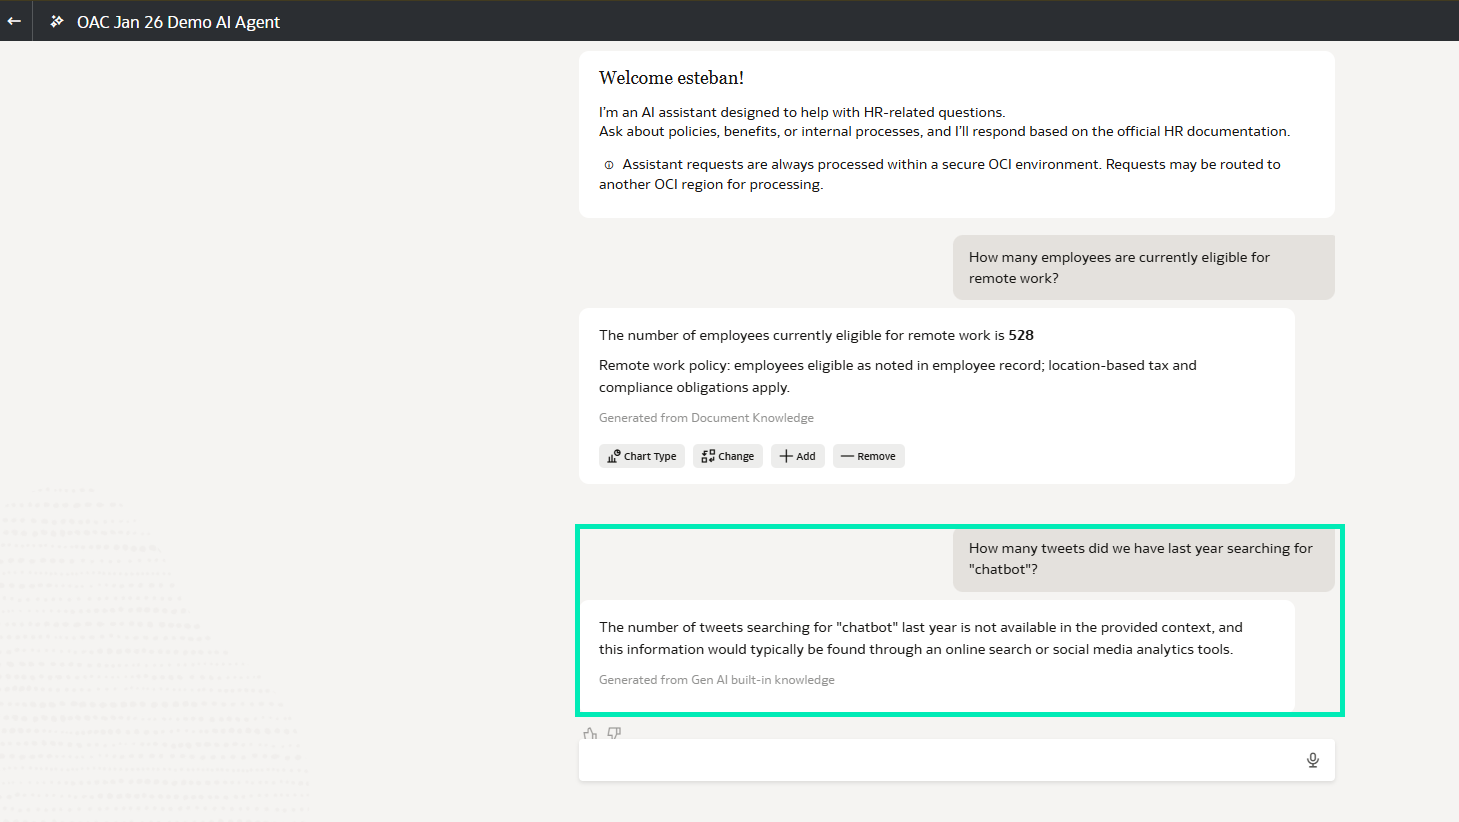
Figure 04: Agent preview showing an out-of-scope response
Now let’s make our agent available directly within a workbook, allowing consumers to use it whilst exploring dashboards; this is done in authoring mode.
First, we open the AI Assistant within the workbook and select the previously created HR agent from the list of available agents:
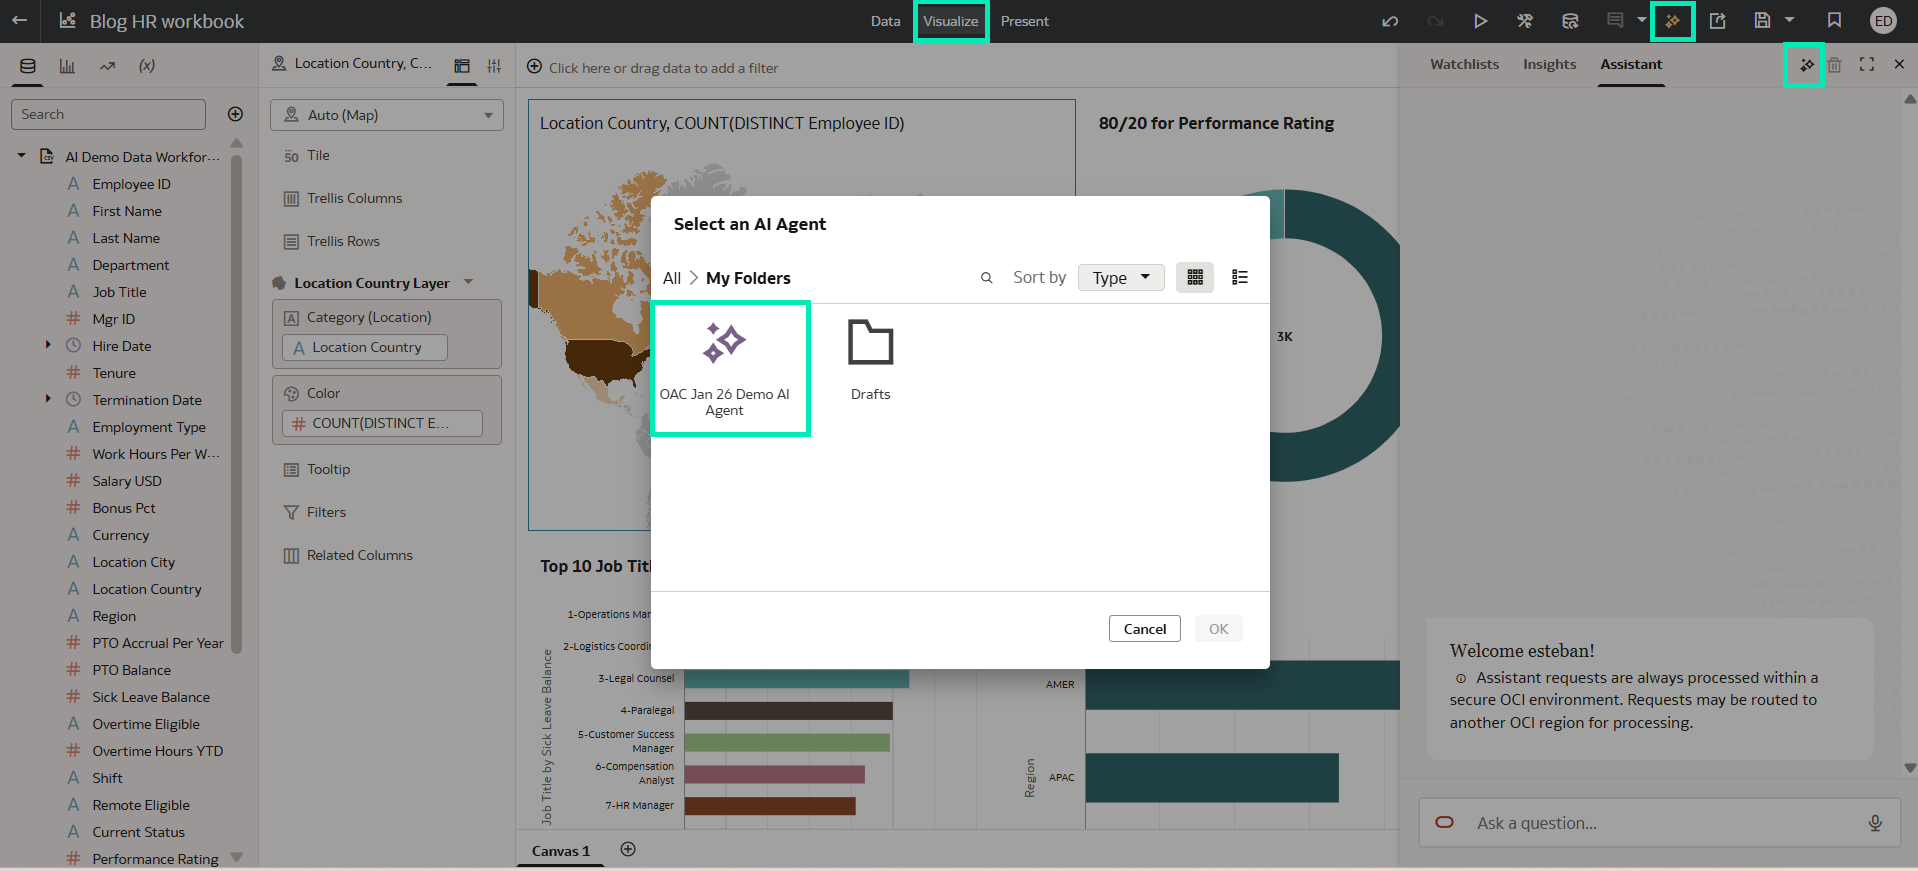
Figure 05: Selecting the HR agent for use within the Workbook Assistant
Then we go to the Present tab of the workbook, where we make sure that the Workbook Assistant option is enabled, as described in the “Enable Consumers to Use Oracle AI Assistant to Gather Insights More Easily” section of our post Oracle Analytics Cloud July 2025 update. In the Assistant section we confirm that the selected agent is the one we want end users to access:
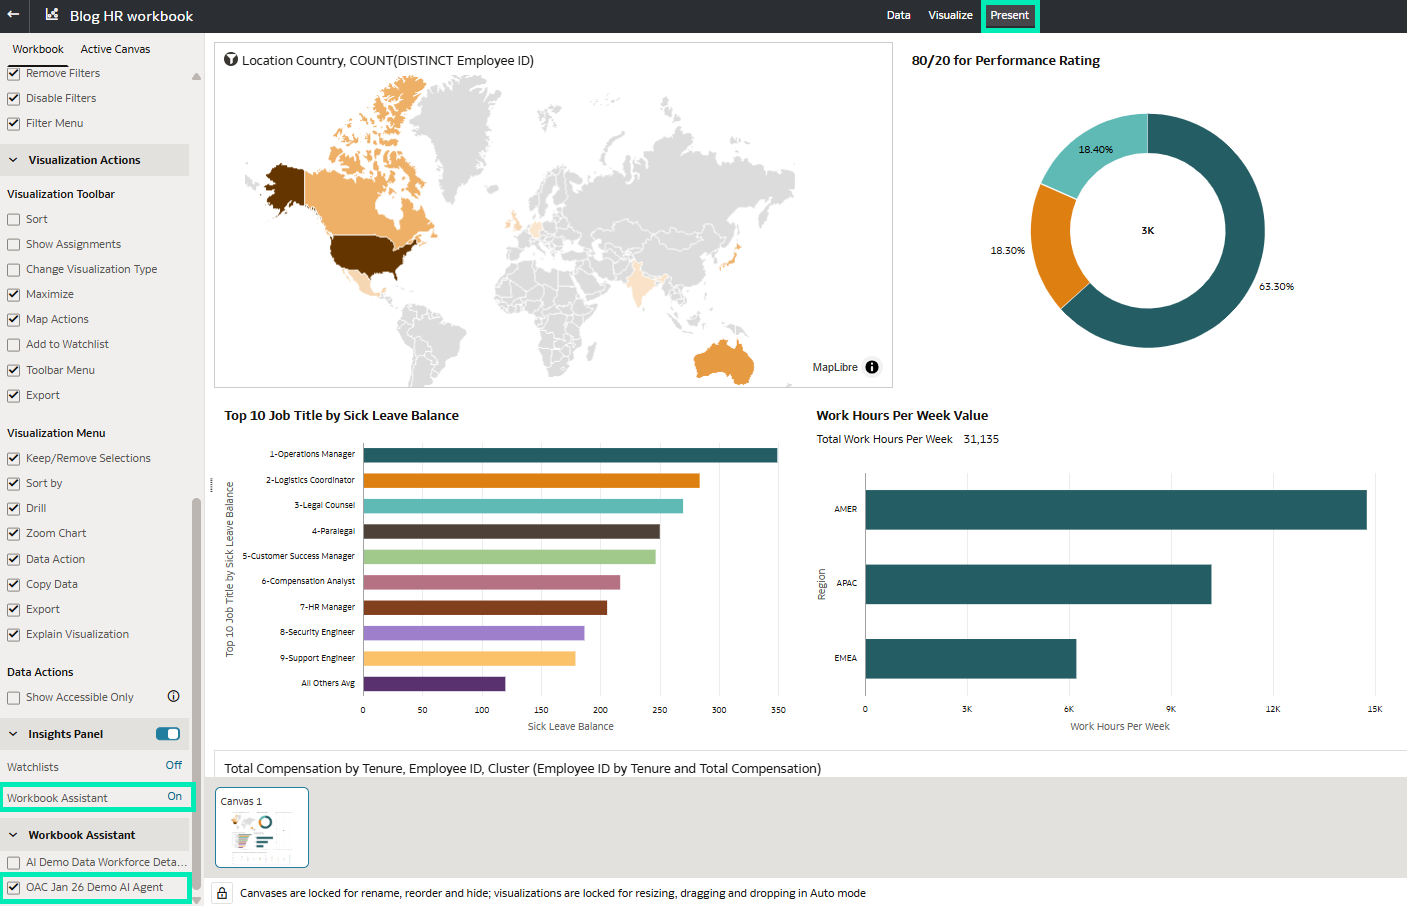
Figure 06: Enable the Workbook Assistant in the Present tab
Now that the agent is enabled, the workbook can be explored in consumer mode: we simply open the Assistant from the workbook and start asking questions in natural language.
In the following example, we ask “Which departments have the highest number of employees with above-average performance ratings?”. The Assistant runs the configured HR agent behind the scenes, uses the workforce dataset to calculate the required metrics, generates a department-level visualisation, and enriches the response with contextual information retrieved from the HR policy documentation through RAG:
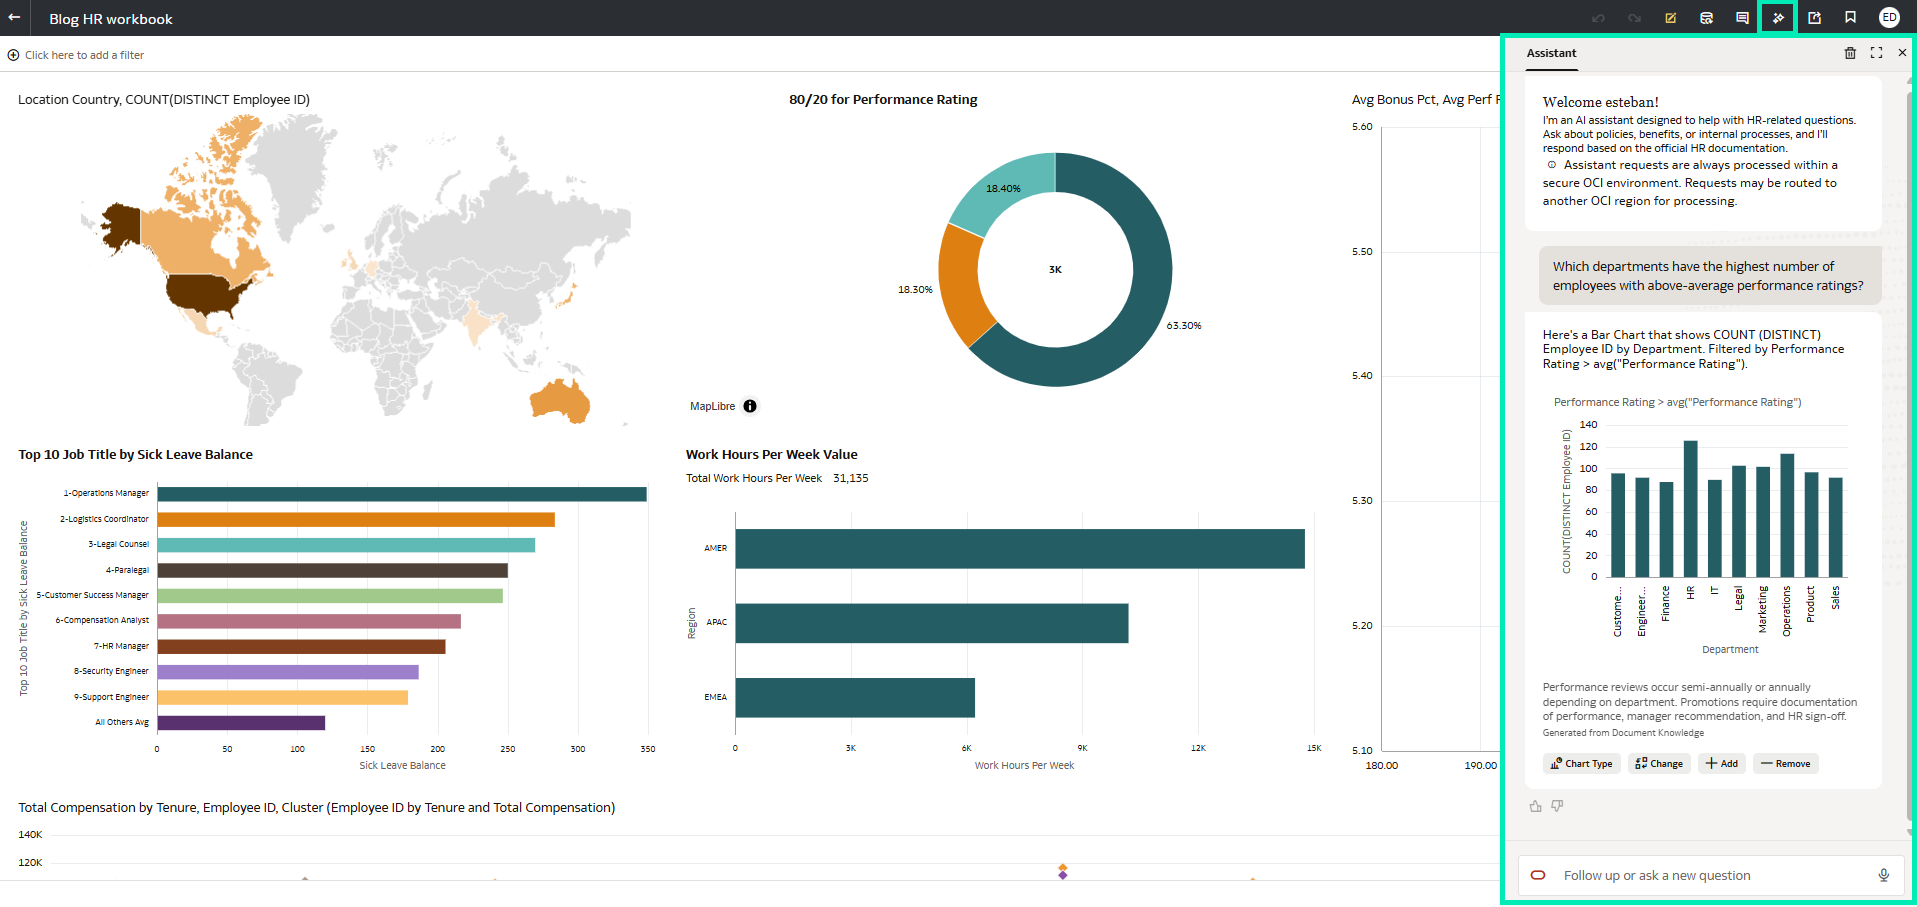
Figure 07: Enriched response combining analytical results with HR policy
This embedded experience illustrates how AI agents let users explore data and business rules through a single, conversational interface, whilst staying within a governed analytics environment.
AI Assistant Feedback in Oracle Analytics
This feature lets users provide feedback on the answers produced by the AI Assistant and the agent. Users can mark a response as helpful or not, and explain what was missing or unclear. This feedback is captured and made available to system administrators, who can review user interactions with AI-generated answers and identify areas for improvement.
To test the feature, we open a workbook or an agent and submit a question in natural language. The response may be a number, a visualisation, or both, and offers two feedback options: a thumbs up to indicate the answer is correct and useful, or a thumbs down if it does not meet expectations:
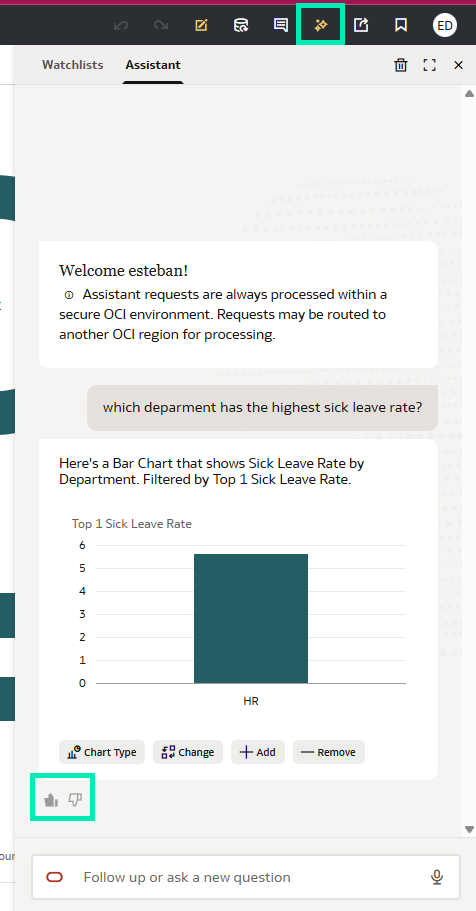
Figure 08: AI-generated response with thumbs up
When we select thumbs down, we can provide additional context by choosing a feedback category to specify whether the issue is related to incorrect data, a lack of clarity, incomplete information, or relevance. Optionally, we can also explain what the expected result should have been:
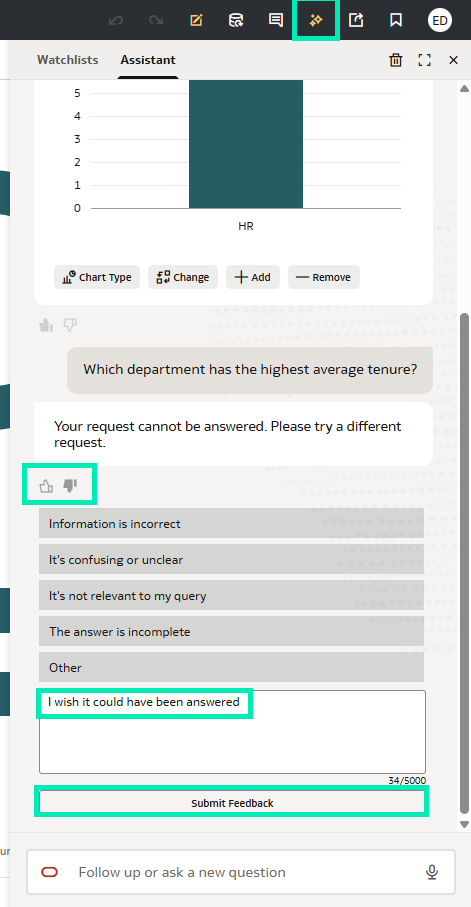
Figure 09: AI-generated response with thumbs down
Once submitted, the feedback is automatically captured by the platform and stored in Oracle Cloud Infrastructure (OCI) logging, together with the original question and the AI-generated response. System administrators can review this information to analyse recurring issues and understand how AI-generated answers are perceived across the organisation.
Overall, AI Assistant Feedback offers an additional layer of control and transparency to AI-assisted analytics in Oracle Analytics Cloud.
Use AI Assistant to Detect Outliers and Clusters
This feature enables users to explore clusters and outliers in their data by asking questions in natural language through the OAC AI Assistant. By interacting conversationally with the data, they can quickly spot patterns and unusual data points without needing to set up analytical methods or configurations manually.
Before getting started, we need to ensure that the Assistant is enabled and indexed in our dataset, as described in the Oracle Analytics Cloud July 2025 update mentioned above; we right-click on the dataset, select Inspect, navigate to the Search tab, and confirm that the Assistant option is selected under Index Dataset For:
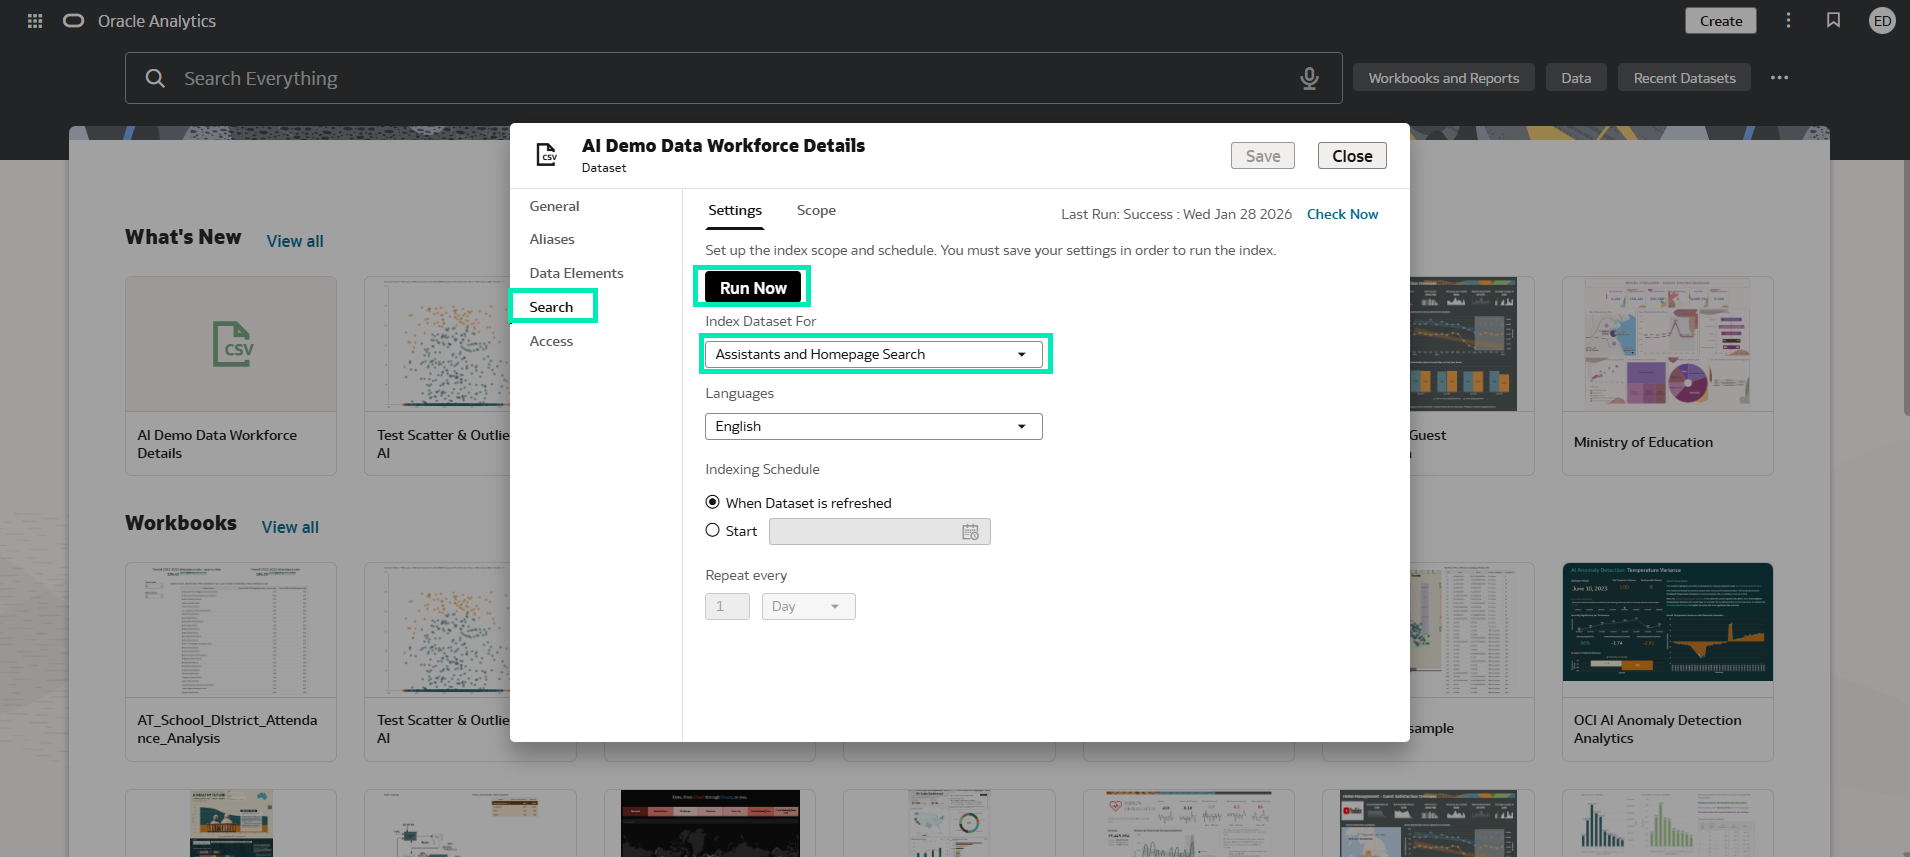
Figure 10: Enable index for AI Assistant
Next, we create a workbook based on this dataset and begin asking questions in natural language to generate a visualisation, typically a scatter chart, using the measures and attributes we want to analyse. Based on our request, the Assistant automatically generates the corresponding visual:
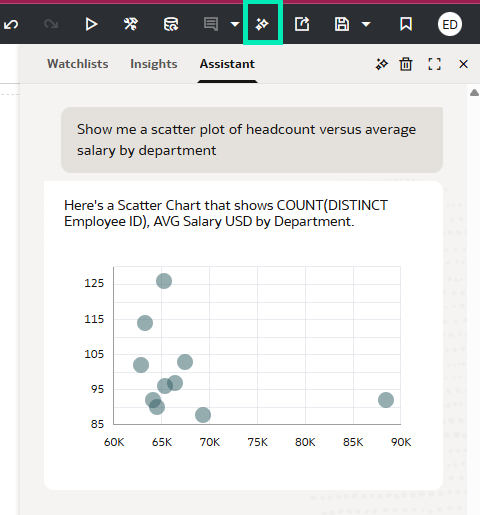
Figure 11: Scatter chart generated using the Assistant
Once the scatter chart is ready, we can continue our analysis with some follow-up questions: for example, we can request the data points to be grouped into a specific number of clusters. The Assistant applies the clustering logic and updates the visualisation accordingly:
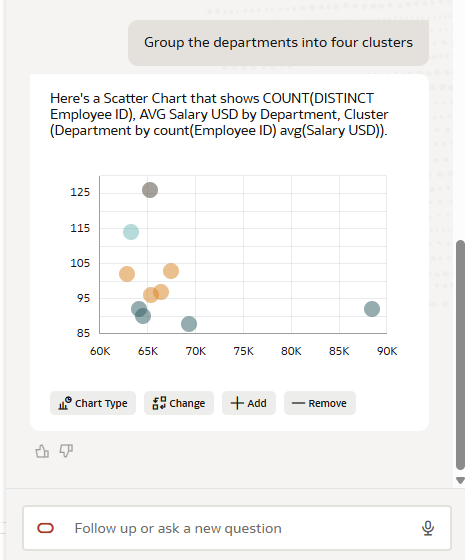
Figure 12: Scatter chart with clusters applied
After the clustered visualisation has been created, we can add it to a workbook, save it to a watchlist, or place it on a canvas for further analysis. We can review the calculations behind the clusters at any time, check which attributes and measures were used, and confirm the cluster count:
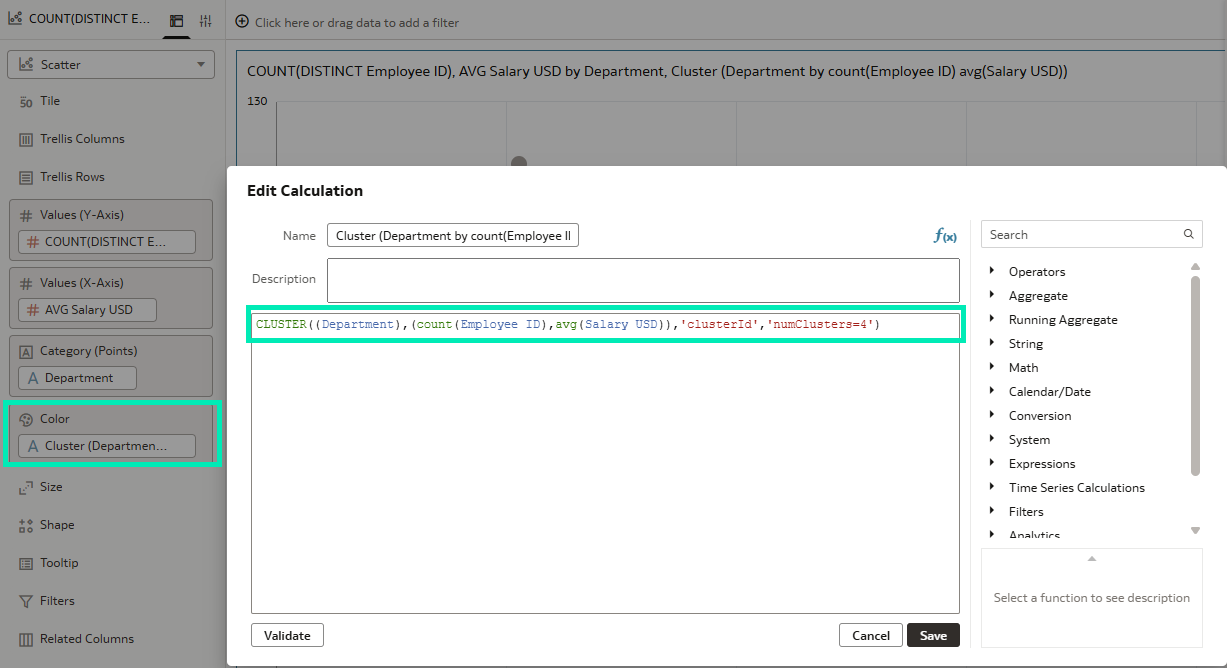
Figure 13: Cluster calculation details
To take our analysis a step further, let’s start a new conversation and ask, “Show me a scatter plot of salary (in USD) versus performance rating by employee”. We then follow up with a question like “Identify outliers in this chart”, and the Assistant detects and highlights anomalous data points, updating the visualisation accordingly:
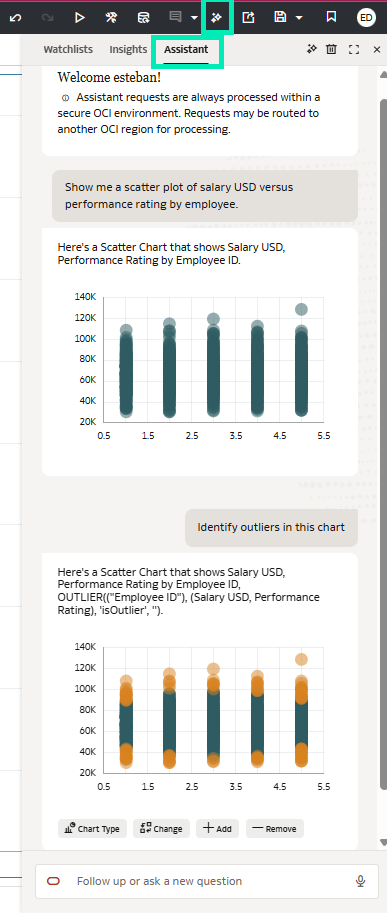
Figure 14: Scatter chart with outliers identified
Finally, we can add the chart to the canvas to verify the calculation behind it:
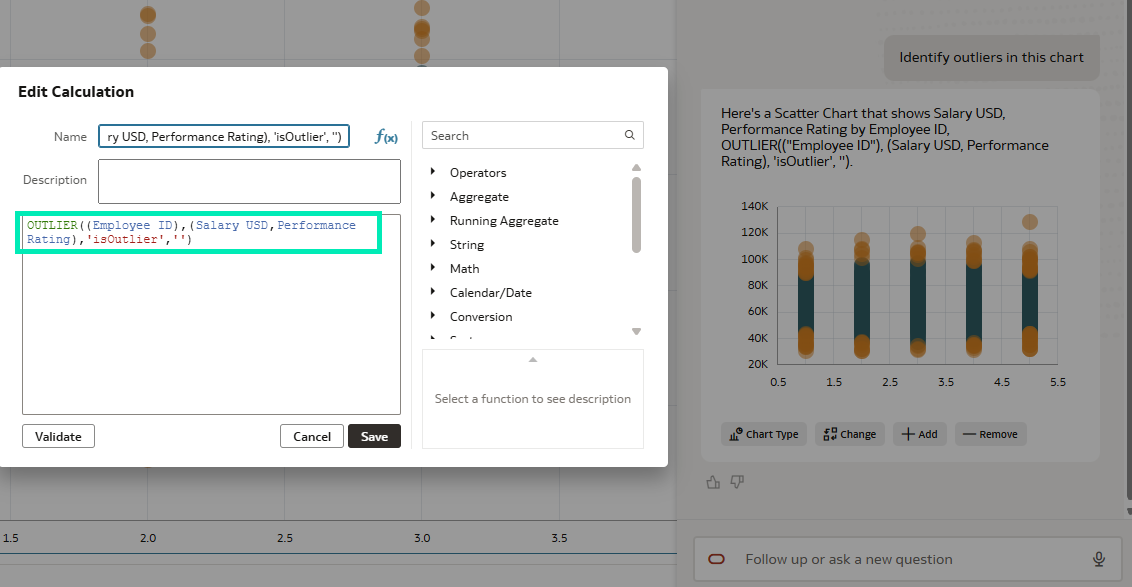
Figure 15: Outliers calculation
Add Aliases to Data Items
This capability introduces dataset aliases, allowing users to preserve workbook references when a dataset is deleted and recreated. Now, a new dataset can be mapped to the object ID of the deleted dataset, so existing workbooks continue to work without manual fixes, reducing maintenance and disruption for business users.
First, we locate the dataset we want to inspect. In the dataset menu, we right-click and select Inspect. The Inspect window now includes a new tab called Aliases:
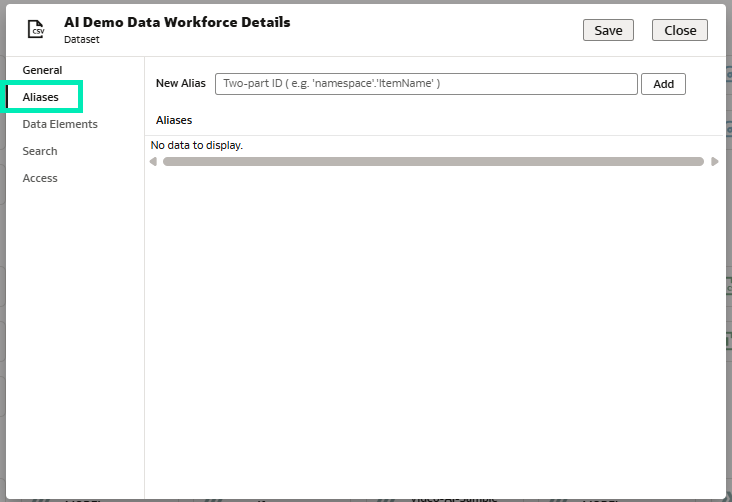
Figure 16: The Inspect window showing the new Aliases tab
Next, we copy the object ID of the existing dataset. In the General tab of the Inspect window, the Object ID is displayed and can be copied to the clipboard:
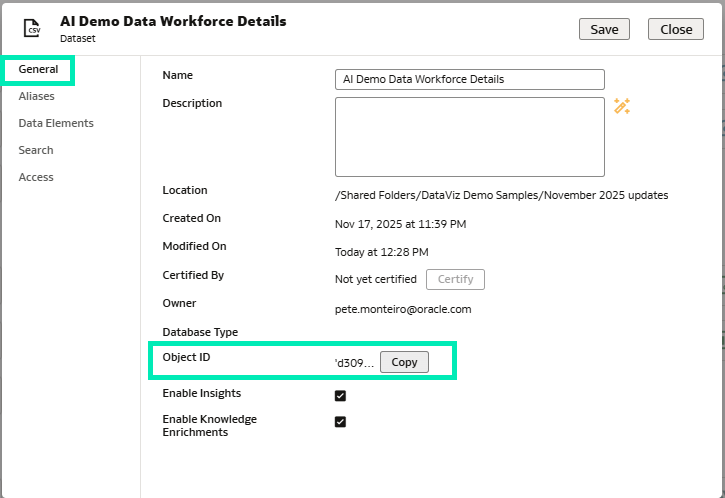
Figure 17: Dataset General tab with Object ID
Next, we delete the dataset. At this point, any workbooks that referenced it will fail to open, as OAC can no longer find the original object ID: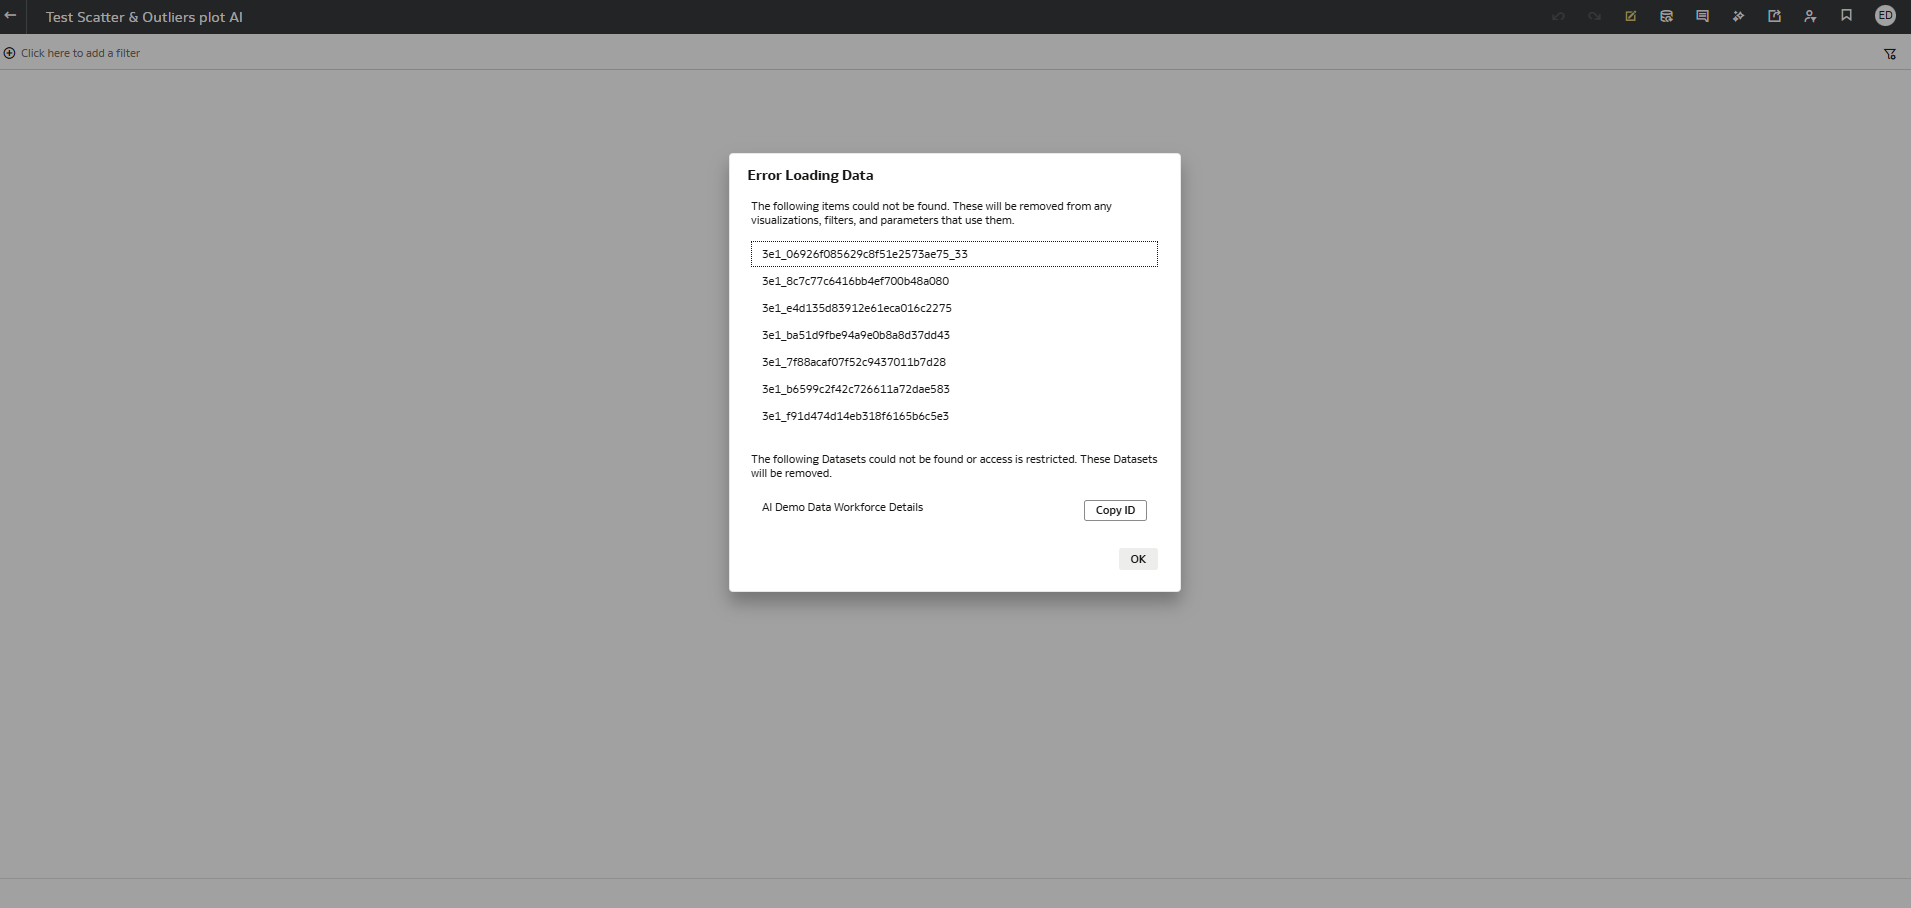
Figure 18: Workbook fails to open after deleting the source dataset
To restore the workbook references, we open the Inspect window for the new dataset and go to the Aliases tab, where we add a new alias and paste in the object ID of the deleted dataset. When we select Add, Oracle Analytics validates the alias and links the old object ID to the new dataset:
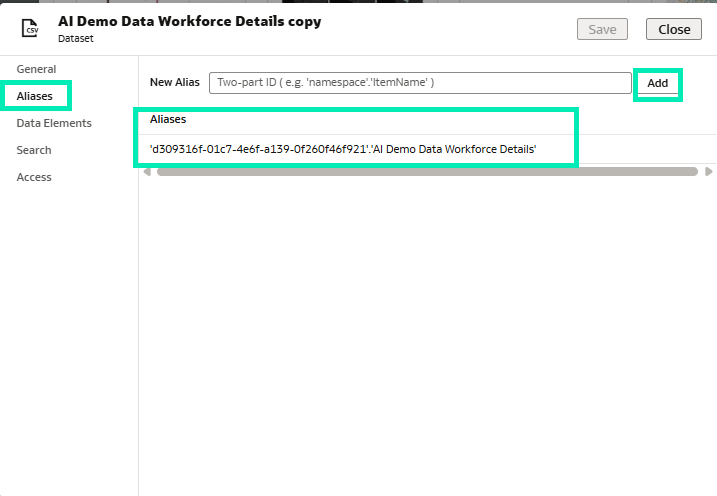
Figure 19: Adding an alias using the deleted dataset Object ID
Once the alias has been added, any workbooks that previously referenced the deleted dataset are automatically reconnected to the new dataset. The workbook links are restored, and they continue to work without further changes.
If the original dataset is no longer available in the catalogue, we can retrieve its Object ID from the workbook JSON or from a HAR file, allowing the restoration of references even after deletion.
Shared Images
One of the most practical features introduced in this update is Shared Images, which allows users to upload images (for example, logos or icons) just once and then reuse them across all workbooks in the instance, helping to keep branding and visual standards consistent when multiple authors are building dashboards.
To add an image, we first select the visualisation where it will be used. This can be an image visual, a tile, or any visualisation that supports a background image.
With the visualisation selected, we open the Properties panel on the right. Under Style, we locate Image Source, which is set to None by default.
Click on None to see the available options:
- None: No image.
- File: Upload an image for use in the current workbook only.
- URL: Reference an image from a web address.
- Shared Image: Select from centrally stored, reusable images.
Now we select Shared Image from the dropdown:
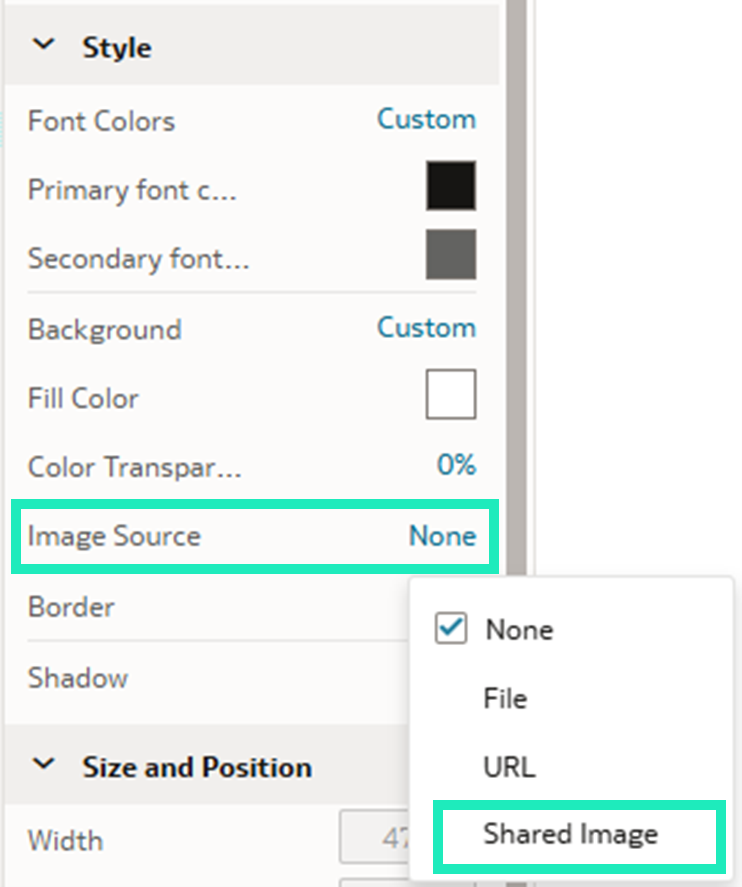
Figure 20: Style section with Image Source property set to None
After setting Image Source to Shared Image, we select the upload icon. The Select a Shared Image window opens, showing:
- Existing shared images already available for use.
- An Upload Shared Image button (top right) to add new images.
- Search and view options to locate existing images.
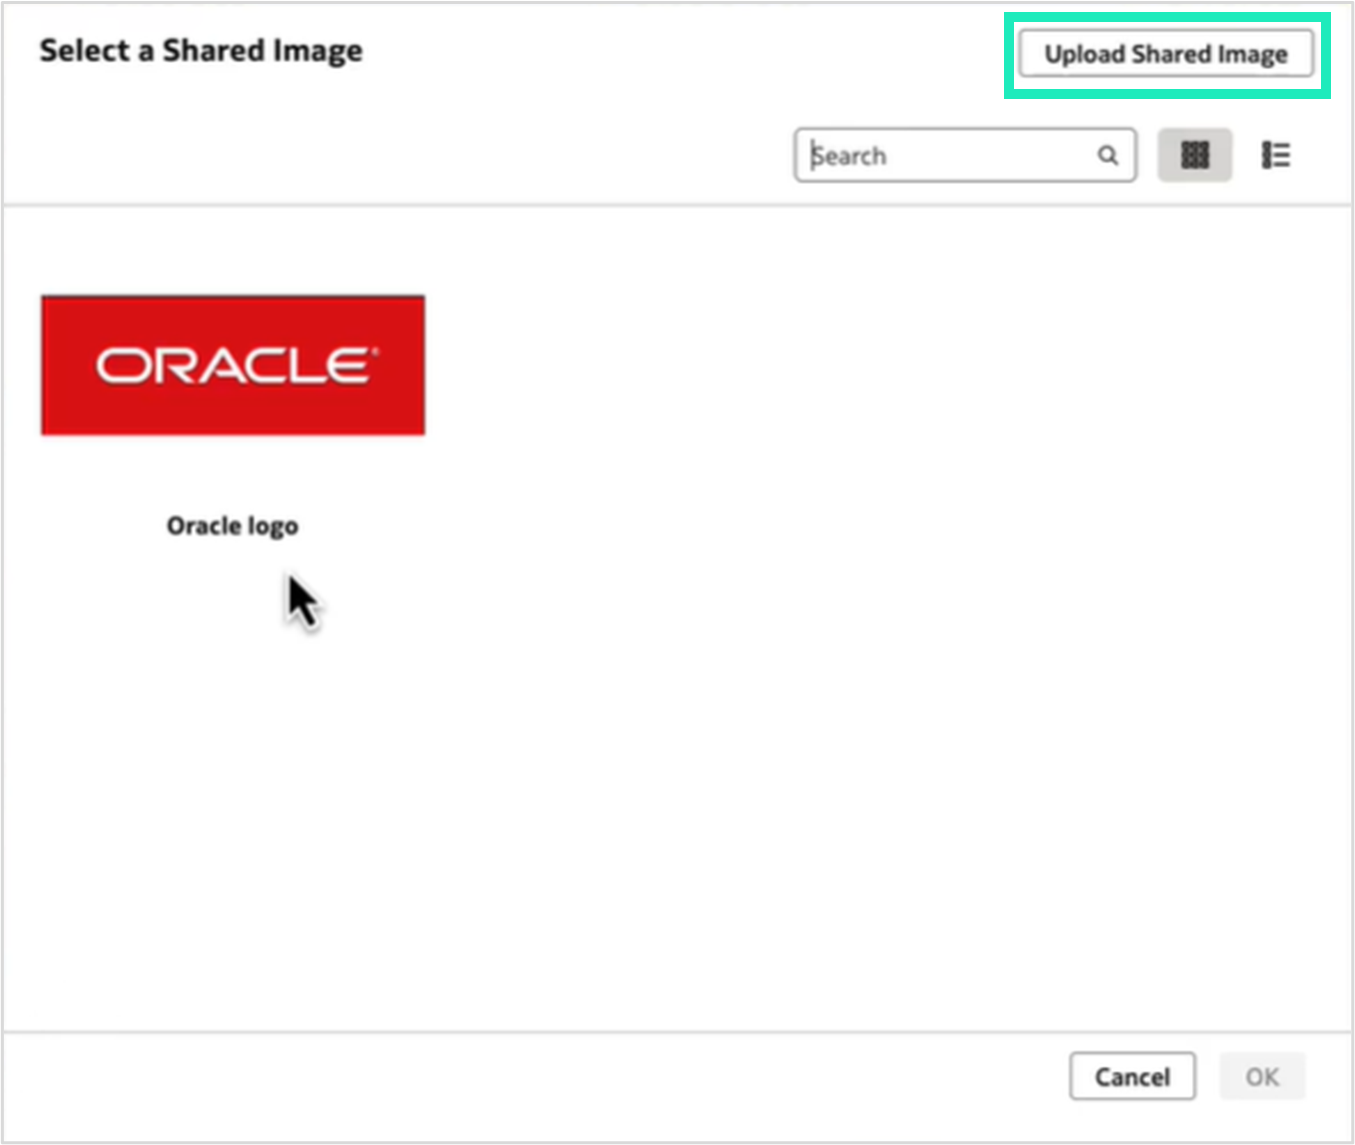
Figure 21: The Select a Shared Image window
To upload a new shared image, click on Upload Shared Image in the top-right corner. In the dialogue box:
- Enter an image name.
- Click on the upload icon next to Image File and select an image from your computer.
- We can optionally adjust Compress on Upload Quality (default: 80%).
- Click on Save
Or we can simply select an existing shared image, for example the Oracle logo. The shared image is then applied as the background of the selected visualisation:
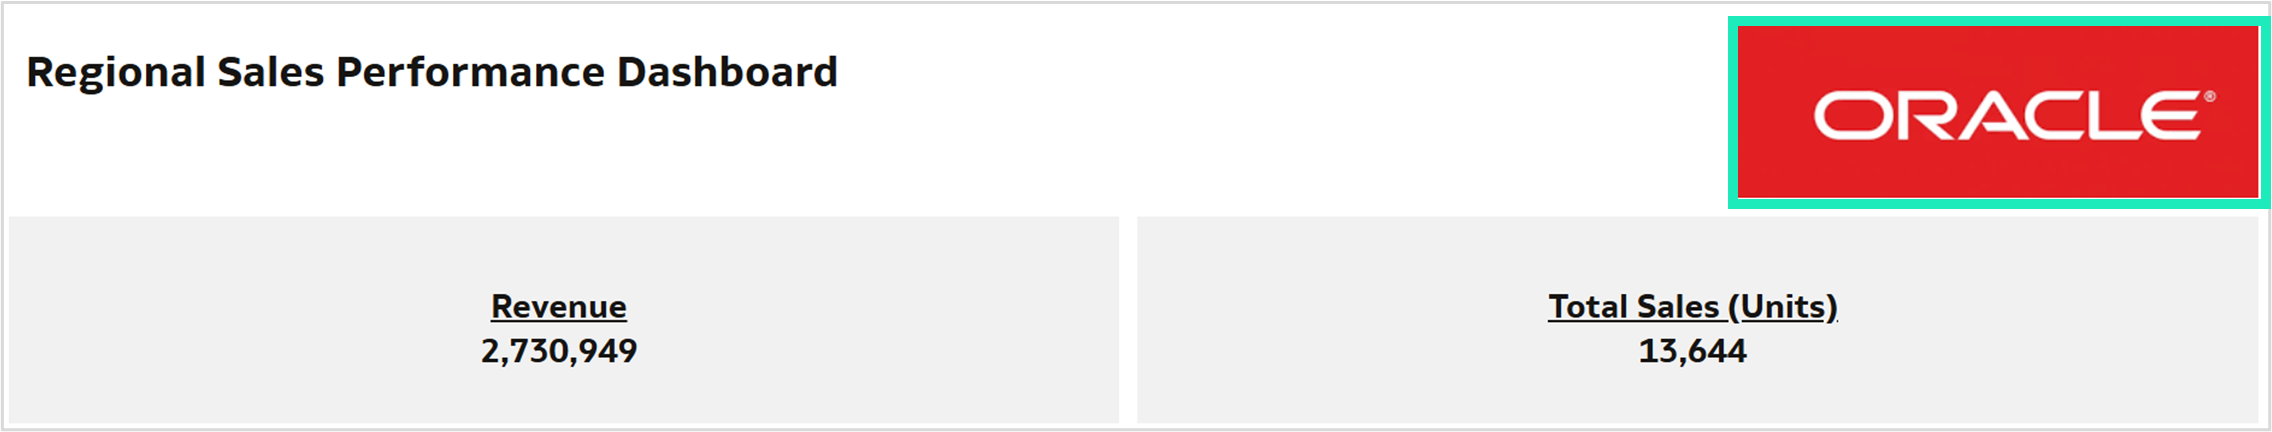
Figure 22: Shared image applied as the background of a visualisation
Set Multiple Data Actions on a Column
Another useful enhancement is the ability to assign multiple data actions to a column’s On Click Action in table and pivot visualisations. This gives workbook authors more flexibility when configuring clickable values. Previously, a column could trigger only one data action at a time.
To use this feature, we first define the data actions to be anchored to the chosen column. In this example, we set up actions for the Product Name column by opening the workbook menu (three dots) in the top-right corner and then selecting Data Actions from the dropdown menu:
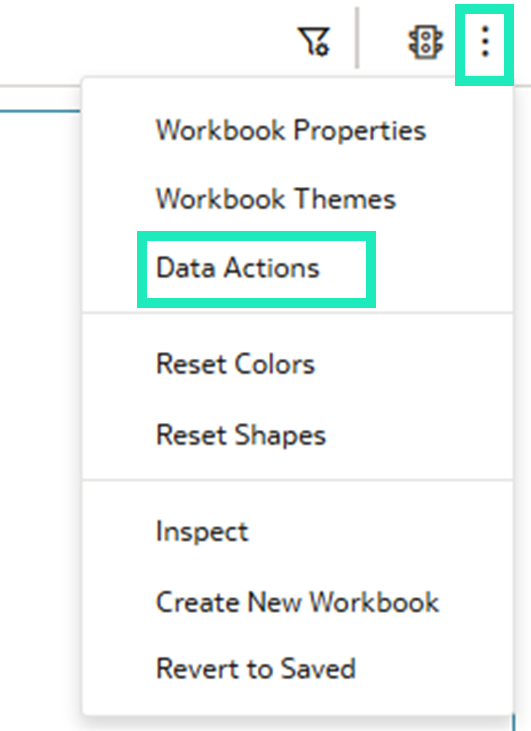
Figure 23: Data Actions in the workbook menu
Now, we create two actions: a Google search action and a link to the Product Detail View canvas.
To create the first action, in the Data Actions window:
- Click on the + icon to add a new action
- Configure the action:
- Name: Google
- Type: URL Navigation
- Anchor To: Product Name
- URL: https://www.google.com/search?q=${valuesForColumn:Product Name}
- Supports Multiple Selection: On
- Open In: Auto
- Click on OK
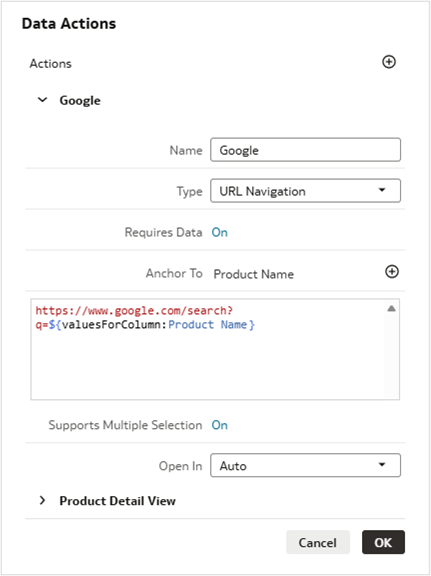
Figure 24: Google data action configuration
Now let’s create a second action that navigates to a detailed view within the workbook:
- Click on the + icon again to add another action
- Configure the action:
- Name: Product Detail View
- Type: Analytics Link
- Anchor To: Product Name
- Target: This Workbook
- Canvas Link: Product Detail View (a separate canvas created in the workbook providing a detailed view of product data)
- Pass Values: Anchor Data
- Supports Multiple Selection: On
- Click on OK
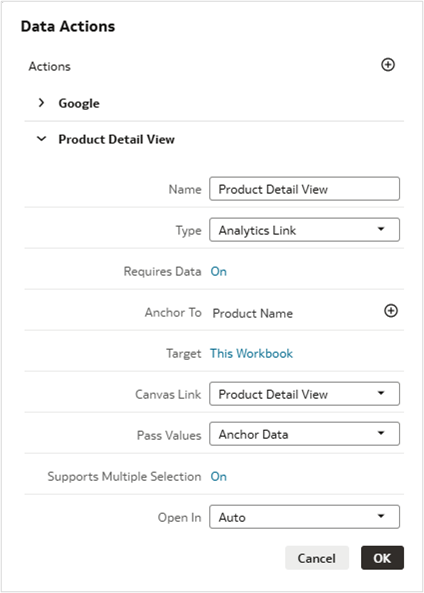
Figure 25: Product Detail View data action configuration
Now that we have created these data actions, we need to configure which ones appear when users click on the Product Name column:
- Click on the table visualisation in the canvas.
- In the Properties panel on the right, expand Edge Labels.
- Find and expand the Product Name
- Scroll down to locate On Click Action, which is set to Off by default.
- Click on Off to open the dropdown menu of options:
- Off: No actions enabled.
- Auto: Shows all available data actions.
- Google: Runs a Google search.
- Product Detail View: Navigates to the detail canvas.
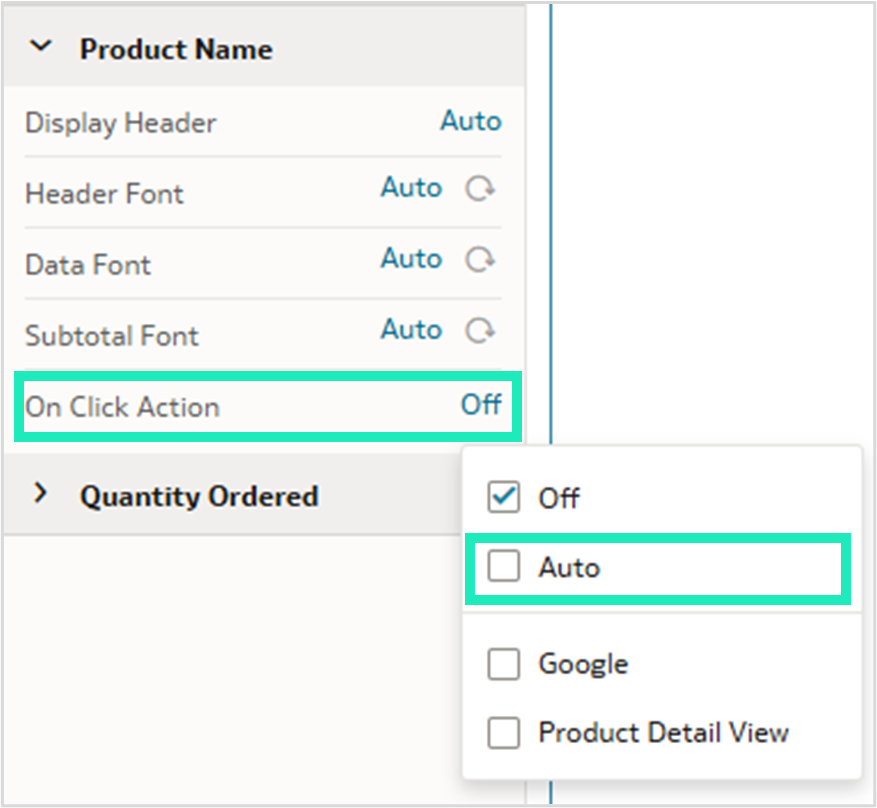
Figure 26: Dropdown menu for On Click Action with available options
We select Auto to enable all available data actions, save the workbook, and switch to Present mode to see the feature in action.
When we hover over values in the Product Name column, they are underlined, indicating that they are clickable. Clicking on a product name opens a dropdown menu showing both actions, Google and Product Detail View:
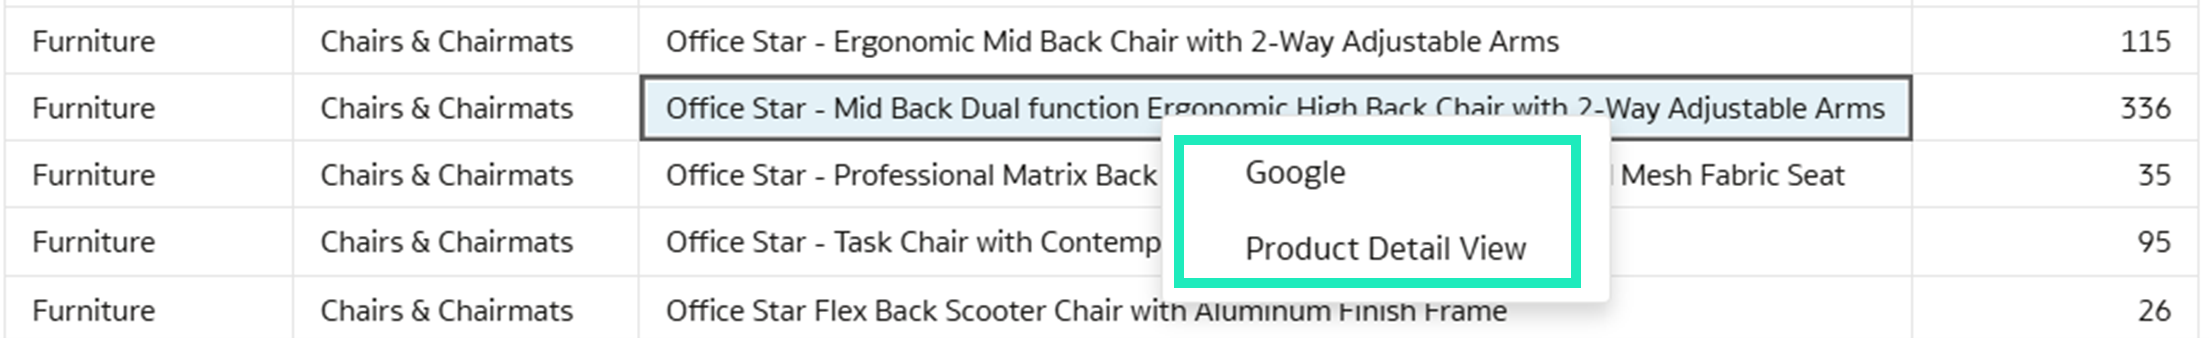
Figure 27: Dropdown menu with available actions for selected product
Selecting Google opens a new browser window and runs a Google search using the product name as the search term:
![]()
Figure 28: Google search for selected product
Selecting Product Detail View navigates to the Product Detail View canvas, automatically filtered to show information for the selected product:
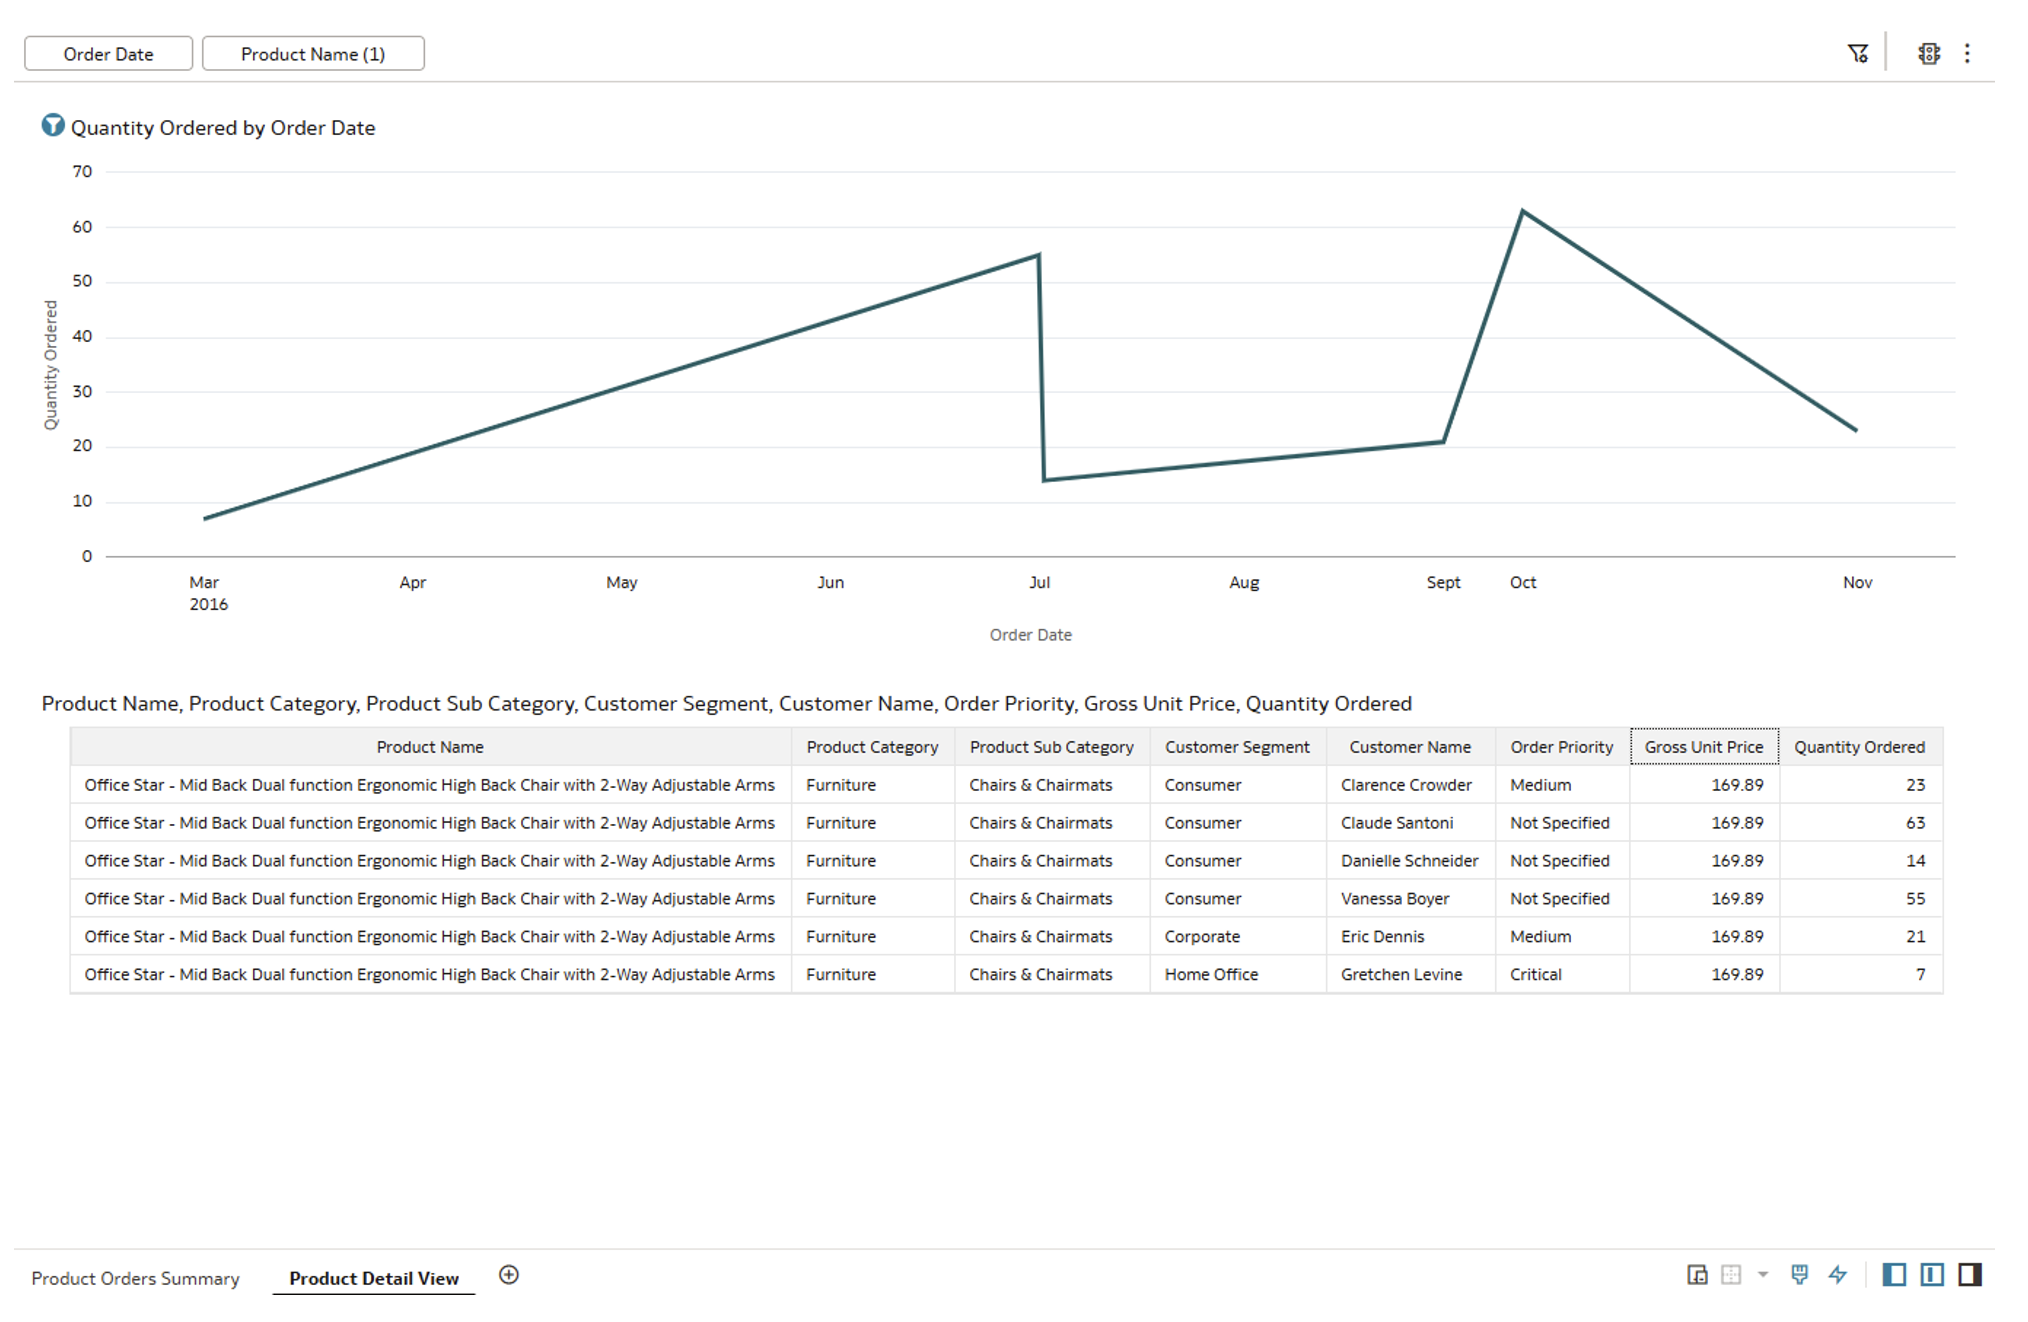
Figure 29: Product Detail View canvas with filtered product information
Model Data from Analytic Views
Another key enhancement in this update is the ability to use Oracle Analytic Views as a data source for semantic models, bringing dimensional modelling capabilities into Oracle Analytics Cloud.
Oracle Analytic Views are database objects that provide an abstraction layer over the database tables. They define measures, dimensions, hierarchies, and calculations at the database level, and can now be imported directly into OAC semantic models.
Before we can use Analytic Views in a semantic model, we first need to set up a connection to our Oracle database. From the OAC home page, we create a new connection, choose Oracle Analytic Views as the connection type, and then provide the required details, such as the connection string, the client wallet (for Autonomous Database), and the database credentials:
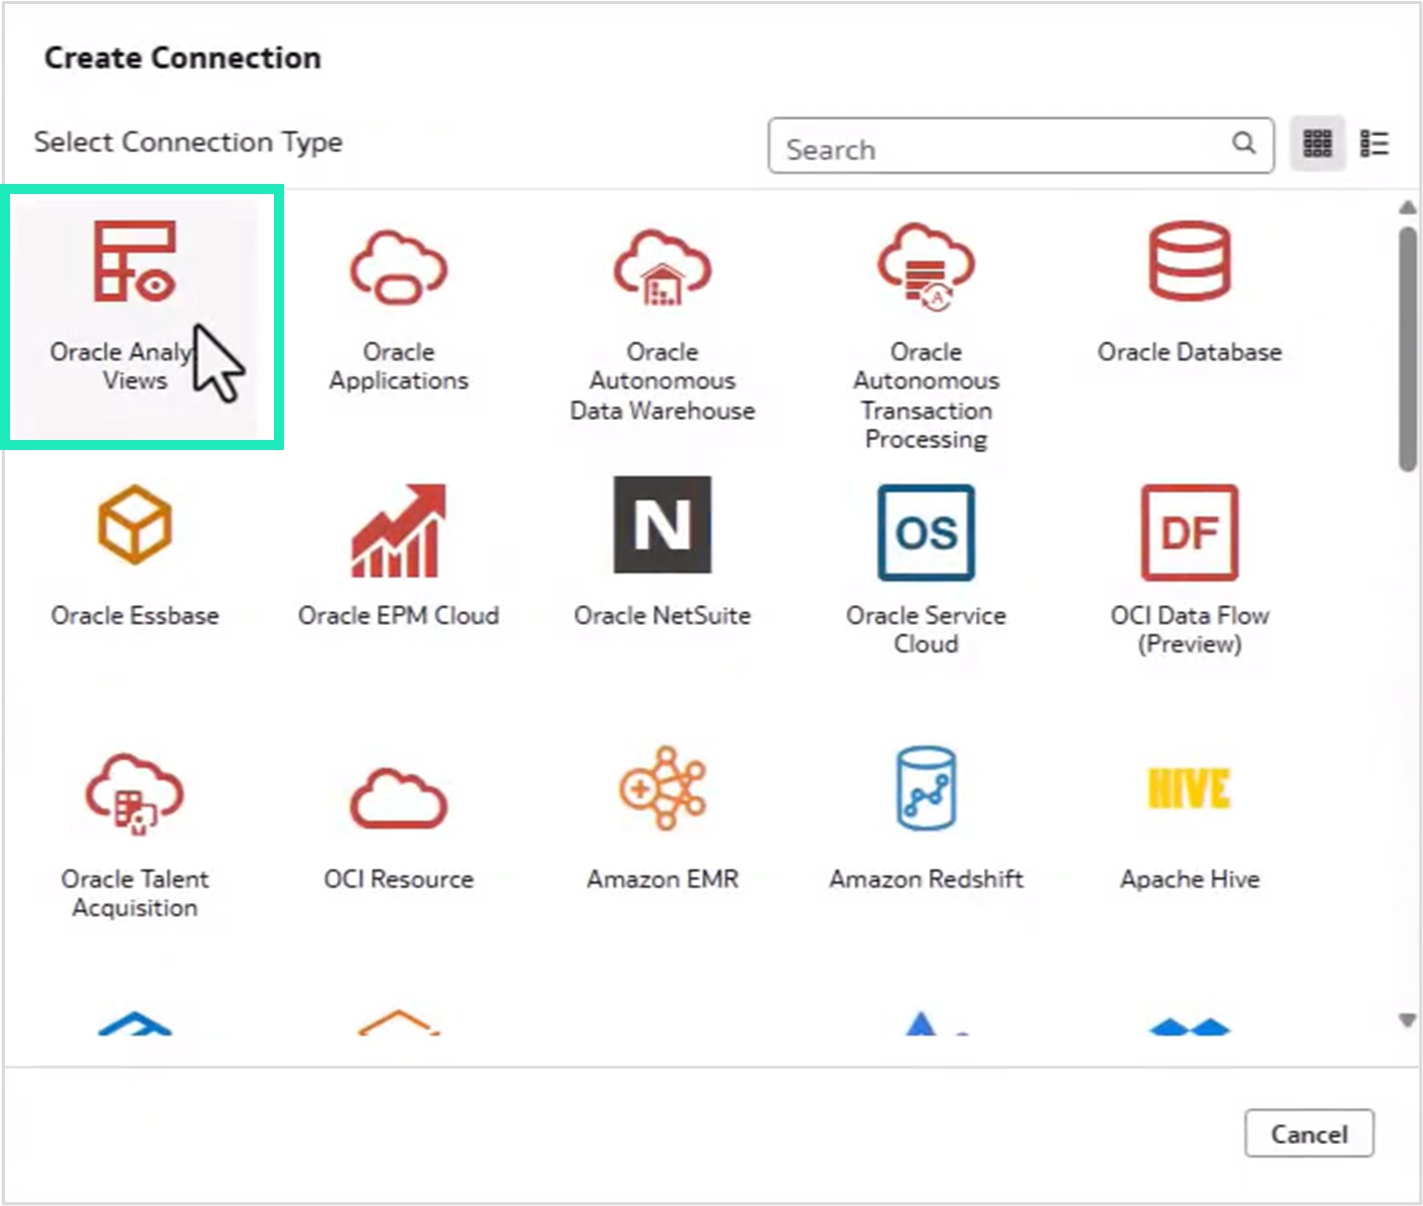
Figure 30: Different connection types
An important step in this process is to tick the System connection checkbox in the connection properties. This makes the connection available for semantic modelling; without it, the connection will not appear when creating semantic models:
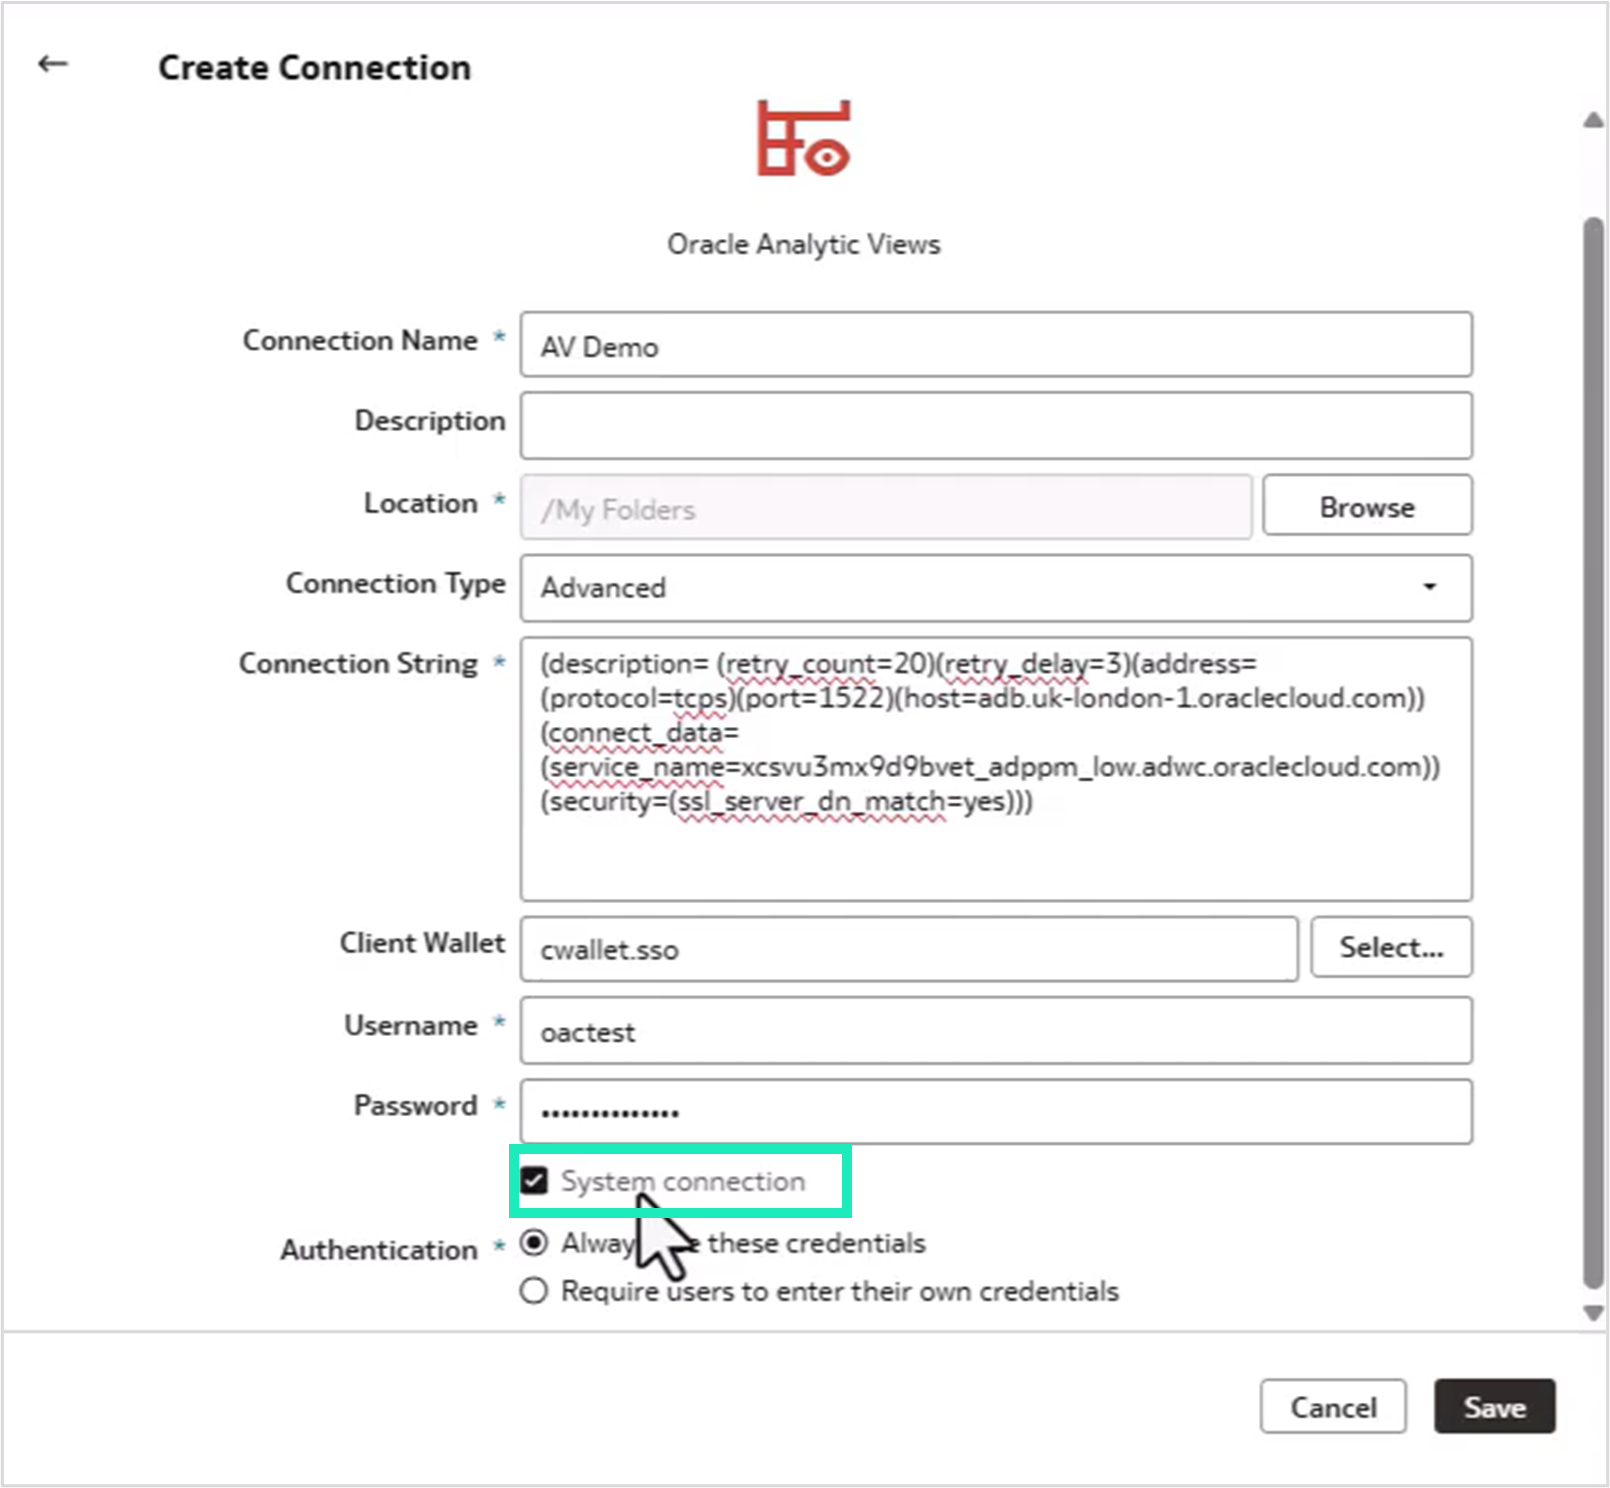
Figure 31: Create Connection window with System connection enabled
Once all the connection details have been configured, we begin building a new semantic model from the home page by selecting Create and then Semantic Model. Next, we select Start with an Empty Model. The process involves configuring three layers: Physical, Logical, and Presentation:
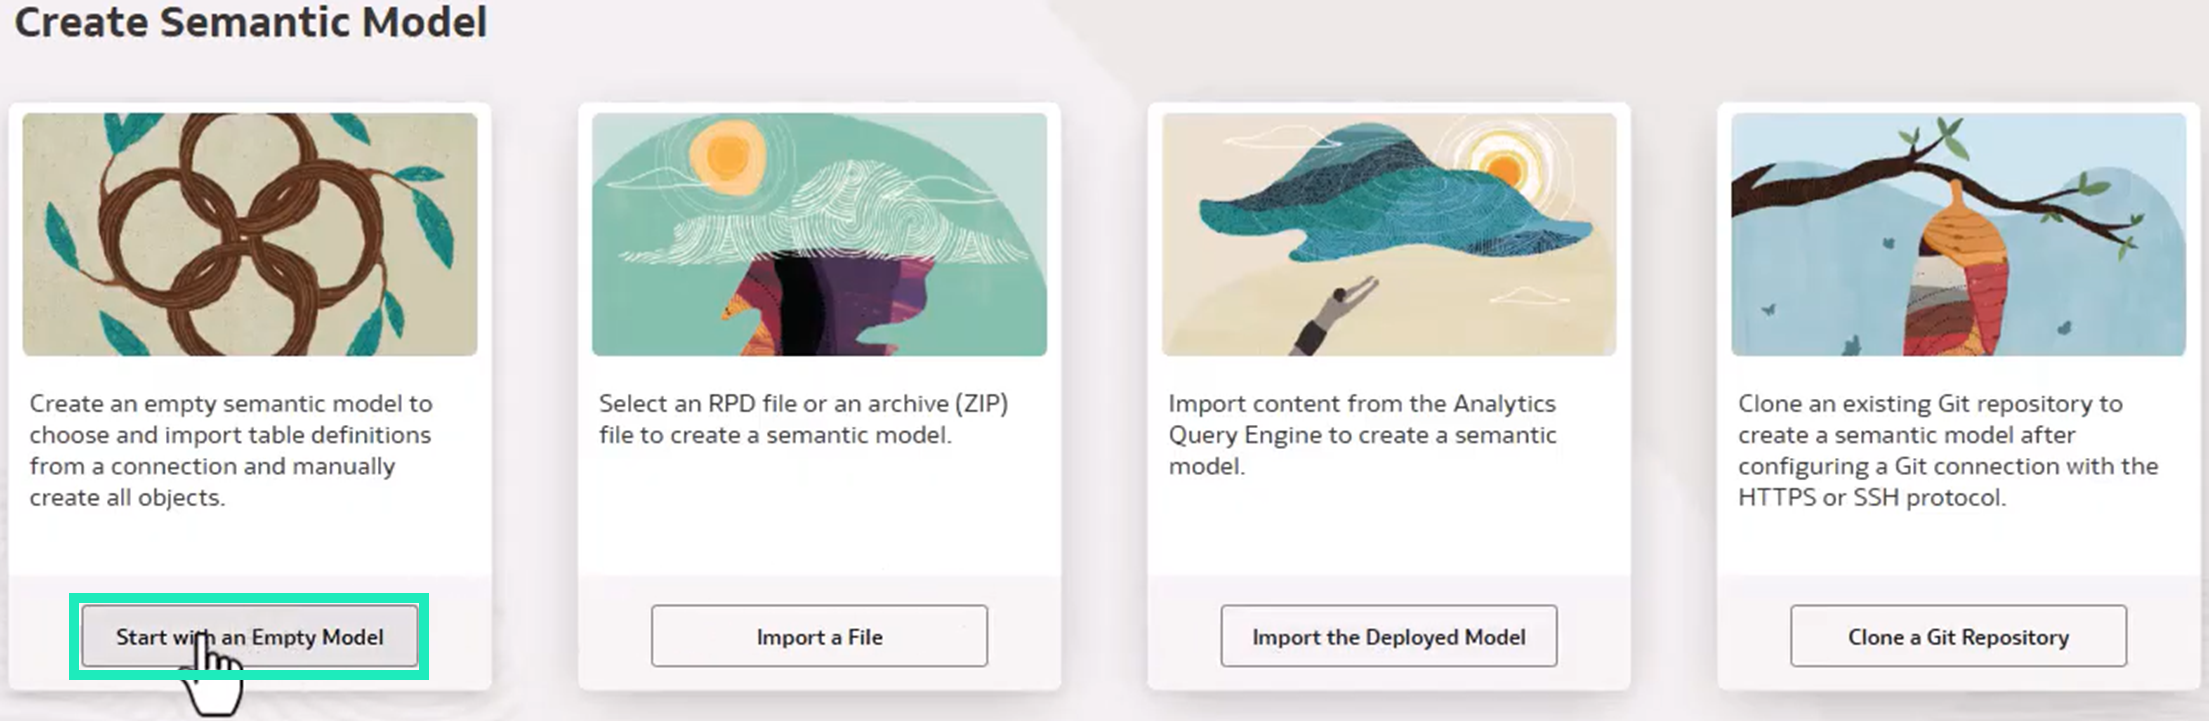
Figure 32: Create Semantic Model options
In the Physical layer, we can see the connection with a default database, which we rename to something more meaningful like “AV Database”. In the database properties, we change Database Type to Oracle Analytic Views. When we make this change, a dialogue box asks for confirmation, as it affects how OAC treats the database objects:
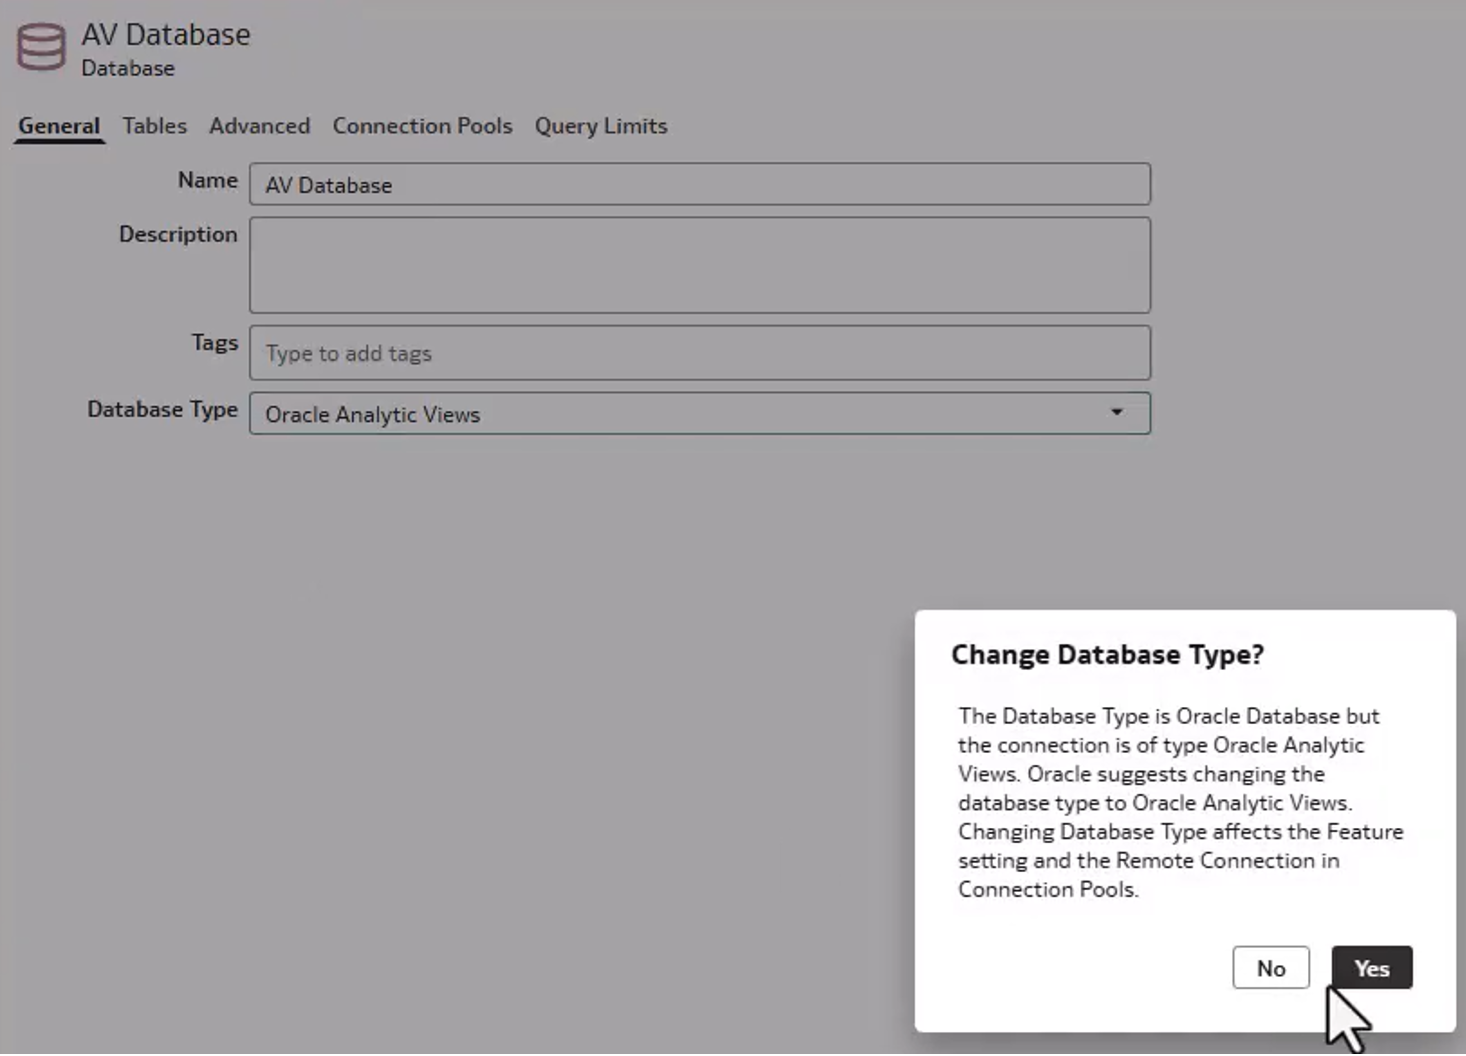
Figure 33: Change Database Type dialogue box prompting a switch to Oracle Analytic Views
Once the configuration has been updated, we can import an Analytic View by going to the Tables tab and dragging the required view from the connection schema to the Tables area. For example, dragging SALES_AV from the OACTEST schema imports the full view structure.
The Analytic View structure is automatically recognised, and in the Physical layer we can expand the view to check its components, including measures (fact data), dimensions (CALENDAR, GEOGRAPHY, and PRODUCT), and the predefined joins between them:
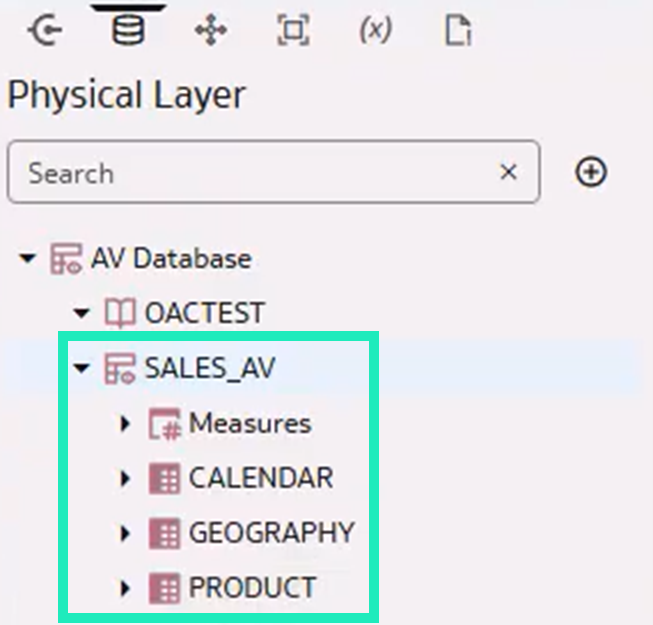
Figure 34: Physical Layer with SALES_AV expanded
Moving to the Logical layer, we create a new business model called “AV Business Model” to represent the analytical structure. We then drag the Analytic View from the Physical layer into the new business model. OAC automatically identifies the fact tables and dimensions, and also preserves all the hierarchies defined in the source Analytic View:
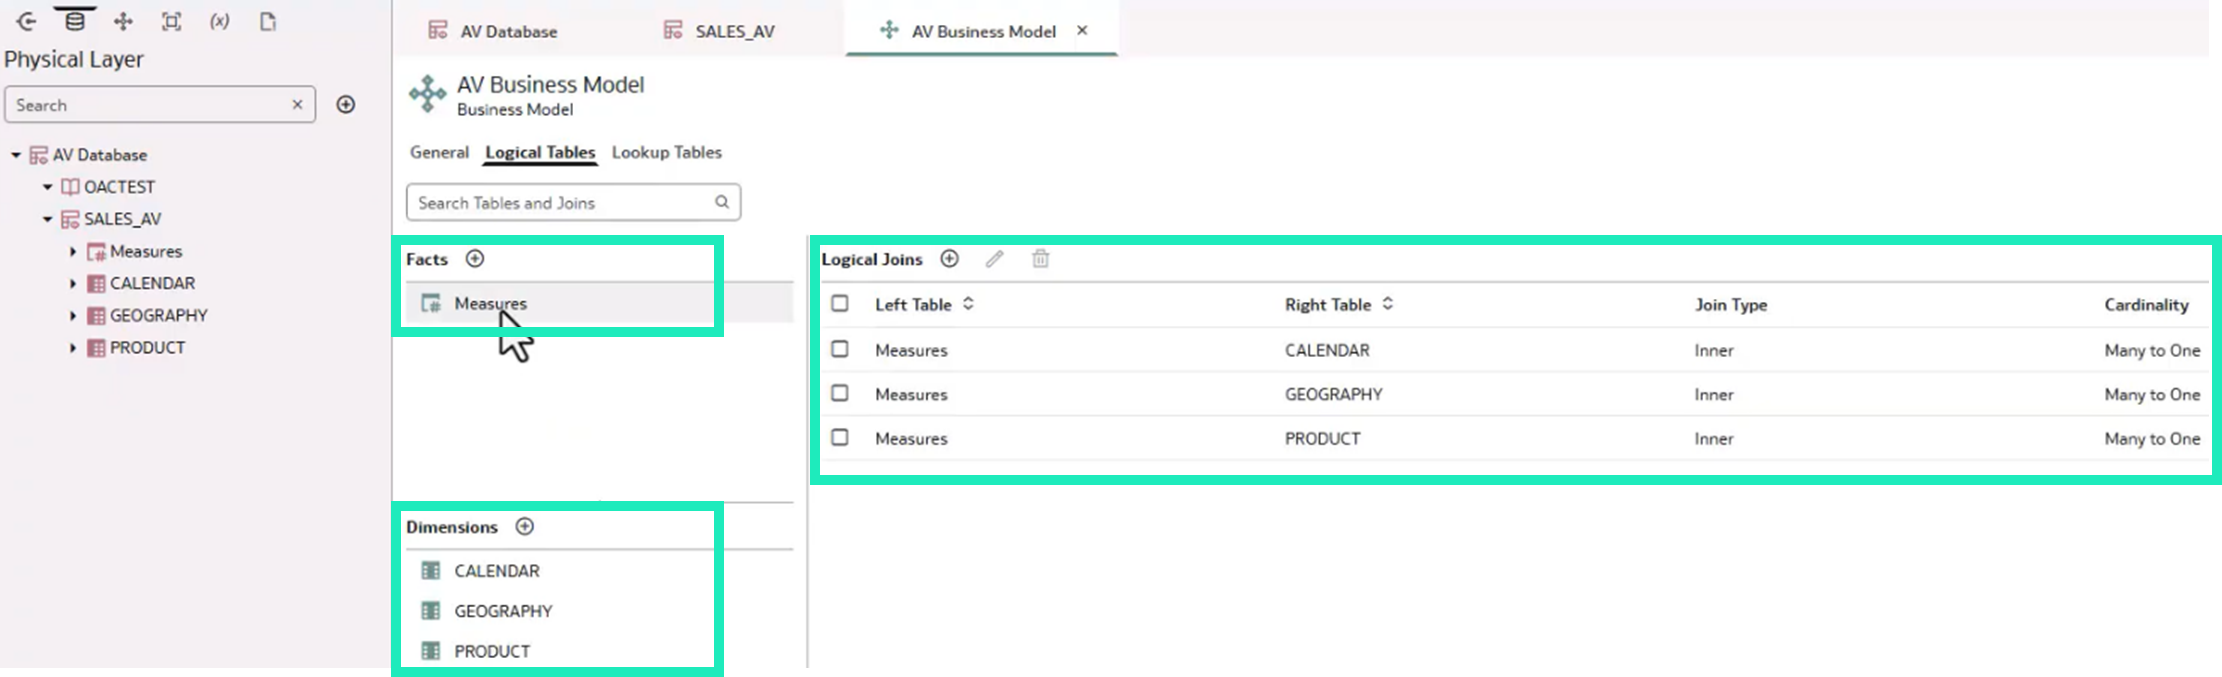
Figure 35: Business Model details
For example, in the GEOGRAPHY dimension, the hierarchy is retained as defined in the database. We can check this in the Hierarchy tab, which shows the complete hierarchy structure: TOTAL -> REGION -> COUNTRY -> STATE_PROVINCE, imported directly from the Analytic View:
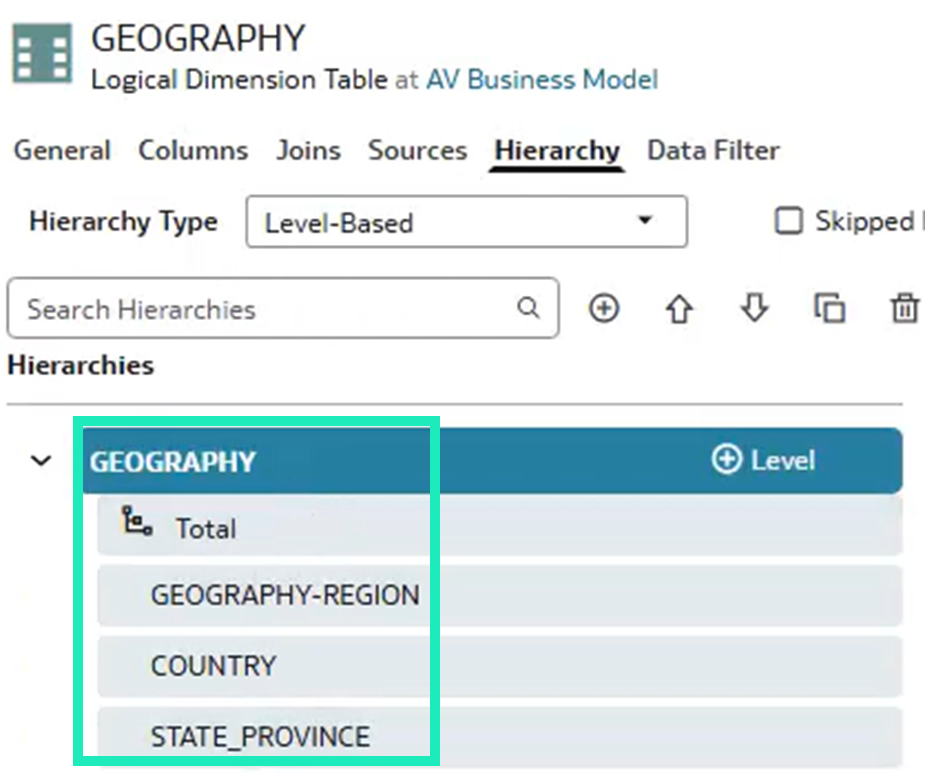
Figure 36: GEOGRAPHY dimension Hierarchy tab with its level-based hierarchy
Finally, we create a subject area in the Presentation layer. After creating the AV Sales subject area and linking it to the business model, we add the full model structure by dragging it into the subject area. The semantic model then automatically generates the dimensions and fact tables based on the business model definition:
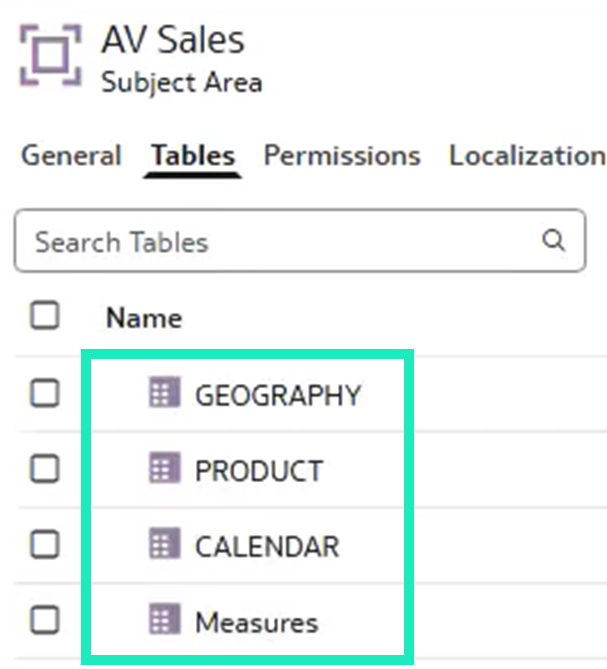
Figure 37: Presentation layer details
Before we can use the model, we run a consistency check to ensure everything is configured correctly and free of errors. The validation process reviews the entire model structure and identifies any issues that need our attention.
Fine-Grained Permissions in the Oracle Analytics Semantic Modeler
This update also brings us fine-grained permissions for semantic model development, especially relevant in organisations with strict governance policies, where separating development activities from deployment privileges is essential.
Previously, users with the BI Data Model Author role had full permissions for semantic modelling, including the ability to deploy models. While this can work well in smaller teams and environments, larger organisations need tighter control. Enterprise teams typically have dedicated administrators responsible for reviewing and approving semantic models before they reach production, rather than allowing developers to deploy changes directly.
To support this, OAC has introduced a new permission called Create and Edit Semantic Models, which decouples model authoring from deployment. You can find it in the Console under Roles and Permissions. With this permission, teams can define custom application roles (for example, Semantic Model Developer) that allow users to build and edit semantic models without granting deployment access. Users assigned these roles can complete development tasks, but they will not see the Deploy option in the interface.
In practice, users can be assigned the following roles:
- Users with the traditional BI Data Model Author role have full access, including the ability to import deployed models and deploy changes; they can see the Deploy option in the page menu.
- Users with the Create and Edit Semantic Models permission can build and modify models, but they cannot import deployed models, and neither can they see the Deploy option in their interface.
For a deeper look at the foundations of the Semantic Modeler, including its core concepts and modelling layers, refer to our previous blog post here.
Conclusion
This January 2026 update continues Oracle’s steady pace of improvements across OAC, with updates that benefit both business users and technical teams.
On the AI side, domain-specific agents and built-in feedback options make it easier for users to ask questions in natural language and to flag responses that miss the mark. Features such as outlier and cluster detection also make common analysis tasks more accessible, without requiring much technical knowledge.
Several enhancements focus on day-to-day workbook maintenance and delivery: dataset aliases help workbooks to keep their references when datasets are deleted and recreated, and shared images and multiple data actions on table columns also make it easier to apply consistent branding and build more interactive experiences, without extra complexity.
For semantic modelling, support for Oracle Analytic Views brings established dimensional structures into the Semantic Modeler, and fine-grained permissions provide even more control over who can develop models and who can deploy them.
We should mention that some features described in this post, particularly those related to semantic models, were not fully enabled in our demo instance at the time of writing. In those cases, we have relied on the official Oracle documentation for the functional details.
This update also includes additional enhancements we have not covered here, such as vector layer support in maps, higher data limits for network visualisations, improvements to the data flow designer, and geometry column support in datasets for spatial calculations. Oracle’s release notes provide full details on all available updates.
At ClearPeaks, we are dedicated to helping organisations to roll out Oracle Analytics in a way that is secure, maintainable, and easy for users to work with. If you would like to see how these new features apply to your environment, reach out to us now to plan the next steps in your OAC journey!