
13 May 2020 Tableau 2020.2 New Data Model
Up until now, Tableau had been considered strictly a visualization tool; in terms of data processing, Tableau Desktop offered the possibility of combining different data sources or tables using joins and data blending, but the analyst may need to build a data model to format the data.
Tableau’s 2020.2 version already allows us to explore one of the most anticipated features: a new approach for data modelling that will make the analysis of data across multiple tables much easier.
1. Data Model Analysis
These new modelling capabilities provide different levels of detail: first, a logical layer in which the associations among the different tables are built. After that, a physical layer in which we will be able to combine data using joins. Each table in the logical layer contains one or more tables in the physical layer.
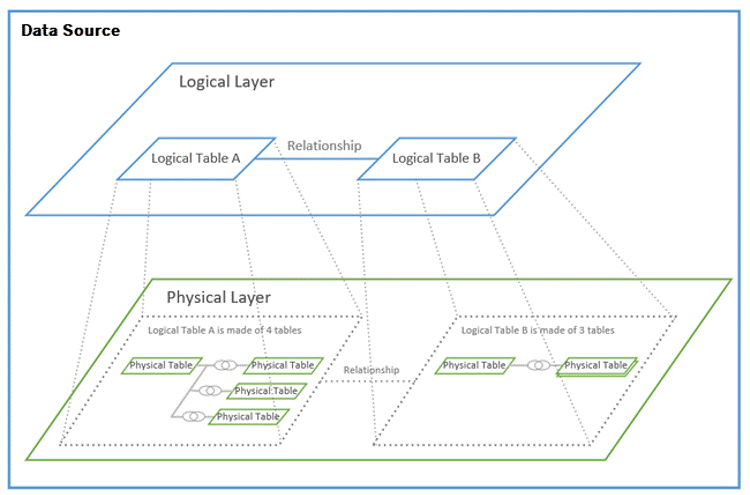
Figure 1: Tableau 2020.2 Data Model Scenario
Source: Tableau Online Help
Let’s take a deeper look at these two layers:
1.1. Logical Layer
Starting in the data source tab from Tableau Desktop, we find that the default top-level layer is the logical layer.
After dragging some tables to the pane, we see that Tableau automatically creates the relationships between these tables and instead of a join operator we find some related fields.
Figure 2: Tableau 2020.2 Logical Layer
Tableau will choose the fields to create the relationships between the tables, although it is also possible to update manually or even create a set of related fields. Tableau will also apply some performance options so that the data model works properly, but just in the same way as with related fields, users can modify these settings to match their needs. Consequently, Tableau figures out how to handle different levels of detail and simplifies the aggregation of calculations such as averages or totals.
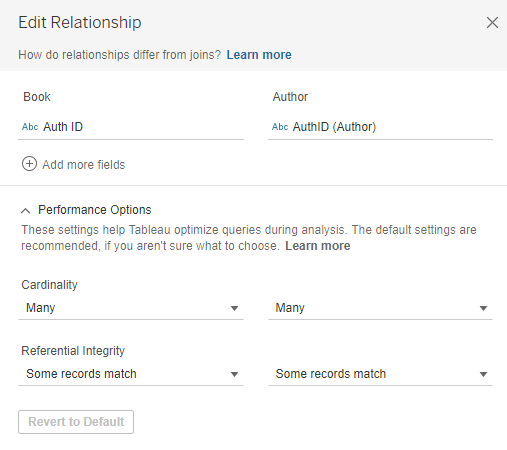
Figure 3: Edit Relationship set-up
1.2. Physical Layer
In previous versions of Tableau the data model consisted only of a physical layer where the user could set up the normal joins and unions between the tables. The result is an extended single table with all fields included.
Joins require the user to specify the join type and clause, whereas relationships in the logical layer are automatic. There still might be occasions on which we need a join, for instance, to create a calculation.
To open the physical layer just double-click on one table from the logical layer and bring out another table. We will now experience the usual join set-up that Tableau had been providing before; likewise, blends and unions are built in just the same way.
Figure 4: Tableau 2020.2 Physical Layer
1.3. Data Pane
Once we have finished modelling our data, move to the Sheet tab. The first thing we notice is that there is a different approach from the data pane: each logical table has a division between dimensions and measures. Since the data source is no longer combined into a single compressed table, we find that each related table is separate, and we do not have the number of records metric either. Instead, each table has a count field that represents the local number of records. Similarly, any new calculation, group or set created in the sheet will remain within the table for which it is relevant.
One of the main advantages of this new layout is that it is more intuitive to understand measures as they stay in their needed tables, helping the user understand the context.
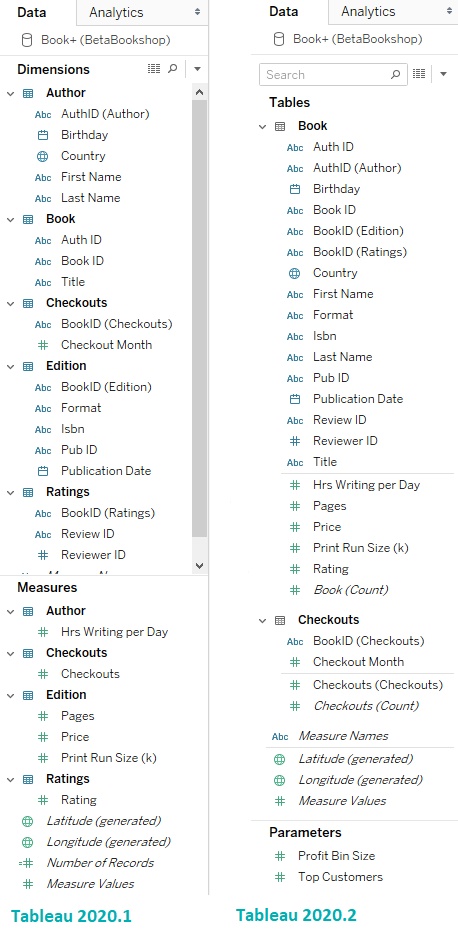
Figure 5: Tableau 2020.1 vs 2020.2 new data pane layout
2. Case example: preventing data duplicates
In this section a practical example will be used to explain how this new data model can help us prevent duplicates.
Using the same data source BetaBookshop, we’ll analyse the daily writing hours per author and compare the results in the different Tableau 2020.1 and 2020.2 versions. Let’s bring title and Hrs Writing per Day to the analysis and sort the results. Even though it is a pretty straightforward analysis it is already noticeable that the total writing hours do not match in both Tableau versions (see Figures 6 and 7).
So, why do we get different results for the same analysis?
In Tableau 2020.1 and previous versions, using joins over several tables would result in a single merged table containing all data. Although data from just the Book and Author tables is being used in this example, Tableau is joining all four tables included in the model. Duplicates exist due to the join with the Checkouts table and therefore it would be necessary to use level of detail calculations to control the right aggregation level. Another possible solution could be to select the Assume Referential Integrity option from the Data menu. This option allows Tableau to join tables in the query only for the fields that are specifically referenced in the view. Note that this option may only be appropriate if your data has referential integrity.

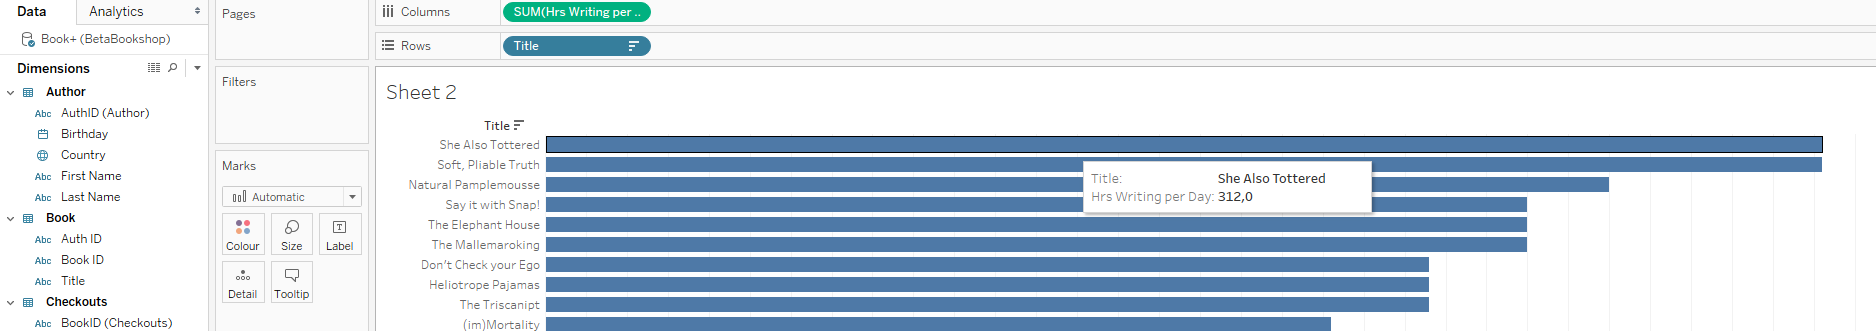
Figure 6: Tableau 2020.1 example: data model and visualization
The new data model from Tableau 2020.2 relates the tables and keeps their metrics separate from one another; joins will only be executed if necessary. For this analysis, Tableau is only relating the tables within the Book logical layer and skipping the join to the Checkouts since it is not needed for visualization. Tableau automatically controls the aggregation level.

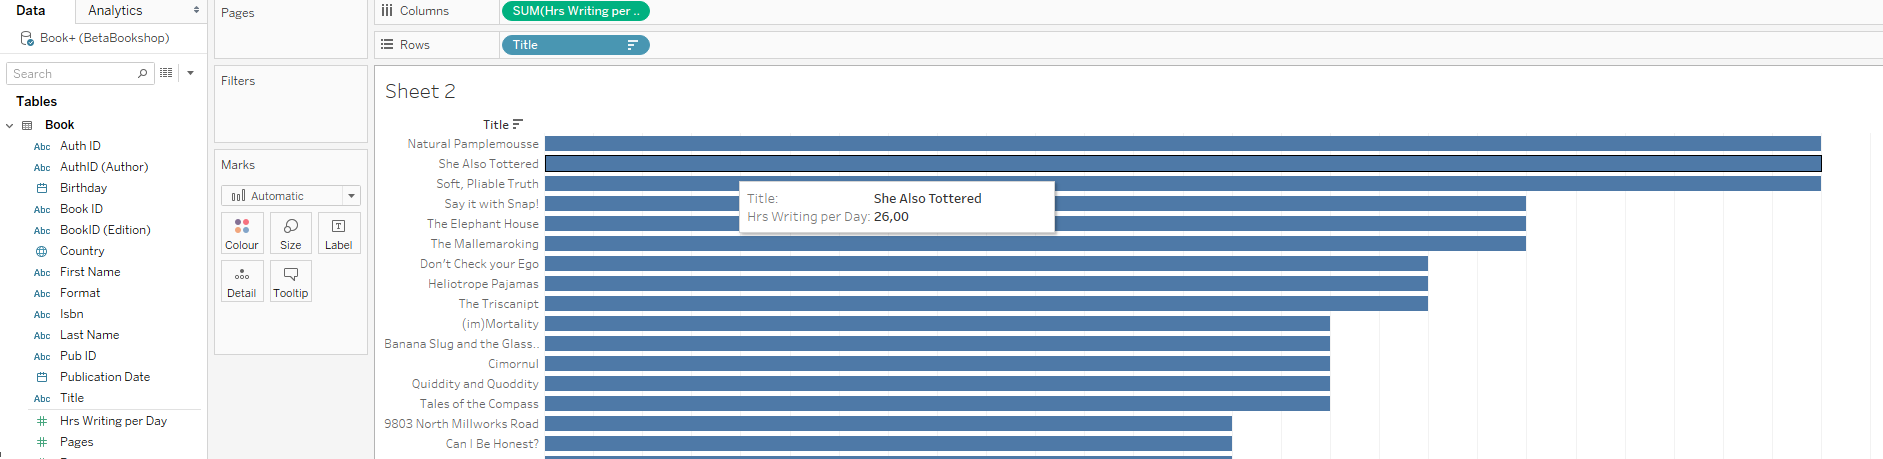
Figure 7: Tableau 2020.2 example: data model and visualization
Conclusion
With the latest 2020.2 release, Tableau is opening up to the creation of dimensional data models or star schemas that had been commonly used in data warehousing as a way of integrating data from different sources and improving performance.
Simplifying the combination of data by visually creating logical relationships, Tableau will automatically relate the data and bring it together during the analysis.
If you’d like to learn more about the new version of Tableau and how its capabilities could help your business, don’t hesitate to contact the experts here at ClearPeaks.