19 Jun 2014 Tableau 8.2: New Features
Good news for all Tableau fans! The new release, version 8.2, is now available! We have been selected to participate in the testing program of Tableau 8.2 Beta. Lucky you to be reading this article, as you will have the privilege to read about some of the new features being included in the new release. In this article I’m introducing you some of the hottest functionalities in Tableau 8.2:
- Visual Connection to Databases
- Story Telling Object
- Updated Maps
- Tableau Server Improvements
- Tableau Desktop for Mac OS
Keep reading and get as excited as I was when going through them for the first time. It’s worth spending 5’ reading this article. You will not regret that.
1. Visual Connection to Databases
This new feature will greatly simplify how we are currently building data extract queries. It’s a completely redesigned data connectivity view that allows the designer to build different types of joins (inner, left, right, full outer) between tables in a visual and very intuitive way. The steps to follow are:
- Select the data source: Nothing has changed here. You must select the data source type and then fill in the appropriate details to connect to the selected data source.
- Select the tables: Drag and drop the selected table into the canvas on the right.
- Set the joins: Click on the joins and set the join type as well as the matching columns.
- Verify if the joins are correct in the Preview: Check the query results to validate the joins.
- Click on “Go to Worksheet” to start working on the new analysis: Once you have done all the above, click on this button to start designing your analysis.
Note that you will be able to choose the connection type. The options are:
- Live: Queries will be done to the data source to retrieve the data.
- Extract: Queries will be done to an extract of the data instead of the real data source.
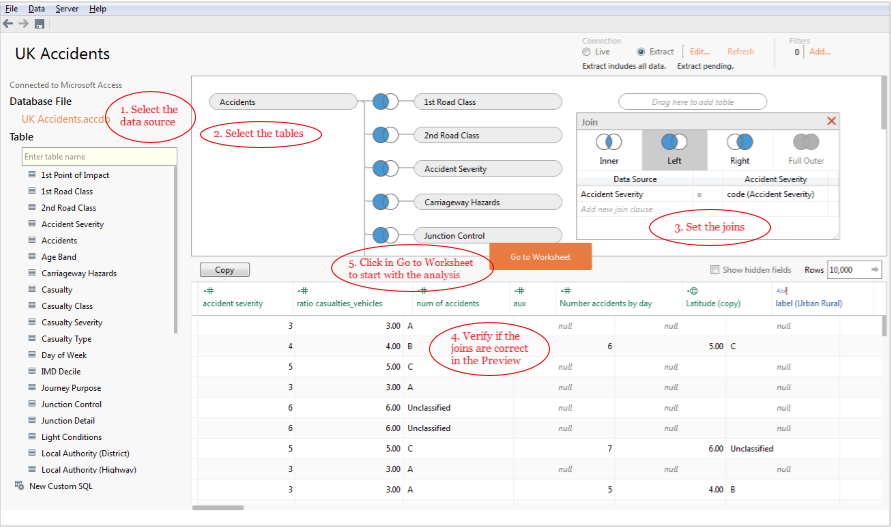
Below you can find two screenshots so that you can compare this functionality between Tableau 8.1 and 8.2:
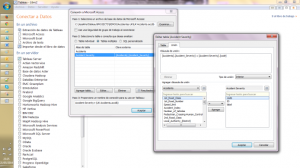 | 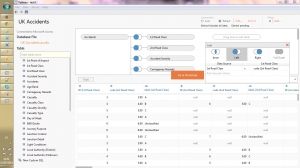 |
| Data connection version 8.1 | Data connection version 8.2 |
Having said this, news in data connection do not finish here. There are improvements in the following connections sources too:
- Microsoft Excel and Text files: Improved detection of field types, larger amount of columns, Time type seconds recognition, percentages as number recognition…
- SAP HANA: Variables and input parameters.
- OAuth: Support for SalesForce.com, Google Analytics and Google BigQuery
- Google BigQuery: Native support provided
- Splunk: Improved connection.
2. Story Telling object
Story Telling provides the user a brand new experience in data analysis as it guides the user through different analysis following a predefined path. The predefined path is defined by the Story Points, a sequence of steps that the user can walk through as he or she explores the data. However the user is not forced to go through every single step to get to the analysis he or she is most interested in. The user can jump into that step without the need of visualising the previous ones. Each Story Point or step in the Story Telling is showing the user an analysis or even an entire dashboard.
Proceed to the following steps in order to create a Story with Story Telling:
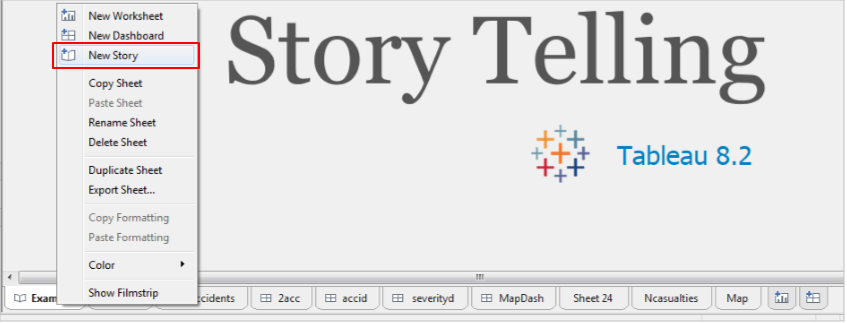
- Create a new Story
Add a new Story by clicking on “Story” > “New Story” in the Menu bar.
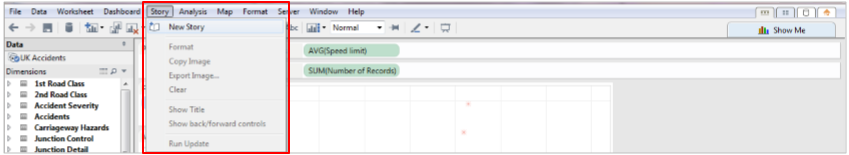
You can also create a new Story by right clicking on the Analysis/Dashboards/Stories tabs and selecting “New Story”.
- Embed sheets and dashboards into Story boards
The sheets and dashboards are displayed as on the left pane of the board as in the previous versions of Tableau. To insert them into the Story, just drag & drop them into the right pane. <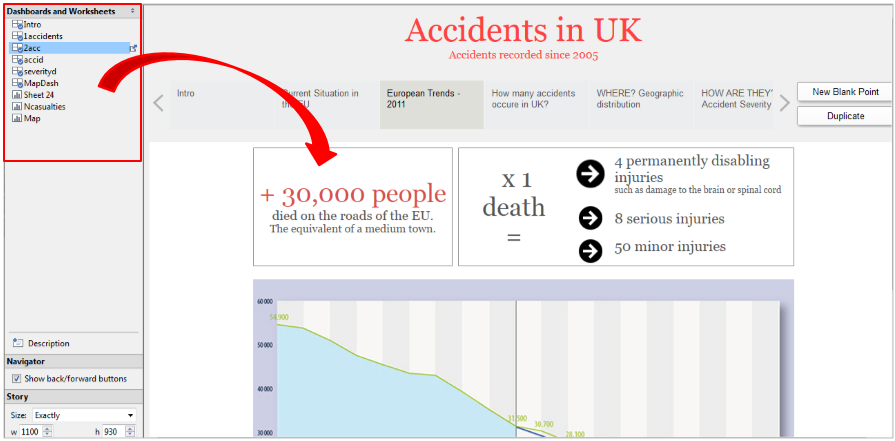
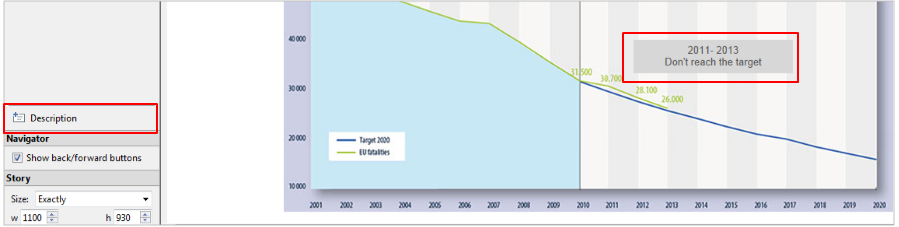
- Add annotations
The analysis won’t lose neither the annotations, highlights nor filter capabilities once embedded in the Story board. On top of that, we have additional description capabilities to add to the Story board to emphasize important findings.
- Print the stories in PDF
Click on “File” > “Print as PDF” and you will save the Story Telling object as PDF showing each step in a separate page of the PDF document.
- Show in full screen
Click on “Window” > “Presentation Mode” or press F7 to show the Story Telling object in full screen as it can be done with dashboards.
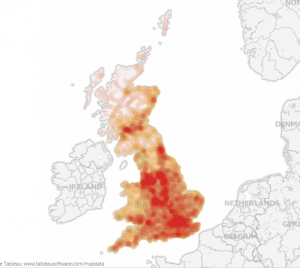
3. Updated Maps
Tableau is improving the visualization in maps, one of the most powerful capabilities of the product. The data content used to create the maps is including the latest set of data from OpenStreetMap. This engine allows you to zoom down into 16-steps of zoom, WORLWIDE! You can check the visual impact of such changes by comparing the screenshots below:
 | 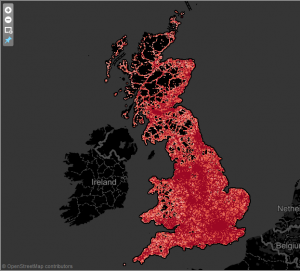 |
| Maps version 8.1 | Maps version 8.2 |
 | 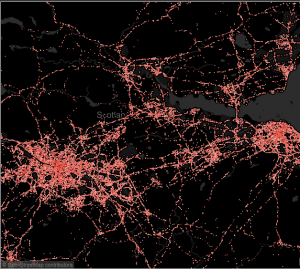 |
| Maps version 8.1 with 3 levels of zoom | Maps version 8.2 with 3 levels of zoom |
4. Tableau Server improvements
There are many improvements on the server side, mainly focused in simplifying the server administration. Some of these improvements are:
- Easier Log Access
- New Log Format
- Change Content Ownership
- Provision Sites with Site Export/Import
- Server APIs for Administrators
- Responsive Marks
- Cross-version compatibility
- Disable Web Authoring per Site
- Support for Multiple IP Addresses
5. Tableau Desktop for Mac OS
The user base of Tableau is made of a heterogeneous group of people. And guess what? Some of them are using Mac OS based computers!! From version 8.2 they will be able to analyse and discover data using Tableau directly from their preferred platform: Mac OS. The old days of having another computer or even a virtual machine running Windows to be able to work with Tableau Desktop are gone. Here are the highlights of this improvement:
- All the Tableau products (Reader, Public and Desktop) will all be available for Mac OS.
- The Mac OS version will support high resolution Retina displays and will use the same files (TWB, TWBX, TDE, and TDS) that are supported on the Windows version of Tableau Desktop.
- The Tableau users could use the same license for the Tableau Desktop on Windows and Mac. According to Tableau, the installation on Mac OS will be plug and play: Install Tableau Desktop on your Mac and activate it with your existing license.
From the Mac OS lovers I can only expect to hear a word… “FINALLY!“
Conclusion
As you can see, most of the new features improve visualization, something that identifies Tableau as a data discovery tool. Remember that this post is based on Tableau 8.2 Beta version 4, so it’s sensible to changes until the final version is released. I hope this blog has helped you to get a better idea of how the new version looks like and how useful it will be in your future data discovery and analysis.
For more information, feel free to contact us at: www.clearpeaks.com