14 Dec 2020 Power BI Best Practices: Help Tooltip using Animated GIF
Sometimes when delivering a project to our clients, we worry about how they will interact with the dashboard. Will they be able to use all the implemented functionalities properly? If we could show them exactly how to use each of these functionalities, we could improve their experience. However, coaching end-users on how to use the application could be very time-consuming. Therefore, having a small animation that guides them through the dashboard could be really helpful! In this article, we will show you how to transform your Help Tooltips in short animated videos (GIFs) that will do exactly that.
1. Help tooltip
To explain some functionalities in a Power BI dashboard, we use the help tooltip to offer some clarifications re usability. We can display a text giving the user some tips on how to interact with the report.
In the following image, we can see a tooltip explaining how to use the drill-through option available in the map. This will be clear enough to developers, but what about the end-user?
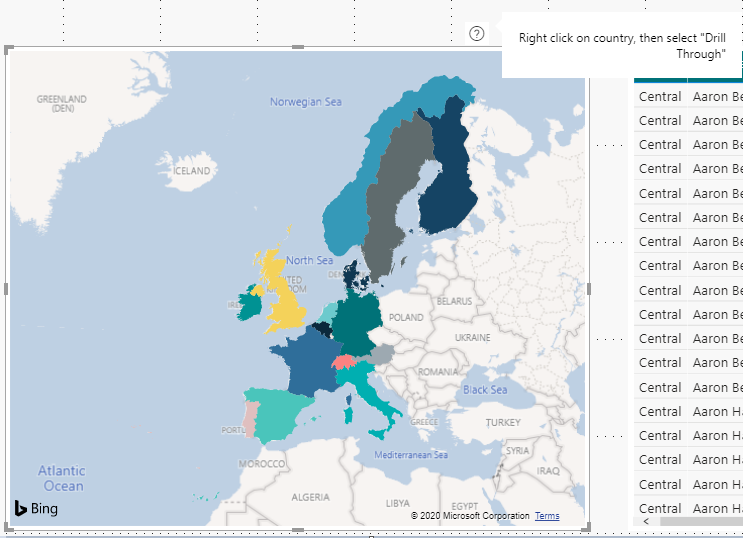
Figure 1: Text tooltip.
What if – instead of plain text – we show a short video describing how to do this drill-through step by step?
Figure 2: Animated GIF: Drill-through.
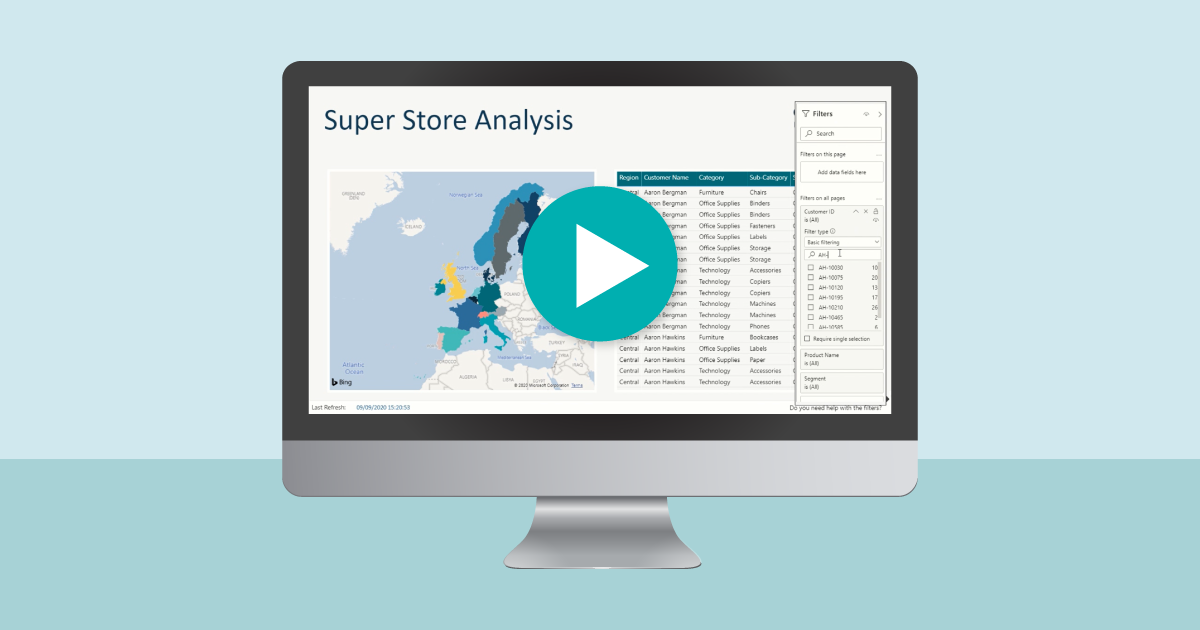
We can do this to demonstrate any functionality. In the below image you can see an example using filters:
Figure 3: Animated GIF: How to Filter.
Using a short video explaining how a user can interact with the design could be really useful; we can make sure that some tricky functions are understood.
1.1. How to create GIFs
First, we have to create the GIF of the content that we want to display; to generate the necessary video, we recommend using the PowerPoint option to record the screen (Go to Insert, Screen recording).
Once we have recorded the video we can also use PowerPoint to create the GIF. In this Microsoft tutorial we can see how:
1.2. Power BI Configuration
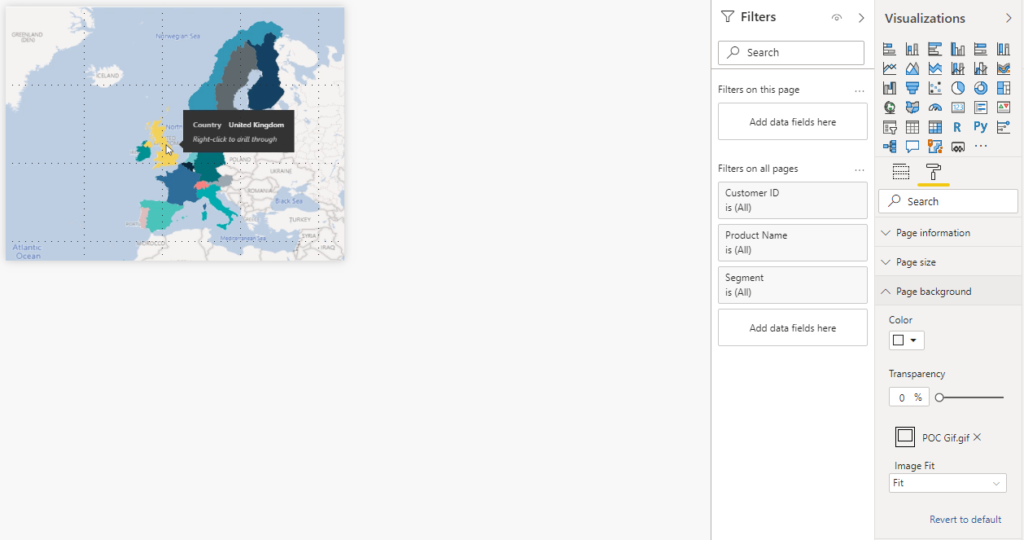
Figure 4: GIF PBI configuration.
The key to displaying a GIF in Power BI resides in the page background configuration. In this configuration option we can attach a GIF, to be displayed as a “video” and not as an “image”.
In Page Size we can configure the size of the displayed GIF. The size that we configure in this point is the one that the GIF will use when it is displayed on the main page where we want to explain a functionality.
Be careful with the transparency: set by default to 100%, the video will be transparent, so we must set transparency to 0%.
Once we have configured the GIF that we want to display we attach it to a visual header.
To do this, click over the chart or item that you wish to clarify using the GIF. Go to the configuration menu, activate the visual header. A new tab will be displayed: Visual header tooltip.
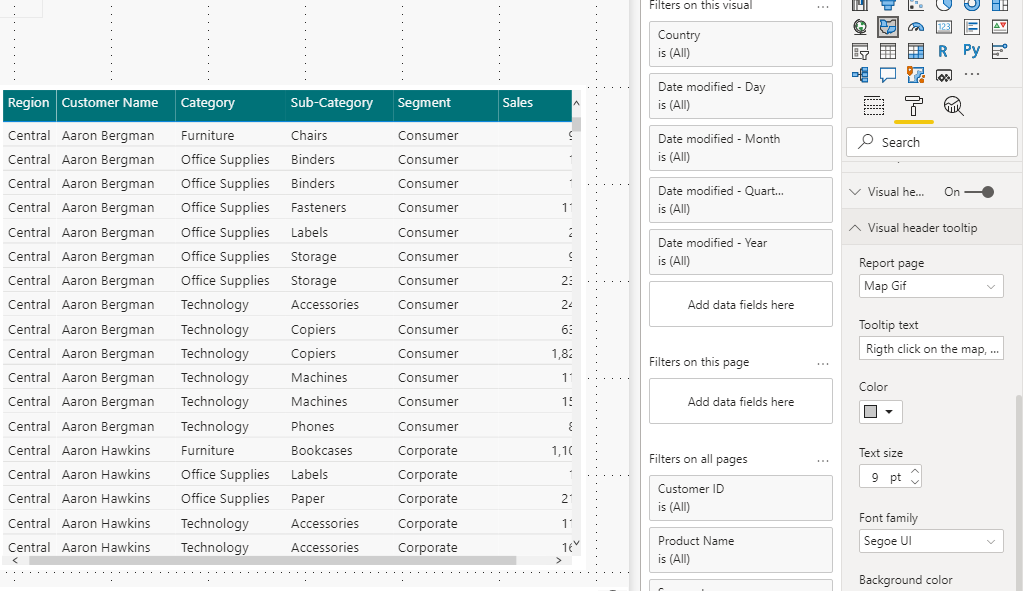
Figure 5: Display GIF PBI configuration.
In this new tab we can configure what will be displayed in the visual header tooltip. We select the page where we want the GIF to be shown. Once this has been configured, when the user puts the mouse over the tooltip the GIF will be displayed.
Conclusion
With GIF visualizations we can show the end user exactly how to interact with a dashboard design, resulting in an excellent user experience.
If you are interested in GIF visualizations to satisfy your clients’ needs contact us, and we will give you a helping hand!