01 Oct 2025 Azure Kubernetes Service Observability with Azure Monitor, Managed Grafana & Prometheus
Kubernetes (K8s) has become the backbone of modern container orchestration. As cloud adoption has increased, platforms like Microsoft Azure offer a managed Kubernetes service to simplify deployment and to reduce day-to-day operations by shifting control plane management to the provider. Azure Kubernetes Service (AKS) abstracts the control plane and handles cluster operations, like automating updates, node provisioning, scaling, and networking, whilst integrating monitoring and security. This dynamism creates an observability challenge: issues such as pod restarts, sudden memory spikes, or unexpected latency must not only be detected but also understood in order to be resolved.
Typically, monitoring means preconfigured metrics and dashboards to alert you to expected performance issues, such as a node exceeding a 75% CPU load when running an application. On the other hand, observability is more like an exploration toolkit, a richly instrumented environment for exploring the root causes of unexpected issues or behaviours. In short, monitoring tells you that something has happened, and observability explains why.
Traditionally, observability is based on three pillars (metrics, logs, and traces), but in more complex cloud environments, additional elements like tags, metadata, or profiling can provide richer context and speed up the process of understanding why something is happening within a system.
Let’s focus on the three pillars:
- Metrics are numerical measures that quantify system performance. They answer questions like what is happening and how much.
- Logs are detailed event records from applications and the platform. They explain what happened and often why.
- Traces map the end-to-end path of a request across components and services. They reveal from where an issue originates and which path it takes.
Together, they enable teams to detect problems (metrics), explain them (logs), and identify the exact step or component involved (traces).
In previous blog posts, we’ve explained how to add an observability layer to a local Kubernetes cluster and how to use Grafana Cloud to bring observability to an Azure AKS cluster. Both approaches present interesting insights, but are fully decoupled from Azure.
In this blog post, we’ll turn our focus to the native options that Azure provides for embedding observability into AKS, covering these three pillars. We’ll start with the basics, such as Azure Monitor Metrics (metrics), Log Analytics (logs), Application Insights (traces), and Dashboards with Grafana (Preview) and then progressively swap them for more powerful alternatives, including Azure Managed Prometheus (metrics), Grafana Loki (logs), Grafana Tempo (traces), and Azure Managed Grafana (advanced dashboards).
Azure Observability
Azure Observability starts with Azure Monitor, the centralised platform for monitoring that collects telemetry data (metrics, logs, and traces) so you can analyse your AKS performance and trigger alerts or automated actions accordingly. It includes native features such as Metrics, Log Analytics, Application Insights, Workbooks, and Dashboards with Grafana (Preview).
Let’s take a closer look at these integrated functionalities and see how they relate to the three pillars of observability.
Azure Monitor Metrics collects numeric data (metrics) from AKS as soon as the cluster is up and running. These metrics can be shown on simple Azure dashboards to display basic cluster or node data, such as CPU and memory utilisation, cluster status, and more. However, the dashboards are quite static, with limited customisation options based on predefined aggregations.
For logs, Azure Monitor relies on Log Analytics as its backend. While metrics are available by default at cluster creation, container logs are not collected automatically, so you need to configure a Log Analytics workspace and enable collection. Logs are stored in structured tables and queried using Azure’s Kusto Query Language (KQL).
Azure Monitor uses Application Insights to capture distributed traces, such as requests, dependencies and exceptions, from AKS workloads. This resource is linked to your Log Analytics workspace, where traces are stored in dedicated tables for later querying with KQL.
To take action based on collected data, Azure Monitor provides Alerts, which continuously evaluate your AKS metrics and logs to trigger notifications or actions when certain conditions are met.
A good way to bring these features together is through Azure Workbooks, a flexible, interactive canvas for creating rich visual reports. Workbooks allow you to combine metrics, logs, traces, alerts, and text in one place, letting you perform a guided analysis without leaving the Azure portal.
For more advanced visualisations, you can use Grafana, the open-source data visualisation and analytics platform for monitoring and observability. In Azure Monitor, it is integrated as Dashboards with Grafana (Preview) and it lets you build basic dashboards quickly. This option is zero-ops and free, but limited, as it only works with Azure Monitor data sources (Metrics, Log Analytics, and Application Insights) and supports just the essential features of Grafana: dashboards and Azure data sources.
Finally, let’s review the costs of maintaining this basic layer of observability in AKS. The features that incur costs are Log Analytics and Application Insights, which are billed based on data ingestion and retention (GB), and Azure Monitor Alerts, which are priced according to rule type, frequency, dimensions, and notification settings.
Let’s now take a look at the bigger picture of the basic observability system that Azure Monitor provides. Telemetry data is collected from AKS and stored in Azure Monitor Metrics and Log Analytics. From there, it can be used to power Application Insights, Workbooks, and Dashboards with Grafana (Preview) to provide the basic observability required. Finally, Alerts can be configured to respond automatically to issues as they arise.
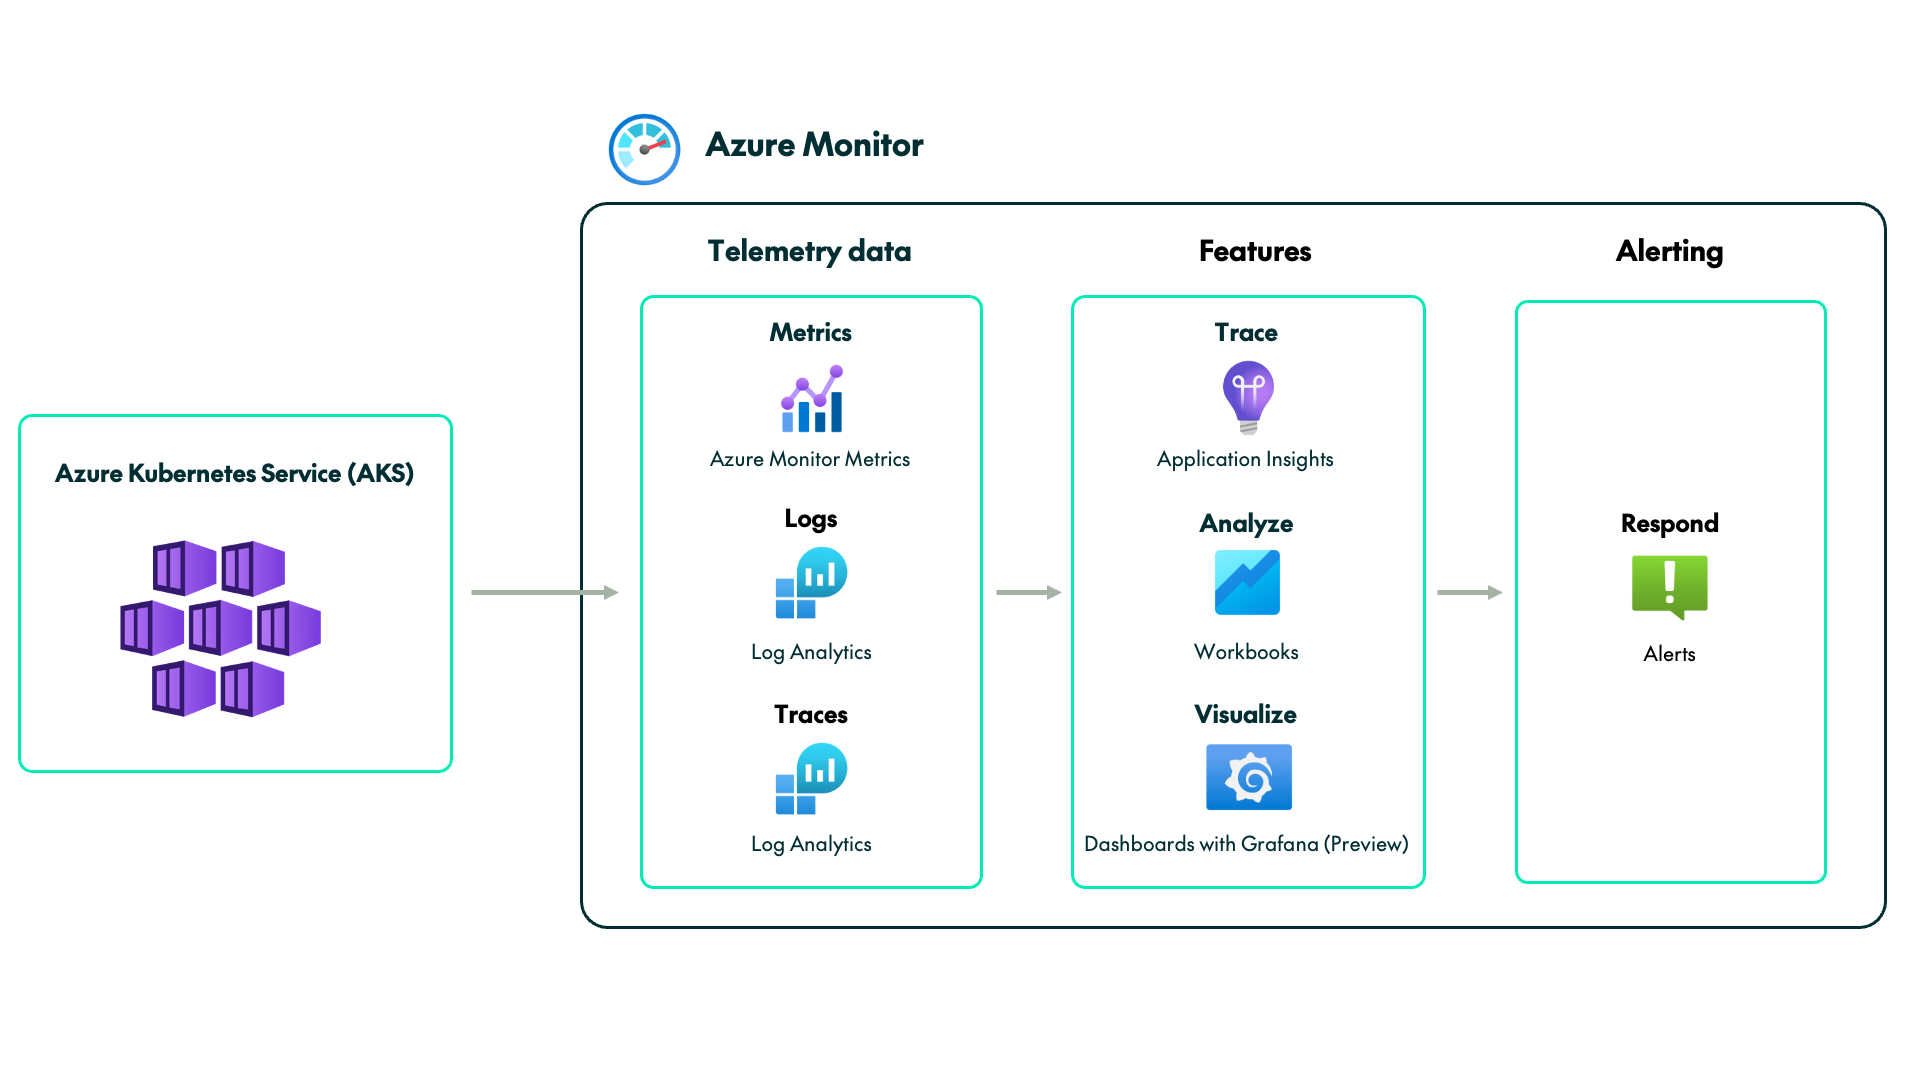
In summary, Azure Monitor is the easiest and fastest way to add observability to your AKS cluster. As a native Azure service, it’s available from day one and covers the three core pillars: metrics (Azure Monitor Metrics), logs (Log Analytics), and traces (Application Insights), which can be analysed together in Workbooks or visualised in Dashboards with Grafana (Preview).
The trade-offs are the additional cost and the tools: logs and traces are stored in your Log Analytics workspaces, which are billed per GB (like Application Insights). There’s also a KQL learning curve, and Grafana integration is limited to basics, although at no extra cost.
If you want basic observability to monitor your cluster quickly, with minimal operations and manageable costs, the Azure Monitor tools are more than sufficient for your needs.
Now let’s see how we can progressively incorporate advanced features into the current architecture to further enhance AKS observability.
Azure Managed Grafana
The main limitation with Azure Monitor’s basic observability lies in visualisation. Dashboards with Grafana (Preview) is a stripped-down version, which means you can’t fully benefit from the service’s capabilities.
This is where Azure Managed Grafana (AMG) steps in. AMG is a fully managed Grafana workspace operated by Azure in a SaaS model. It enables advanced dashboards, exploration, and alerting, whilst also supporting integration through infrastructure-as-code tools. It accepts Azure-integrated and open-source data sources, such as Azure Monitor, Prometheus (metrics), or Grafana Loki (logs), and supports Azure-approved external plugins to extend the user experience. However, as a SaaS product, there are some limitations: no control over updates, limited server configuration, and a quota-based feature and pricing model.
One of the strengths of AMG is Explore, a Grafana workspace that allows you to query and analyse data in real time. Compared to Application Insights and Workbooks, it provides richer capabilities for correlating metrics, logs, and traces directly within panels and dashboards. However, we can’t take full advantage of the Live Tail feature to view real-time logs, as it is only enabled for native data sources such as Loki.
Regarding alerting, AMG integrates fully with the Azure Monitor alert system. You define your alerts in Azure Monitor, then view them in AMG through the Azure Alert Consumption dashboard in Grafana. We must emphasise that Grafana-managed alerts on Azure Monitor aren’t officially supported, so you can only define them in Azure Monitor.
The AMG pricing model is based on two pillars. First, there is a monthly charge for each user accessing the workspace, and secondly, for the workspace instance or infrastructure, where an hourly cost is applied depending on the chosen tier, with higher tiers offering better instance capabilities. Additionally, we must factor in the costs of Azure Monitor, Log Analytics, and Azure Monitor Alerts.
Now we’ll see how the basic observability architecture evolves with the integration of Azure Managed Grafana.
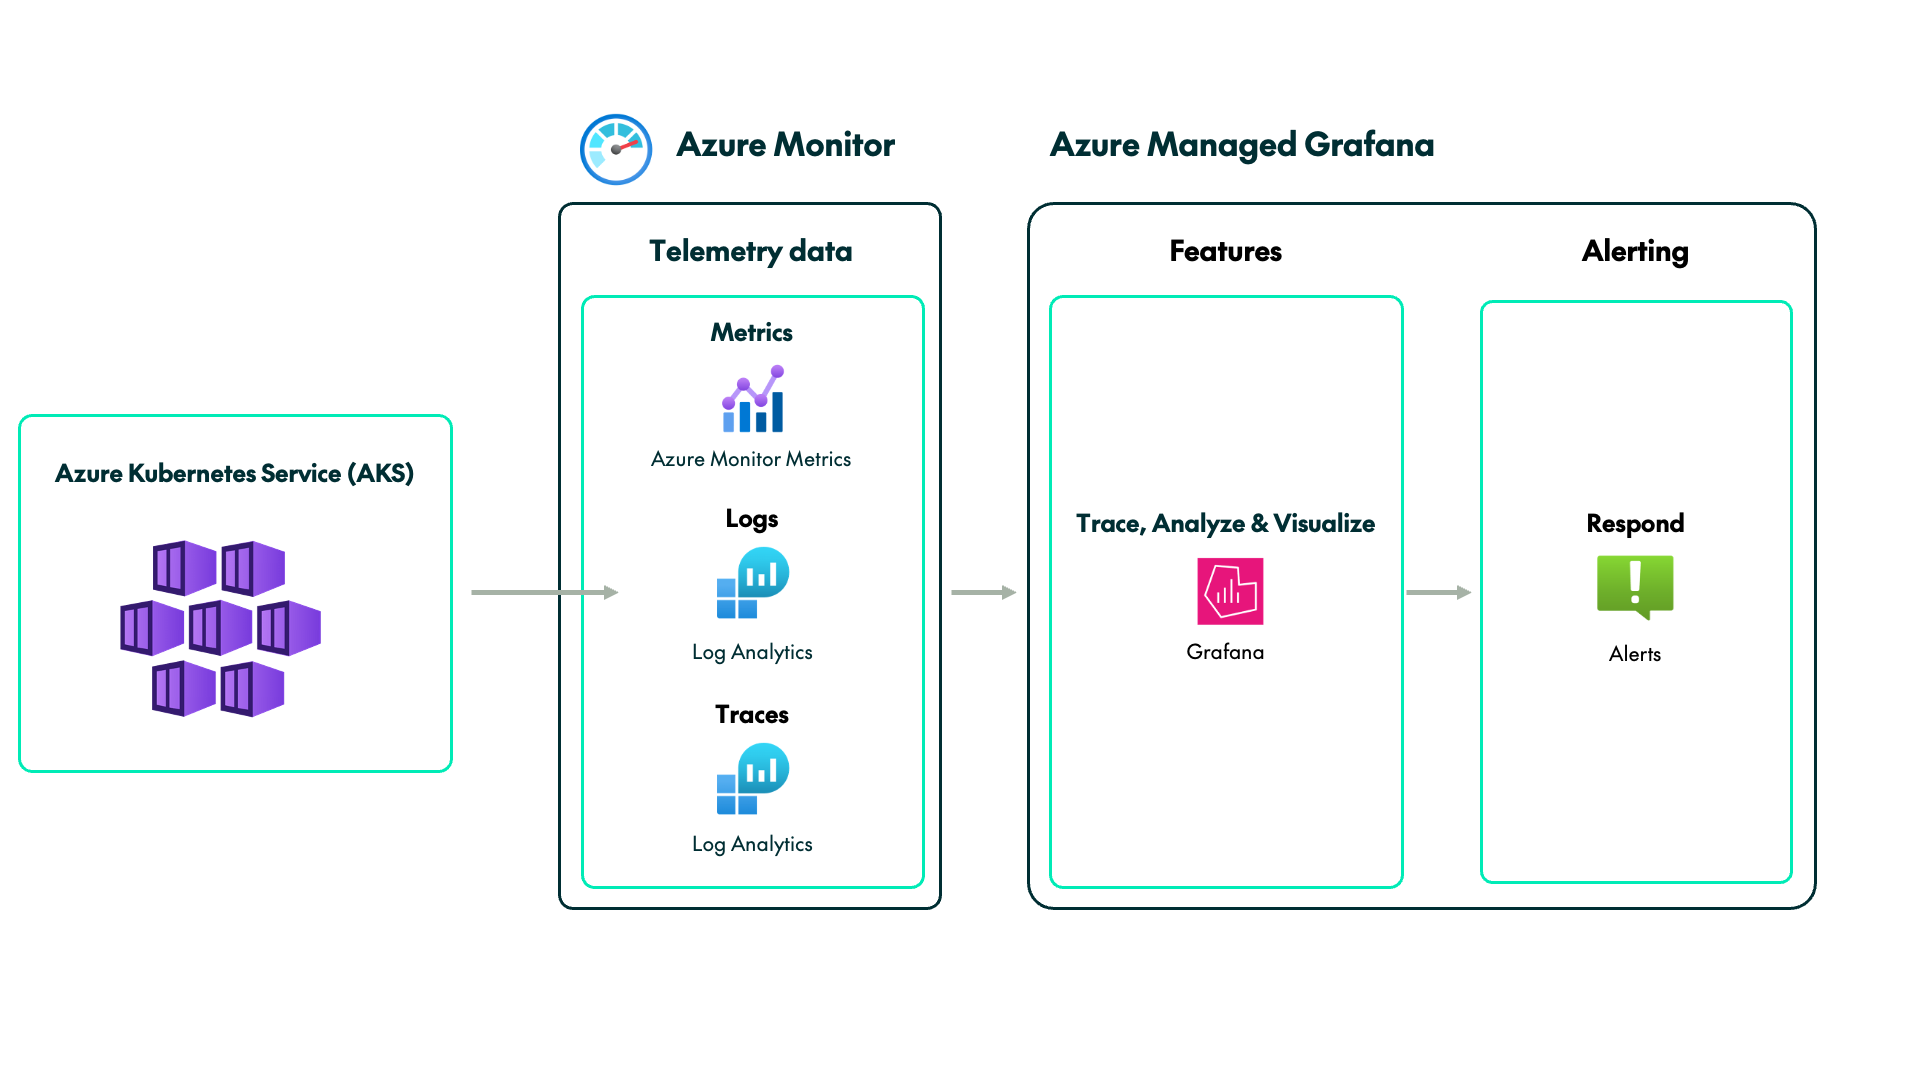
As we can see, Azure Managed Grafana can effectively replace Application Insights, Workbooks, and Dashboards with Grafana (Preview) with Explore and more advanced visualisation features. It is both a practical and simple solution to take advantage of the Grafana service without operational overhead, although managing this service will add an extra cost.
This architecture does have some limitations. Grafana-managed alerts are not supported by Azure Monitor, meaning alerts must still be configured there. Similarly, Explore’s live log tailing works only with Loki, so you can’t stream Azure Monitor KQL logs in real time.
Nevertheless, we can overcome these limitations and improve the observability of our AKS cluster even more.
Azure Managed Prometheus
Azure Managed Prometheus (AMP) is Azure’s managed version of the widely used open-source monitoring and alerting tool, Prometheus. AMP can replace Azure Monitor by expanding its metrics ecosystem without relying on native Azure metrics. One of its advantages is that it is standard and portable, so if you want to migrate dashboards or alerts to or from Azure, the process will be much simpler than with a tightly coupled Azure-native architecture.
AMP collects Prometheus metrics from the endpoints exposed by Kubernetes components and workloads in AKS and stores them in the Azure Monitor workspace. Prometheus uses a label-based data model, which means that each record has internal labels that add context, allow ad hoc segmentation, enable flexible aggregation, and power dynamic Grafana dashboards and alerting. To benefit from this feature, you’ll need to include Kubernetes labels such as namespace, pod, container, and service. Data is queried using PromQL, the Prometheus query language, optimised for operations on time series metrics.
However, AMP doesn’t include any functionality for logs. A straightforward approach would be to continue using Log Analytics alongside AMG, but this introduces components outside the Prometheus–Grafana ecosystem. For a native solution, Grafana Loki is the natural choice: Loki is a fully scalable open-source log aggregator designed to complement Prometheus. Like Prometheus, it follows a label-based model, but uses its own query language, LogQL, which closely resembles PromQL. Azure does not currently provide a managed Loki service, so you would need to deploy Loki yourself on AKS and configure Azure Blob Storage to store logs.
The same applies to traces. We could use Application Insights, but it isn’t part of the Prometheus–Grafana stack. The component within the Grafana ecosystem for collecting traces is Grafana Tempo, an open-source tracing backend that integrates seamlessly with the Grafana, Prometheus, and Loki environment. Tempo also has its own query language based on PromQL and LogQL called TraceQL, which allows you to search and analyse traces and then create metrics from them. Like Loki, Tempo must be deployed on AKS and backed by Azure Blob Storage for trace storage.
In this architecture, Grafana supports two alerting approaches. It can create Grafana-managed alerts that correlate data across Prometheus and Loki, or it can handle data source–managed alerts, which are stored and executed directly in the Prometheus and Loki rulers. Tempo, by contrast, does not generate alerts itself, but produces tracing metrics that can then be fed into Prometheus, where the alerts are defined and triggered.
Let’s break down the cost of this architecture. AMP charges for metric ingestion and queries (including alert costs), whilst AMG is based on subscriptions and quotas. Since Loki and Tempo are self-hosted, you’ll only be charged for the AKS infrastructure if you need extra node resources, and for Azure Blob Storage for data persistence.
Here’s what the new architecture looks like following the integration of the Azure Managed Prometheus and Grafana stack:

As we’ve seen, combining Azure Managed Prometheus (AMP) with Azure Managed Grafana (AMG) is the most complex option, but also the most powerful, for turning your AKS into a truly observable system. While some components from the first architecture can be reused, they generally sit outside what is considered the Prometheus–Grafana stack. By introducing Loki and Tempo, this becomes a hybrid setup where the core services are managed by Azure, and the complementary ones are self-managed. The result is a comprehensive observability solution, capable of delivering advanced, dynamic dashboards with strong correlations across metrics, logs, and traces.
Even so, you must weigh up the costs and limitations. Azure Monitor provides you with basic metrics from day one at no cost, but this isn’t the case with AMP, which must be provisioned and configured from the Azure portal once the cluster has been created. And as a managed service, it comes with an additional cost. On top of this, you’ll still need Azure Blob Storage to persist data for Loki and Tempo, although this is typically less expensive than using Log Analytics.
Conclusion
Observability is essential for understanding what’s happening inside your AKS cluster. In this blog post, we’ve explored how to start with the native Azure Monitor tools available from day one, then enhance observability with Azure Managed Grafana, and finally reach a complete Prometheus–Grafana stack. Along the way, we’ve outlined the features, advantages, limitations, and pricing of each approach to help you strike the right balance between operational effort, capability, and total cost.
In short, Azure Monitor is the quickest and most integrated option, offering native data collection, Workbooks, Application Insights, Dashboards with Grafana (Preview), and Alerts, but with limited flexibility. Azure Managed Grafana adds richer analysis, traceability, and visualisation to complement Azure Monitor, and finally, Azure Managed Prometheus completes the stack with PromQL-based metrics, extended by Loki for live logs and Tempo for traces. As observability evolves, so too do costs and operational demands, so the right choice is ultimately the one that best fits your organisation’s needs.
If you are interested in creating an observability solution for your AKS, or have any questions about deciding which option best suits your requirements, please don’t hesitate to contact us!