08 Apr 2021 Creating an Advanced SharePoint Indexer to Maintain an Organised Common Document Repository
Most companies use common document repositories in which documents can be stored and shared. Arguably, the most popular technology for this is SharePoint from Microsoft, and specially SharePoint Online which is part of the Microsoft 365 suite; though you may have also heard of SharePoint Server, the on-premise equivalent. SharePoint is more than a common data repository, but describing all the features of SharePoint Server and SharePoint Online and discussing how the latter integrates with the rest of the Microsoft 365 suite are out of the scope of this blog.
In any case, be it SharePoint Online, SharePoint Server, or any of the other alternatives out there, keeping a common document repository well-organised can be a hassle. Every team or department may have its own set of folders, with its own way of storing their documents; and navigating through this common document repository to find the specific files can become quite challenging. This is actually what we faced here at ClearPeaks; where we extensively use SharePoint Online.
To improve the experience of navigating through SharePoint, we have created the Advanced SharePoint Indexer. This solution allows us to easily navigate our common document repository by filtering the files and folders based on their metadata. The solution combines SharePoint features (Site Columns and Views), Power Automate, Azure Data Factory, Azure Functions, Azure Blob Storage, and Power BI.
In this article, we will go through the details of how we built the Advanced SharePoint Indexer. We have used this solution to index our own SharePoint; but as you will read next, it could also be easily adapted for your SharePoint!
1. Adding columns to your SharePoint library
The first thing we did is to add Site Columns into SharePoint: these allow tagging files in SharePoint library with custom metadata. You can have a column for each of the topics you are interested in indexing, for example: the type of document, the main topics it covers, the department to which it belongs, etc.
Once you have your columns created and added to your view, you can either use the “Edit in grid view” button or go to the details pane of your file to add the desired metadata to your items.
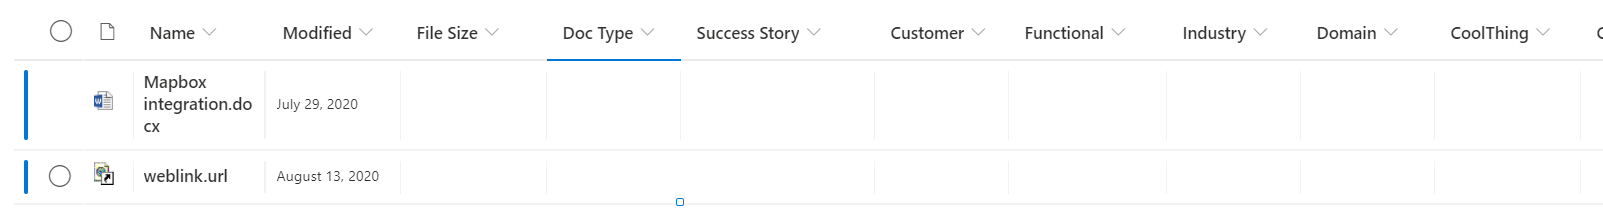
Figure 1: Editing in grid view
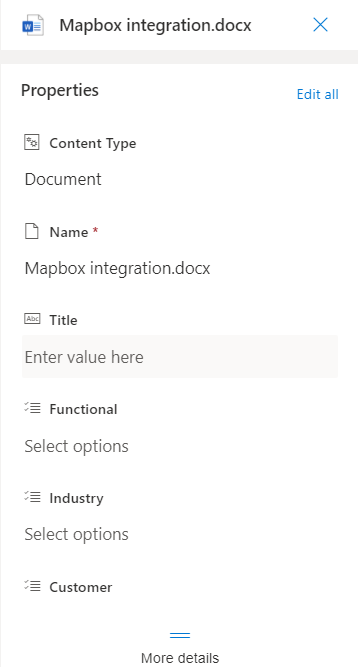
Figure 2: File details
One downfall of column tagging is that you are only allowed to edit metadata on files, not folders. If you would like to use your columns in folders, you need to create a custom folder content type, as explained in this article. In our Advanced SharePoint Indexer, that is exactly what we had to do, since we also wanted the ability to tag folders.
2. Keeping column values updated with Power Automate
When you create Site Columns for the first time, you can specify the values which will appear in the prompt that the user can then choose from. It can be tricky to keep the list of possible values of a column up to date. You may have these values stored in an Excel file or some other type of storage.
In our Advanced SharePoint Indexer, we had this issue since the values to choose from in some Site Columns change on a regular basis (new values are added often). To address this, we came up with a nice solution: use Power Automate to connect to the origin of the data and update the values through REST calls to SharePoint’s API.
In our case, we have two types of Site Columns, depending on how their values get updated:
- For a few Site Columns, an Excel sheet that we store in our SharePoint library contains the possible values of the columns.
- For other Site Columns, the possible values are determined from a list of folder names contained in a certain directory.
The Power Automate Flow which updates the list of possible column values follows the structure below:
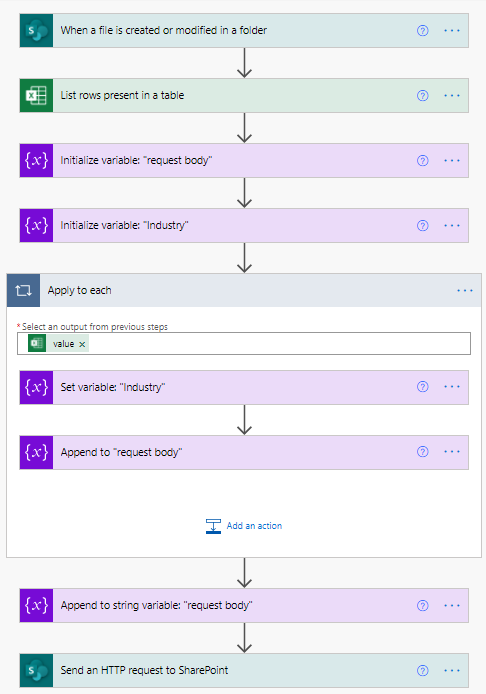
Figure 3: Power Automate flow
Figure 3 depicts the Power Automate flow related to one of the Site Columns of type “a”, i.e., the possible values for that column are stored inside an Excel file in a folder on SharePoint, so the flow will be triggered every time the file is modified. This way, every time someone makes a modification to this file, the flow will be triggered, and the values will be updated; without us having to worry about manually keeping them up to date.
Once the flow is triggered, the first thing we need to do is list the rows inside the table that contains our data. After that, we use those values to build the body of the request, which we will send to SharePoint’s API to perform the updating of the column values.
In the case where we want to get data from the list of folders on a given directory (type “b”), we follow a similar approach. The difference is that now the trigger will be the creation or modification of a file inside a folder, and we will list all the folders inside such a folder.
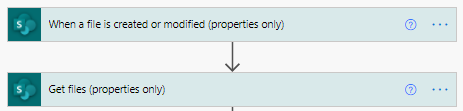
Figure 4: Trigger and Get Files operations
3. Retrieving data for Power BI
After having our data tagged and ready, the next step was to build a nice navigation tool. Considering that we’re on the Microsoft stack, the obvious choice was Power BI. So, we used Power BI to build a report that serves us as a SharePoint navigator, where we list all the important files and folders inside our library, and provide useful information on the metadata related to those files.
But before we could create the report, we had to extract the SharePoint metadata (location of files and folders, and values for the added columns) into Power BI. To extract SharePoint metadata and load it into Power BI, one can follow various approaches. The most direct one would be to use Power BI’s connector to SharePoint.
3.1. SharePoint connector
Using Power BI’s SharePoint Online List connector, you can extract a large amount of information about your files and folders. This not only includes the columns that you just created, but also other important information such as the creation and modification date or the link to the resource.
Once you connect to your SharePoint Online List, you will see that you get multiple columns of the type “Record” or “Table”. Make sure to click on the arrow next to each column name to see the all the fields inside those columns, since the information you are looking for may be stored inside them.
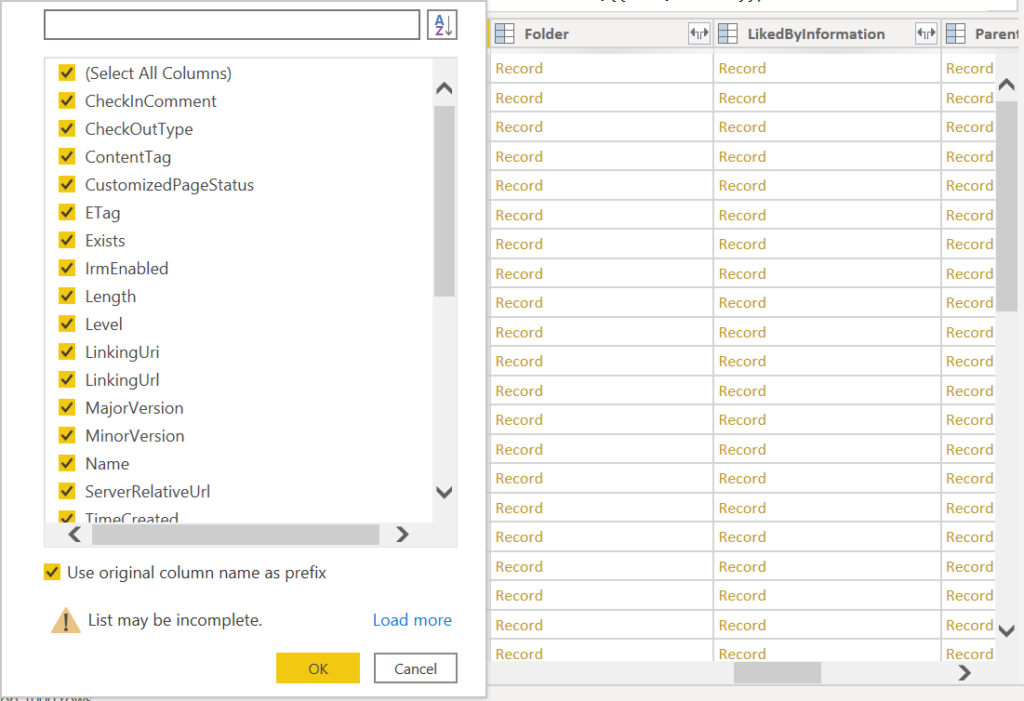
Figure 5: Example of columns that are obtained using the SharePoint Online List connector
The negative side to this approach is that one can face performance issues when trying to connect to SharePoint’s data if the library is big enough, which is the case here in ClearPeaks, where our SharePoint online has tens of thousands of files.
When Power BI tries to connect to a SharePoint Online List, it performs a large number of requests to the API to obtain all the information of all items inside the library, even if you are just interested in a few directories or folders. When the library is very large, this process can take an unaffordable amount of time (it will actually timeout the dataset refresh operation in Power BI).
3.2. Custom approach for efficiency (using Azure Functions and Data Factory)
To address the issue described above, we designed and implemented a solution using Azure Functions and Azure Data Factory. This uses, once again, SharePoint’s REST API to obtain the metadata from our files and folders using a Python script, and then outputs the data into a CSV file that is stored in a Blob Storage inside Azure.
The Python script obtains the same data that you would get using the native Power BI connector, but in a programmatical way. Given a path in SharePoint, the script obtains all the metadata of the files and folders that lay under it, processes the resulting JSON files, and writes them into a CSV file. This file is then uploaded into a Storage Account which Power BI can connect to.
This script is executed using an HTTP triggered Azure Function, which is called from a pipeline in Data Factory that executes every night. This pipeline basically reads a CSV file containing the paths inside SharePoint that are to be explored, and triggers the execution of the Azure Function for each of them.
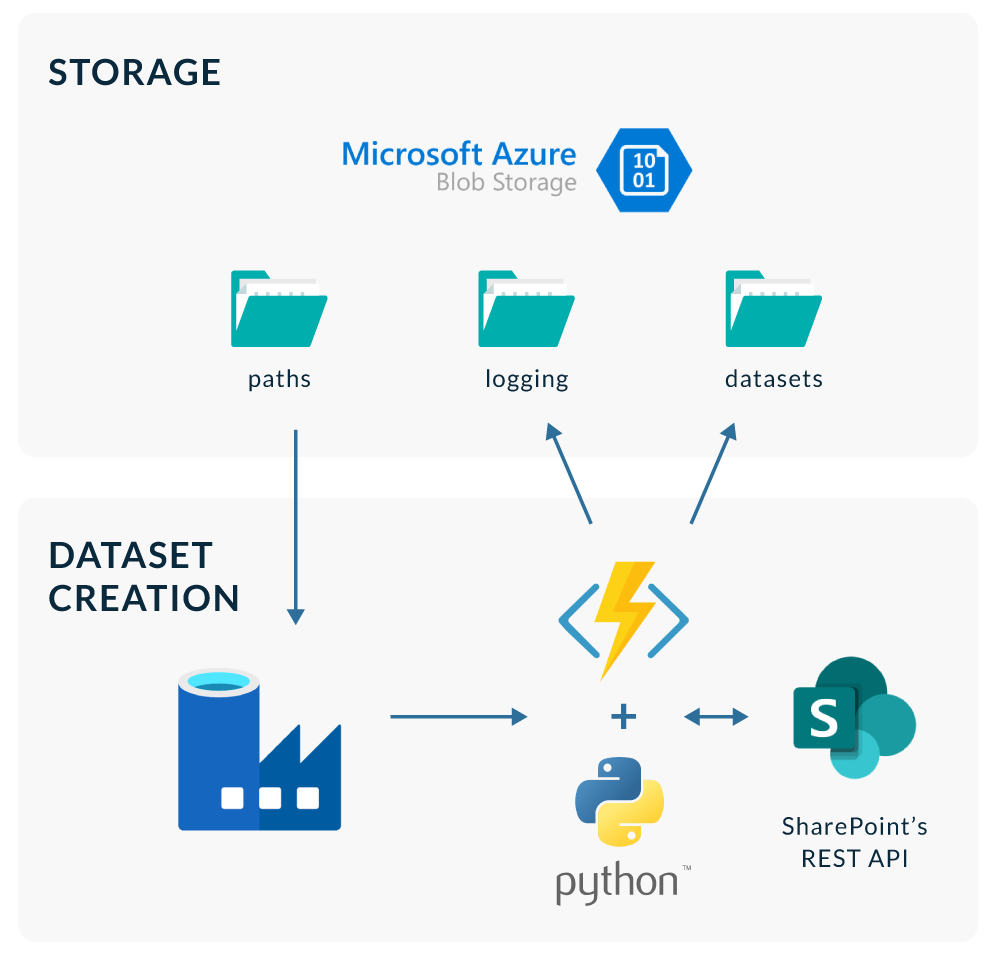
Figure 6: Data Factory pipeline
By avoiding making the request calls during refresh time on Power BI, we achieve a dramatic decrease in the time needed to obtain the data. An operation that took more than 6 hours on Power BI has now been reduced to just a few minutes.
3.3. Other approaches
In this article, we have discussed two approaches for extracting the data from SharePoint, but there are other options. For example, you could even use Power Automate to list all your files and folders and send requests to SharePoint’s API to obtain any extra data that the default activities in Power Automate do not provide.
4. Building the report in Power BI
After the metadata from SharePoint was extracted and loaded into Power BI, we built a report that allows us to easily find the documents we are interested in, based on their topic.
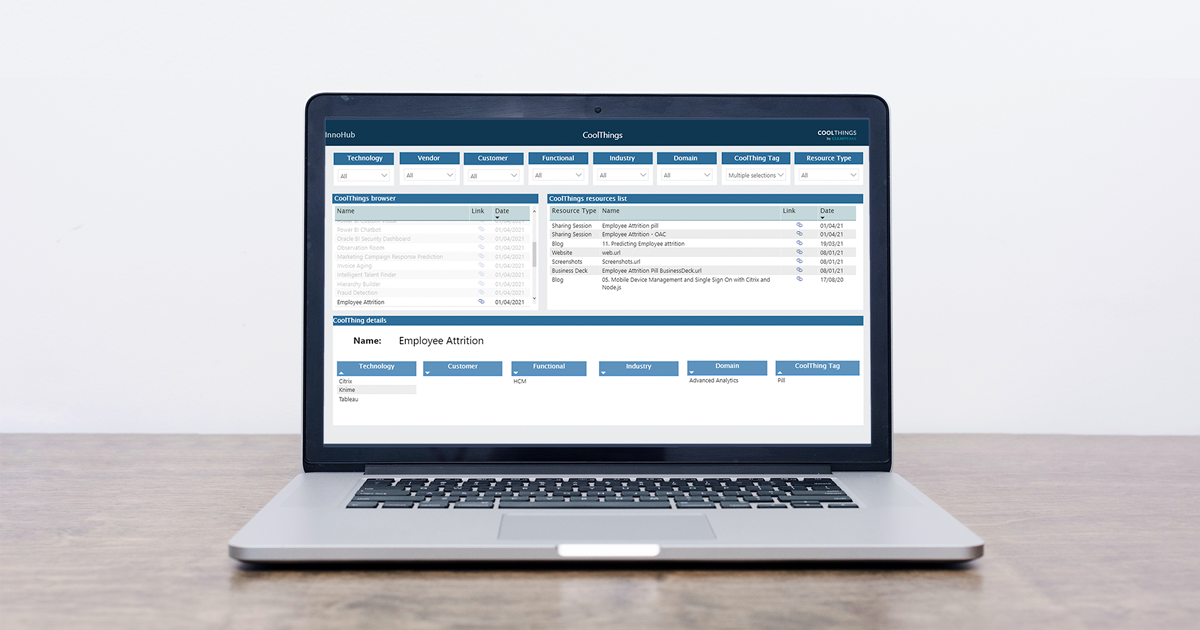
In our case we use the Advanced SharePoint Indexer (our internal name is InnoHub) to navigate through the CoolThings we do in our work, and be able to filter them based on the technology we used, the customer for whom we made it, any functional area and/or industry which may be relevant, which department (Domain) made the CoolThing, what type of CoolThing it is (a plugin, a data model, etc.), and which resources (documents) are available related to it.
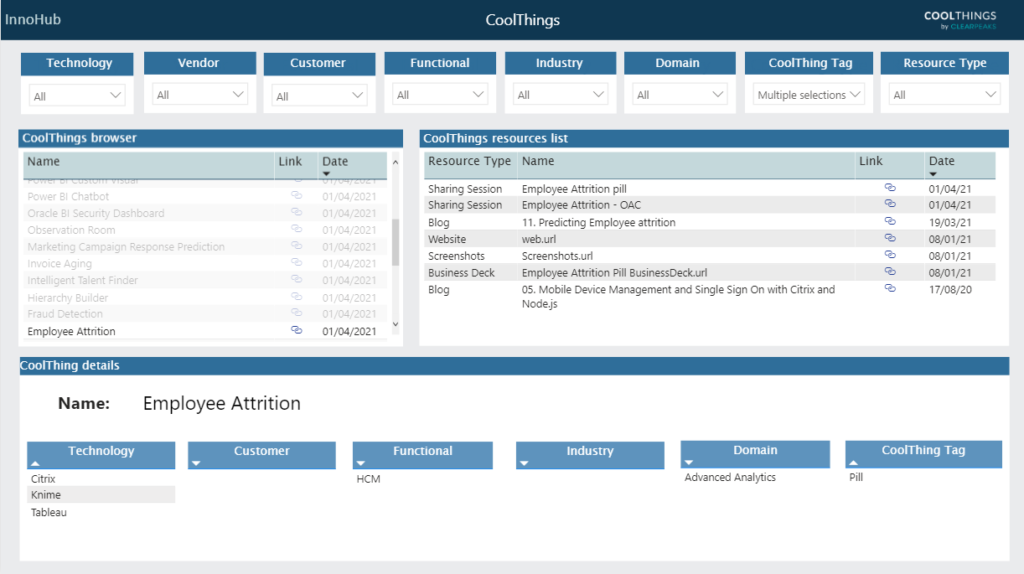
Figure 7: InnoHub – An Advanced SharePoint Indexer
We can filter CoolThings using the slicers on the top, or we can directly scroll through the two lists below to find the resources we are interested in. On the left pane we can see all CoolThings, and on the right, all the resources (documents) related to them. We can see the modification date of the resources, as well as a link to them. On the bottom of the page, we find several tables with the metadata associated to the selected CoolThing, which helps us know what the documents are about before having to read them.
Now, if we put all the steps together, this would be the architecture of our solution:
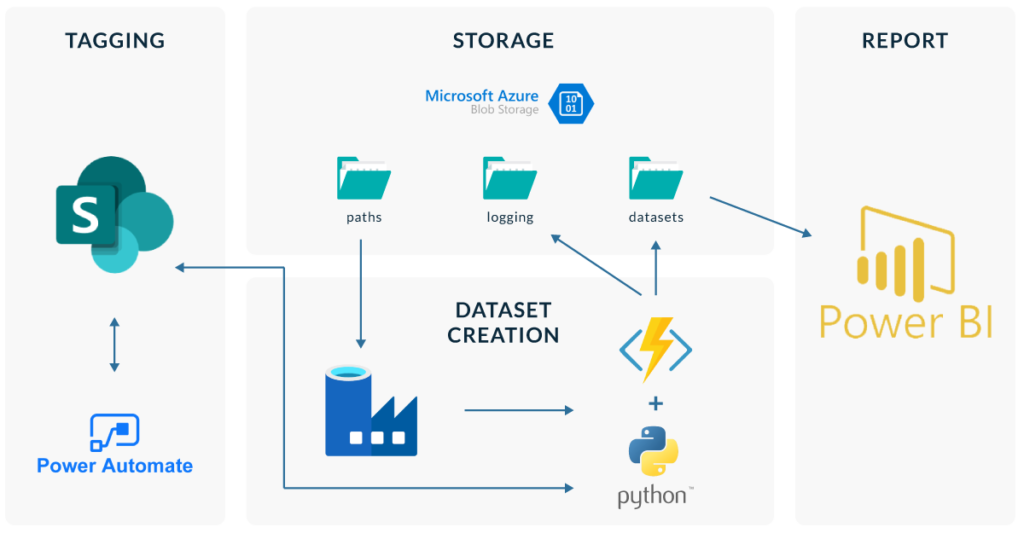
Figure 8: Solution Architecture
We used SharePoint as the origin of our data, creating site columns so that we can add metadata and index our files and folders. Next, we created a pipeline using Azure Data Factory that triggers some Azure Functions which create datasets with the desired information: name and path of the file or folder, modification date, link to the resource, and our custom metadata. Finally, we used Power BI to read our custom datasets and create a report to browse all the data.
Conclusion
In this article we presented how we used SharePoint’s Site Columns and views, Power Automate, Azure Data Factory, Azure Functions, Azure Blob Storage, and Power BI to build a powerful indexer that helps us to navigate our SharePoint library easily.
By adding tags to our items, we are providing lots of metadata that can help us quickly find the files and folders that we are interested in, without having to browse through the whole library or read documents just to know what they are about.
A tool like Advanced SharePoint Indexer can be really useful for you too, especially for those in sales or management positions who need to easily and quickly find the most relevant documents to them, no matter where they were originally stored inside SharePoint.
If you would like to know more about Advanced SharePoint Indexer or how you can adapt it in your own repository, contact us and get an up close look at how we can help you!