26 Jan 2022 Apache Echarts
Nowadays charts are a great tool to upgrade our interactive dashboards, reports and presentations, and there are limitless possibilities to be found on the internet. Charts allow companies to be as creative as they want, using any presentation to show graphics as interestingly as possible; charts are now one of the hallmarks of a good presentation.
In recent years, data visualisation has gone a long way too. Companies no longer expect data visualisation solutions to be basic chart generators, but rather to offer more sophisticated features in terms of interface, performance, data processing, and other elements.
What is Apache ECharts?
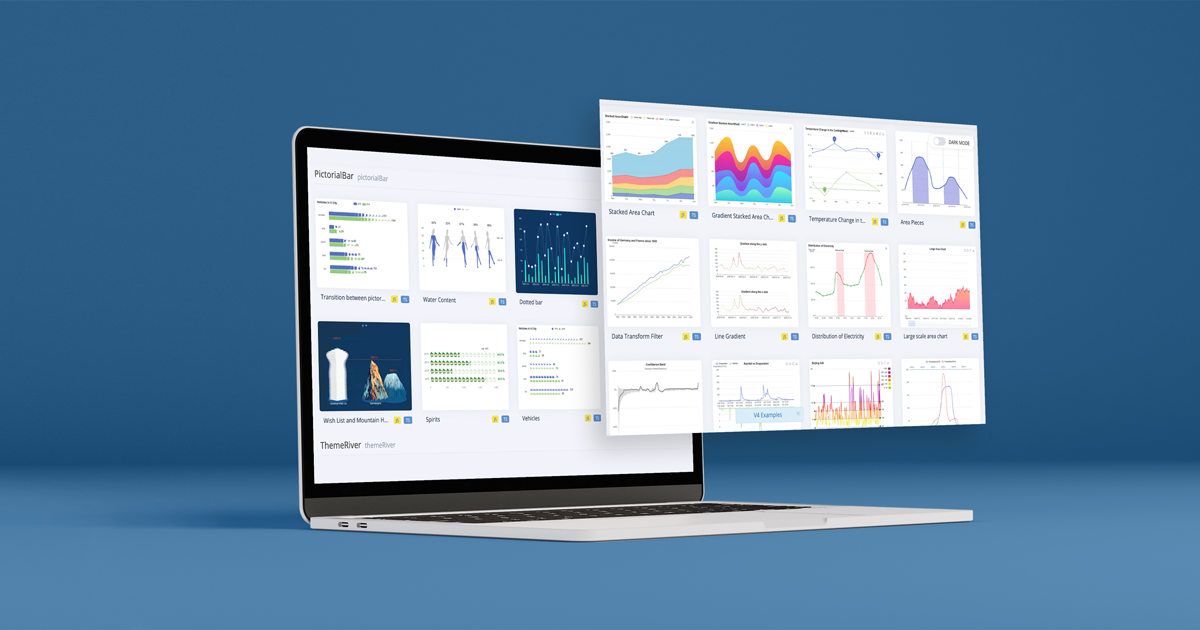
Apache ECharts is one of the most advanced frameworks for building charts and visualisations, simplifying the inclusion of highly customisable charts into commercial solutions. ECharts works with ZRender, one of the best engines on the market for graphic rendering, allowing the creation of exceptionally personalised charts. It’s very user-friendly and we can easily choose what type of chart we want.
ECharts comes with ready-to-use interactive components to perform operations such as multi-dimensional data screening and zoom-in zoom-out views, and it can also display any kind of text, image, or shape.
With the visualMap component, it’s possible to map data of different dimensions to colour, size, transparency, shading, etc. thanks to its rich visual coding. ECharts is driven by data, and any change in that data will be represented in the chart.
So, as implementing dynamic data is now really simple, we just need to get the data, fill it in, and ECharts will automatically find the differences between these sets of data and then use the indicated animation to represent those changes.
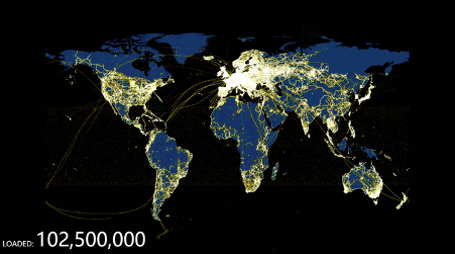
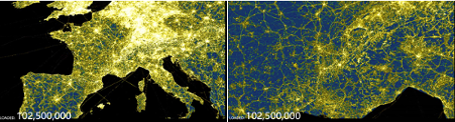
ECharts can present a visualisation of huge amounts of data by using an incremental rendering approach and optimising all aspects. Furthermore, interactions such as scaling and morphing are all fluid.
Hundreds of megabytes of data often need hundreds of megabytes of RAM, but fortunately ECharts has enabled data streaming, allowing it to show as much data as is sent over a WebSocket. You don’t need to wait until all the data has been loaded before rendering.
Discussion and Comparisons
So, of all the available charting libraries on the internet, why choose Apache ECharts? What exactly sets Apache ECharts apart from the others, like HighCharts, C3, or NVD3.js ?
Here are some reasons:
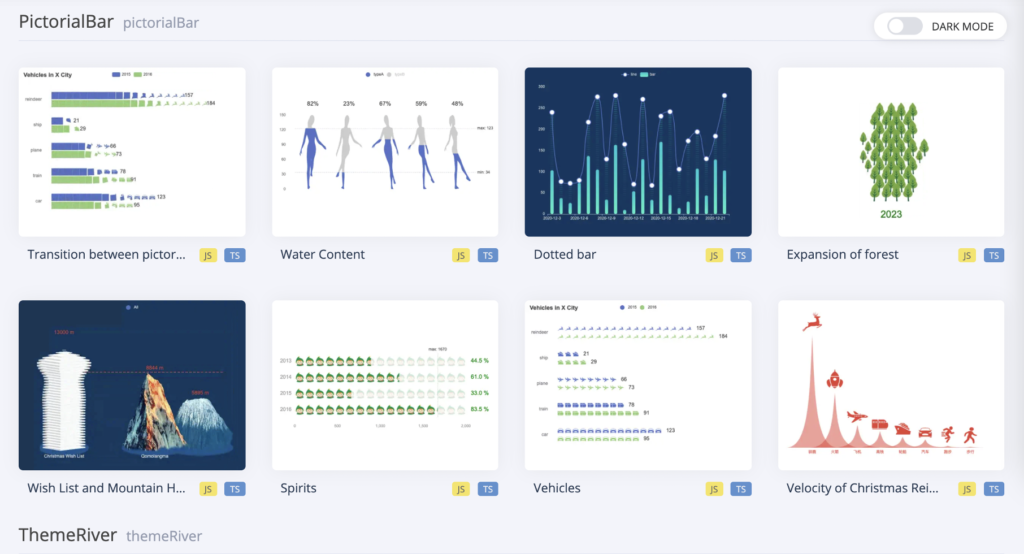
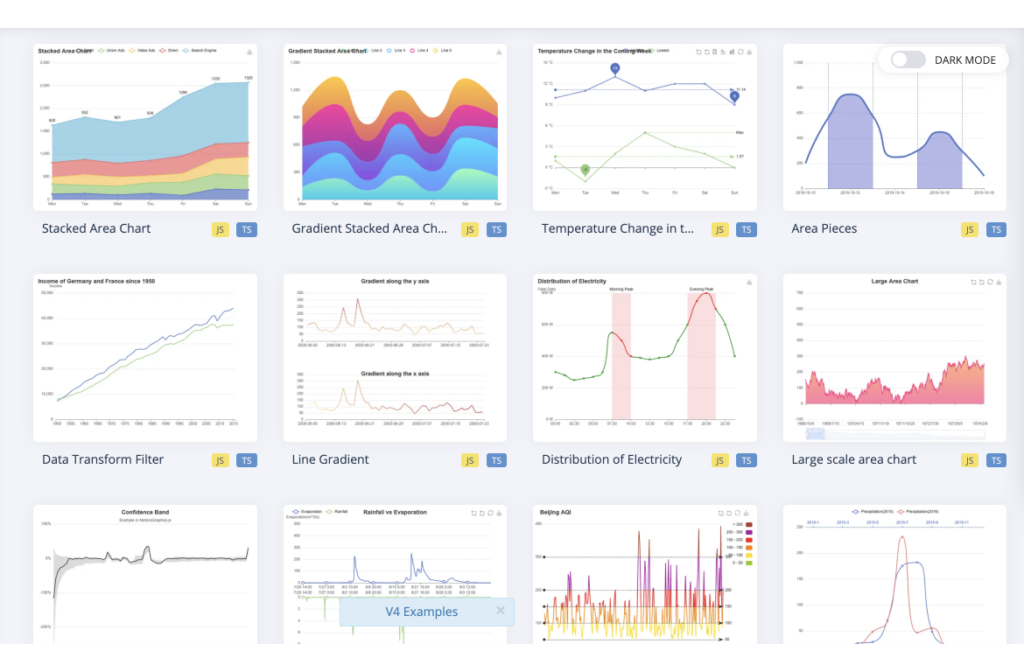
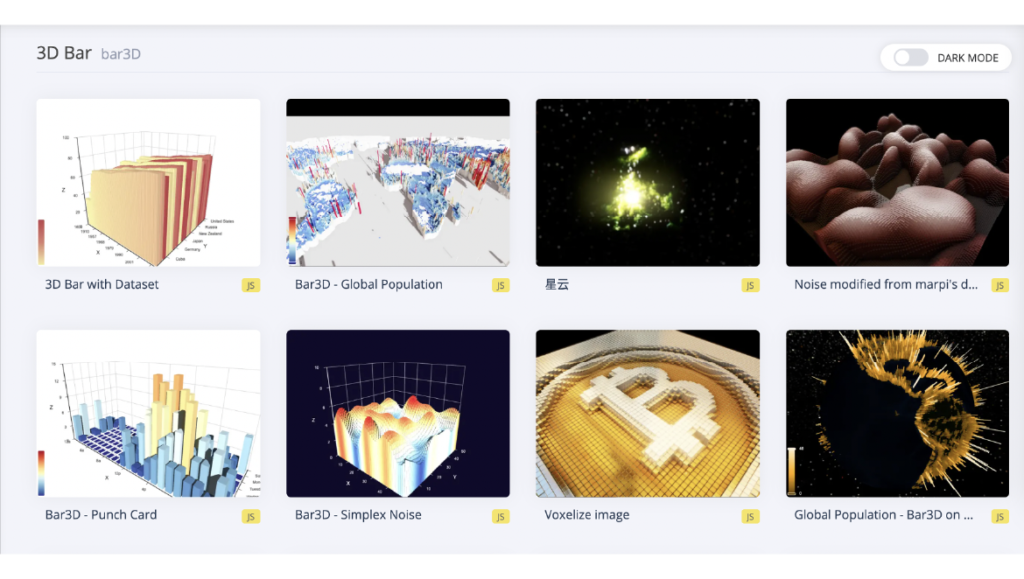
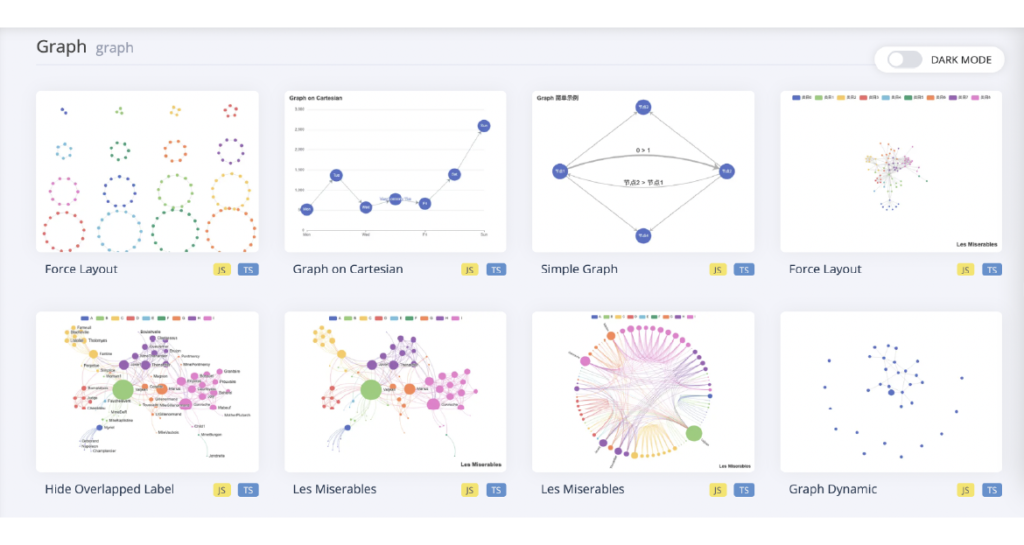
- Large Library of Visualisation Types – All types of chart can be found here. There are almost 40 different types of chart, each providing a custom example. It can even create charts based on data you input without you choosing what type of chart you want; it will choose the most appropriate chart for you! HighCharts, on the other hand, has a lot of restrictions on choices and the structure of the input data; for example, it cannot operate with online map libraries.

- High Performance – At the heart of ECharts is the ZRender engine, which supports the popular rendering engines Canvas and SVG. The ECharts architecture enables key properties like:
- Chart data is split into chunks and pushed to the browser
- Charts can be rendered incrementally
All this guarantees a very smooth end-user experience, especially when faced with unreliable packet delivery and low bandwidth connections. When benchmarked against other libraries like NVD3.js, Highcharts, and C3, ECharts shows a notable difference in performance for the most common chart types. In addition, ECharts has adopted responsive design principles to enable better cross-platform compatibility, making charts render and behave similarly across vastly different viewports and screen sizes.
- Rich Visual Coding and Multi-Dimensional Data Suggest – In Echarts the input data can be set in several dimensions, in addition to the usual multi-dimensional data visualisation tools like parallel coordinates, classic scatter plots, and so on. You can map data of many dimensions to colour, size, transparency, shading, and other visual channels, using the visual mapping component visualMap.

- Powerful Declarative API – Themes can be specified as JSON files, and with the theme builder on the ECharts website we can build and download our own themes. ECharts follows the declarative data visualisation paradigm. You can theme dashboards by manually tweaking the CSS, and ECharts will eventually move to a theming system that’s more declarative, making it highly compatible. The extensional architecture of ECharts, which includes components and the additional definition of event listeners, provides a versatile approach to enable chart design and user interface customisation. HighCharts, Chart.js, and C3 do not provide these functionalities.

- Mobile Optimisation – ECharts has been successfully developed for mobile interaction, including zoom-in and zoom-out; PC users can do the same with the mouse wheel. ECharts boasts a small package size on mobile thanks to its modularity, packaging approach, and the optional SVG rendering engine, which reduces all sizes, and consequently, memory use.

Conclusion
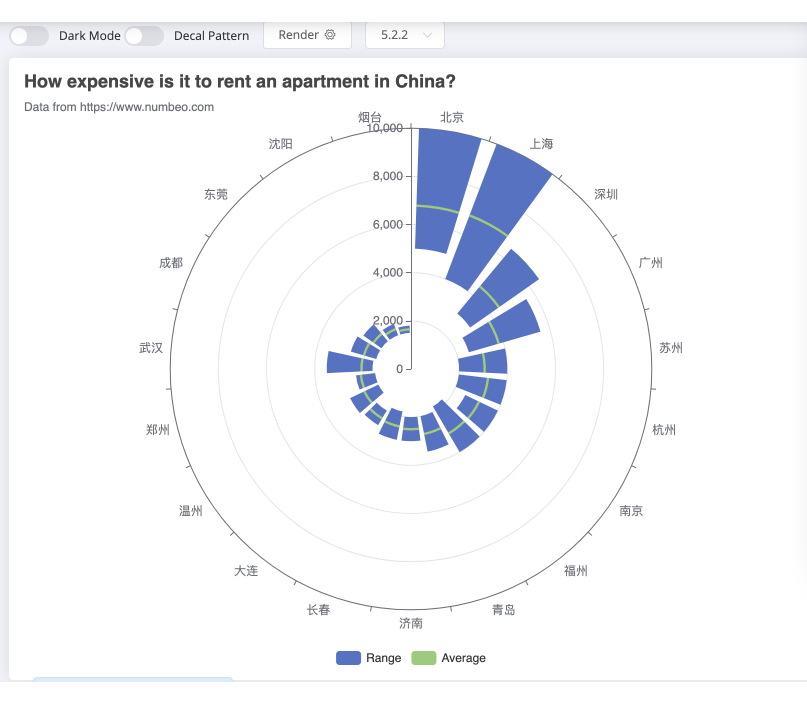
All things considered, the creative, dynamic, and modern framework of Apache ECharts makes it a really safe bet. It can greatly improve our presentations both visually and in terms of business confidence – who wouldn’t feel confident while presenting a chart or graph that’s creative and well designed?
We’ve given some examples to demonstrate its capabilities in UI design with its fast drawing speed and good usability in real-world applications, and we can conclude that ECharts offers an unbeatable experience. If you’re interested in learning more about how ECharts and other visualisation libraries and tools can help your business, simply contact us, our team of experts is ready to help you!