23 Mar 2020 Build your own interactive Oracle dashboard with our innovative IxD solution
At ClearPeaks we are always up to date with the latest advances in dashboards and visualizations; we firmly believe that developing a dashboard is not only about designing a tool to analyse the business, but also about improving the user experience as well as enriching the visuals – and that is why we developed the IxD dashboard solution: a tool – built on Oracle Analytics Cloud and using JavaScript libraries – that allows users to design and populate their own interactive dashboards using Oracle Business Intelligence (OBIEE) report elements. The result is a customized, flexible and interactive dashboard with some amazing features.
What are its advantages over the classic OBIEE dashboard?
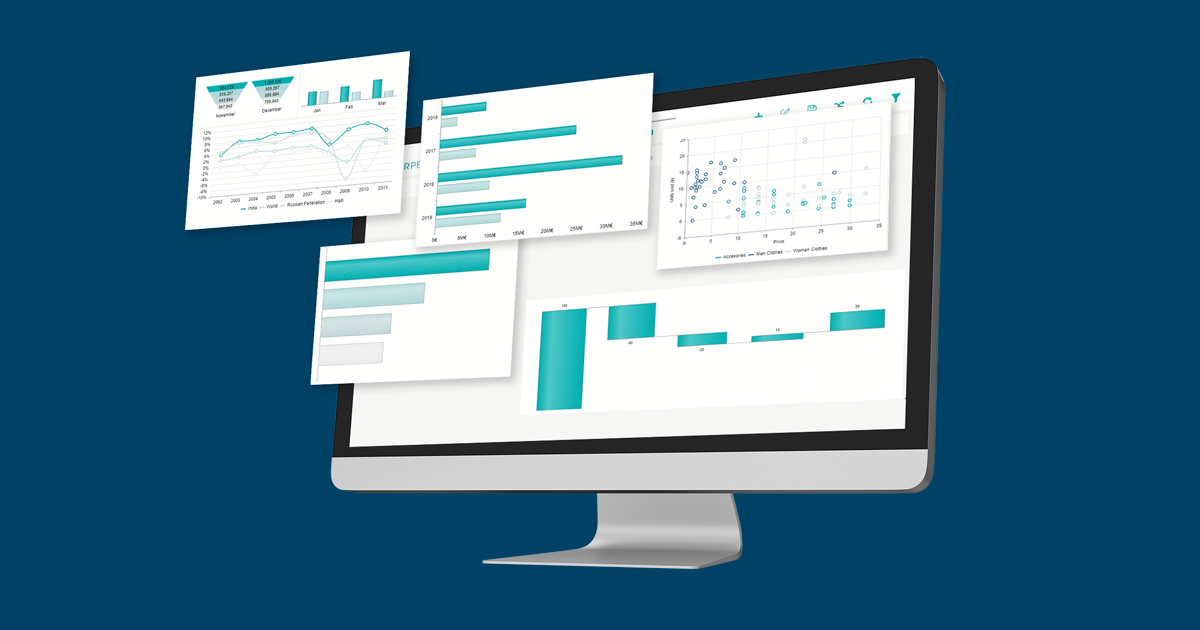
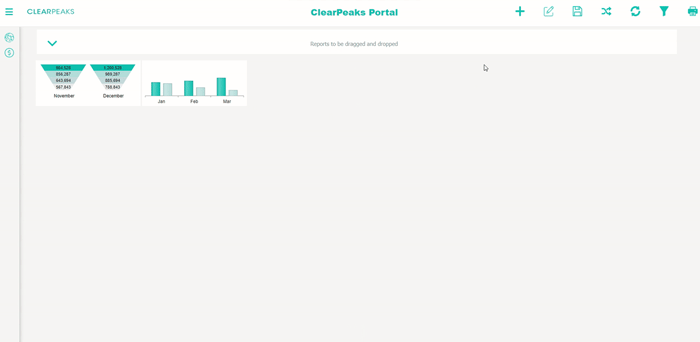
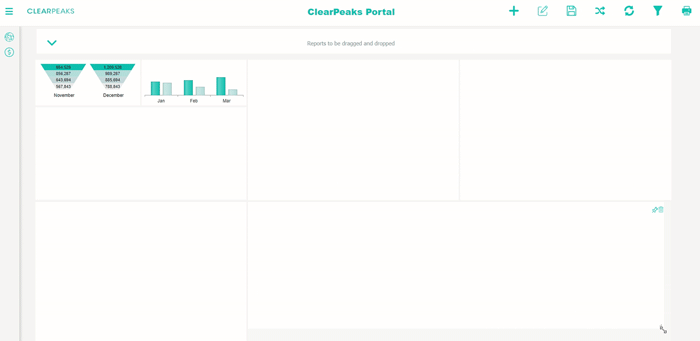
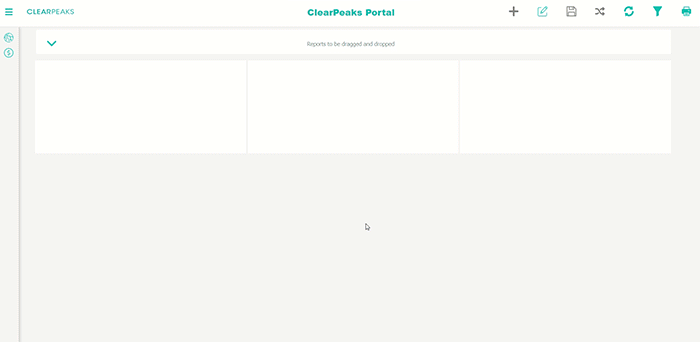
- Users can model the dashboard as they wish: it contains a library that allows you to drag and drop visualizations from a slider, containing all the reports, to the dashboard canvas.
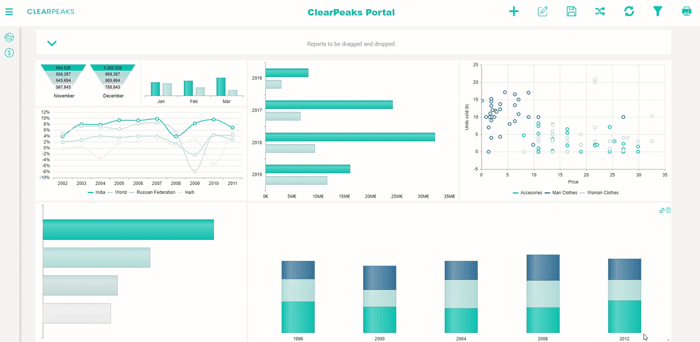
- It allows the user to resize a certain visualization, remove a graphic and add another, leave one chart static and the rest dynamic and automatically assign the certain graphics to the canvas.
- Users can save a specific layout in a database through OBIEE Writeback.
All these functionalities that we are going to see in further detail are what make this solution so innovative and unique, refreshingly different from the classic OBIEE dashboard.
In addition, the resulting dashboard is set up in such a way that new users have a default layout while existing users, having previously saved their layout, will have the last one saved by default.
1. Architecture
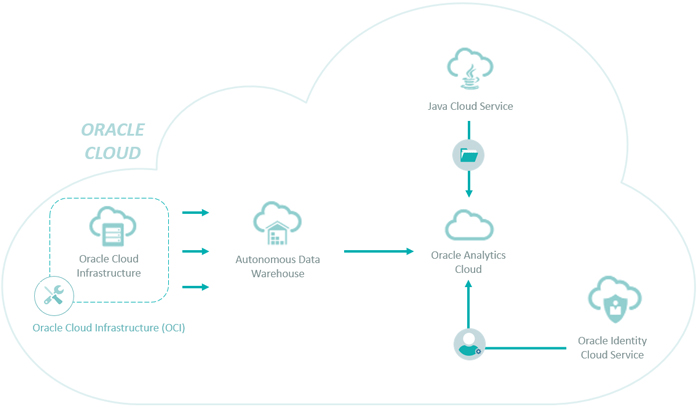
Before explaining how the tool works, let’s go into how it is built on Oracle Cloud. Oracle Cloud offers a lot of services; remember that although it is a tool designed in Oracle Analytics Cloud, other services are required to make it work. Since their latest release in September 2019, Oracle has improved many things and changed others. One of the key tools that has not changed at all is Autonomous Data Warehouse, a fully autonomous database with fast query performance. It was chosen instead of a classical cloud database because both maintenance and administration are automated. For more information about how we connected our solution to Oracle Analytics Cloud with Autonomous DWH please read our blog article.
In order to give access to users, we need to manage the Identity Cloud Service, which allows us to assign roles and applications to each user or group of users. In addition, we need to modify the CORS policy that is carried out through the session settings in the same application dashboard. As we are working with multiple cloud services, we must ensure that the communication between services is saved and works properly.
Finally, we will also use Java Cloud Service to store all libraries in a custom folder that can be accessed from the Oracle Analytics Cloud. Of course, since we are using Oracle Cloud services, we will use the compute (Oracle Cloud Infrastructure).
Depicted below is a schema of the correlations between services in our cloud solution developed in ClearPeaks.
2. Technologies
Below you can find a briefing about each of the technologies used to deploy the solution.
- OBIEE. As explained in the previous section, the solution resides in Oracle Analytics Cloud. However, there are a couple of visualization tools in OAC by default, Data Visualization and classic Oracle Business Intelligence. We use the second; it is the core of our solution where all the visualizations are created and where all library calls are made.
- JS, HTML and CSS. In order to build the whole framework, we used JavaScript, HTML and CSS to change the styles and the whole look and feel of the dashboard. As experts, we also used JavaScript to introduce out-of-the-box functionalities and enhance the UX.
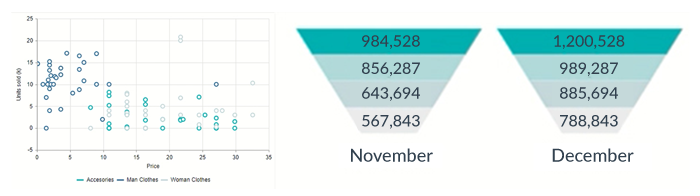
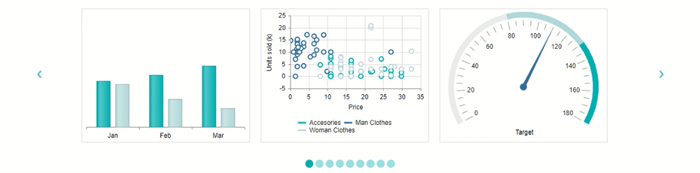
- Kendo UI. A JavaScript library to enrich visualizations and perform extra functionalities. Below we can see some of the visualizations enriched by Kendo library.

- JQuery UI. A jQuery library is used to make the slider of reports draggable and the elements in main canvas droppable. This allows us to improve the UX by letting users select charts then drag and drop them onto the dashboard layout.
- Gridster JS. A JavaScript library to convert a simple dashboard into something interactive. The main features range from turning slides into resizable and swappable to specific functions like adding a new slide, saving the layout, etc. This library drives the main dashboard functionalities.
3. Main Features
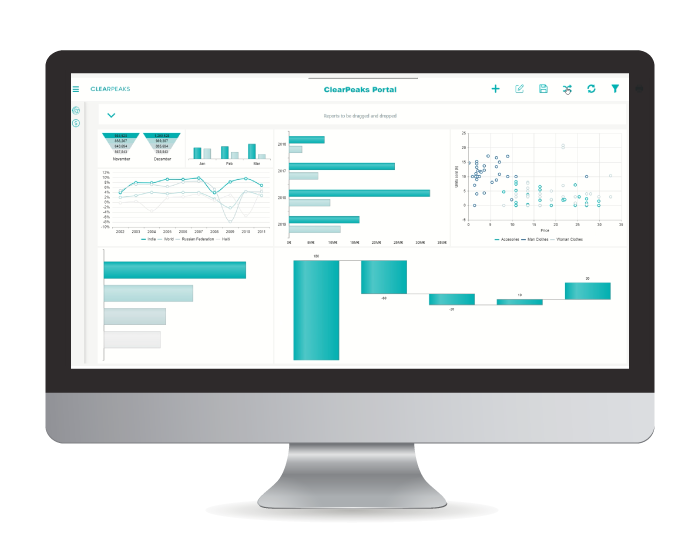
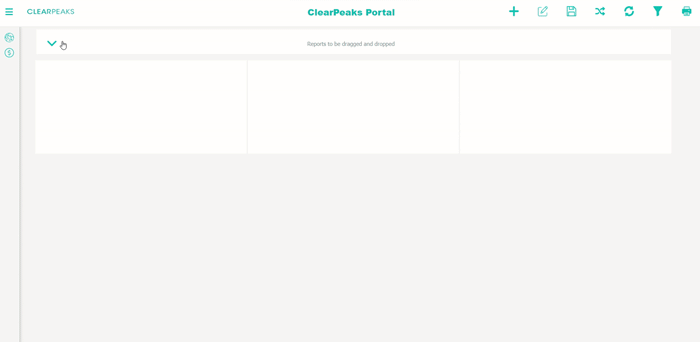
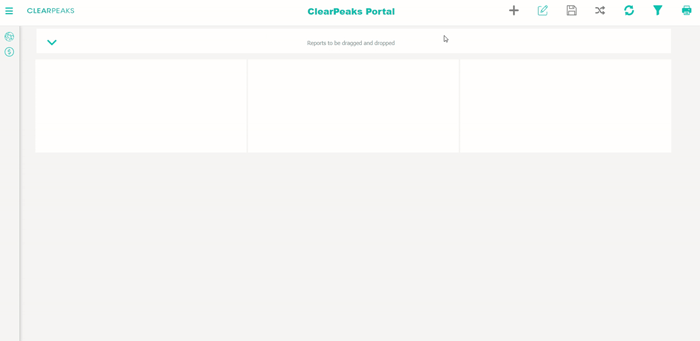
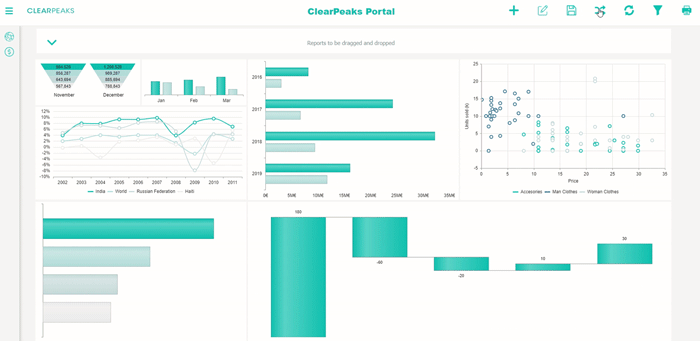
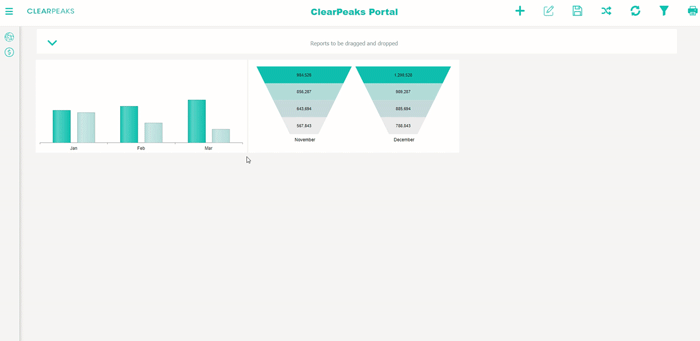
The main functionalities of the tool are explained below. Considering that the core of the solution resides in Oracle Analytics Cloud (Oracle Business Intelligence), the functionalities explained are out of the box and not included by default in Oracle Business Intelligence (OAC). The first thing to note is that in comparison with a typical OBIEE dashboard, our Oracle IxD dashboard tool has a main slider that contains all reports available for each user to drag and drop onto the dashboard.
Another functionality that allows users to move to other dashboard pages or to the Oracle Cloud home page is the Navigation panel, a quick way for users to move to a specific URL of interest. In the example below the user is able to navigate to the Finance dashboard page or the OBIEE Home page.

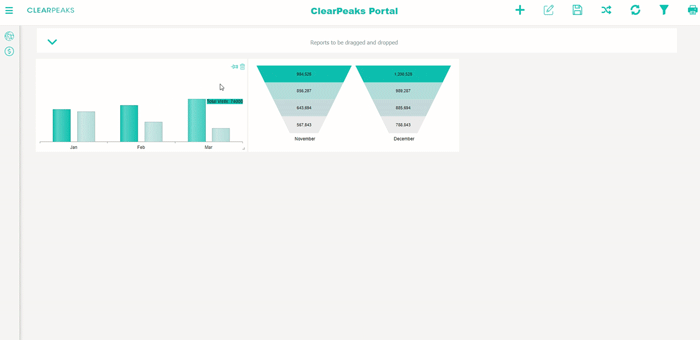
The icons found on the dashboard header allow users to execute different actions. If the user has no permissions to click on the Edit icon, the user would only be able to move reports from one slide to another and execute basic functionalities like print or refresh, or basic OBIEE functions.
Once the Edit button is clicked and enabled, it is possible to click on Add Widget to add droppable widgets to the dashboard.
Furthermore, you can automatically assign reports to the existing free widgets of the dashboard by clicking on Automatic Assignment.
One of the main features of the Oracle IxD dashboard tool is that you can Save the layout, thus allowing a different dashboard layout for each user. The different layouts are stored in a table in the Autonomous Data Warehouse using OBIEE Writeback every time the Save button is pressed; when the user loads the dashboard or refreshes it, then the stored layout is loaded and set correctly.
In fact, there are two possibilities: if the user is new, an Insert is made in the database table with the new user and his new layout distribution; if the user already exists, an Update is made to its table row. Therefore, when the Refresh button is pressed, the dashboard layout is the one the user saved.
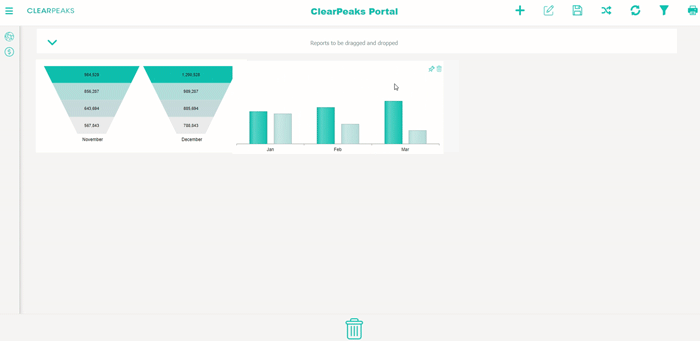
Apart from the actions triggered by the icons in the header, there are some other functionalities that must be explained. Any slide can be deleted by applying 2 different methods. The first is just stepping inside the slide and clicking on the bin icon.
The second method consists of dragging the slide and dropping it into the big bin in the footer, enabled while dragging a slide.
Remember that these functionalities are allowed only when the edit mode is enabled; in other cases, take a look at the user permissions.
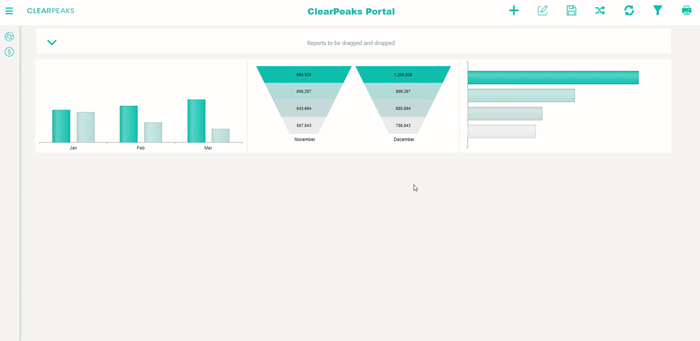
Another functionality is to Pin or Unpin a slide. When a slide is pinned, it turns into a static slide. By default, all slides are initially unpinned; again, if a slide needs to be pinned or unpinned, Edit mode must be enabled.
Sometimes it is helpful to leave a slide static. Just pin it; to make it movable, unpin it as depicted below.
And the last functionality is one that comes default with Gridster JS library, the resizing property. Once again, Edit mode must be enabled to proceed with a resize.
In terms of managing the layout, there is one key rule to remember: if you want to swap a couple of slides, both slides should be the same size. If not, the swap will not be made and the whole layout will be restructured.
3. Advantages
Now that we have looked at the tool’s capabilities, let’s check out the advantages in comparison with other tools:
- Interactive. By and large, OBIEE dashboards are not interactive; having all reports in the slider generates interaction from the user with the dashboard.
- Flexible. The extra functionalities we have added like resize, swap, delete, pin, etc. make our dashboard way more flexible.
- Easy to deploy. The way the libraries have been included and packed, together with a bit of automation, offer a solution that is very easy to deploy either in Oracle Cloud or on-premise OBIEE.
- Responsive. It is a self-adapting tool.
- Mix of innovative features with OBIEE. The tool takes the best features from OBIEE and adds extra ones to improve them or add new ones.
- Story Telling. A great option to create your own insights as it is very interactive and allows data analysis in a very simple way.
4. Demo
In order to see all these functionalities together, please watch the demonstration below.
In ClearPeaks we are always up to date with new functionalities, libraries and BI trends; we are experts not only in Oracle technology, but also in JavaScript and enhancing visuals. We are always searching for the best way to improve the UX, either with new functionalities or adapting the dashboard to the customer’s needs. If you are interested in finding solutions or just want to know more about what we can do for you, please contact us.