
11 Jul 2019 Descriptive and predictive analytics on text data with Big Data and AI
Almost every big company in the world deals with semi-structured and unstructured text data from which they could derive insights in order to make better decisions for their businesses. With the increase in the popularity and use of Big Data and Artificial Intelligence (AI) methods and technologies, many companies are looking for ways to squeeze more juice out of these data sources.
We can find examples in almost all company departments: procurement departments need to analyse contracts to find clauses that could be harmful, finance departments need to analyse invoices to check that everything is in order, customer service departments need to analyse claims, feedback and support forms to improve the customer experience whilst decreasing operational costs, marketing departments need to analyse opinions about their products to improve sales, operations departments need to go through reports of accidents, risks and activities to improve performance, efficiency and health and safety, HR departments need to scan thousands of CVs in PDF format with diverse structures to find the best candidate for a vacancy (by the way, we actually have a solution for this very issue – the Intelligent People Finder, contact us for more information) – the list could go on and on, but that’s not the point of this blog article!
Instead, we’re going to consider one of these examples and look at the end-to-end analytical pipeline that leverages Big Data and AI, specifically Natural Language Processing (NLP) and Machine Learning (ML). We’ll explain how semi-structured text is parsed and formatted, and how data is stored and managed to enable analytical applications, both descriptive and predictive.
1. Case Study
A fictitious oil and gas company called MaxOil has hundreds of wells that are being drilled and exploited daily. A Daily Drilling Report (DDR) is generated in PDF for every well (every day); the DDR has a predefined format, as shown in Figure 1, and contains details about the well, the number of resources deployed, its current status according to planning, cost details, etc. It also includes information about the exact activities carried out during the day: for every activity, the elapsed time, a description of the activity and whether there was non-productive time (NPT) or not are included.
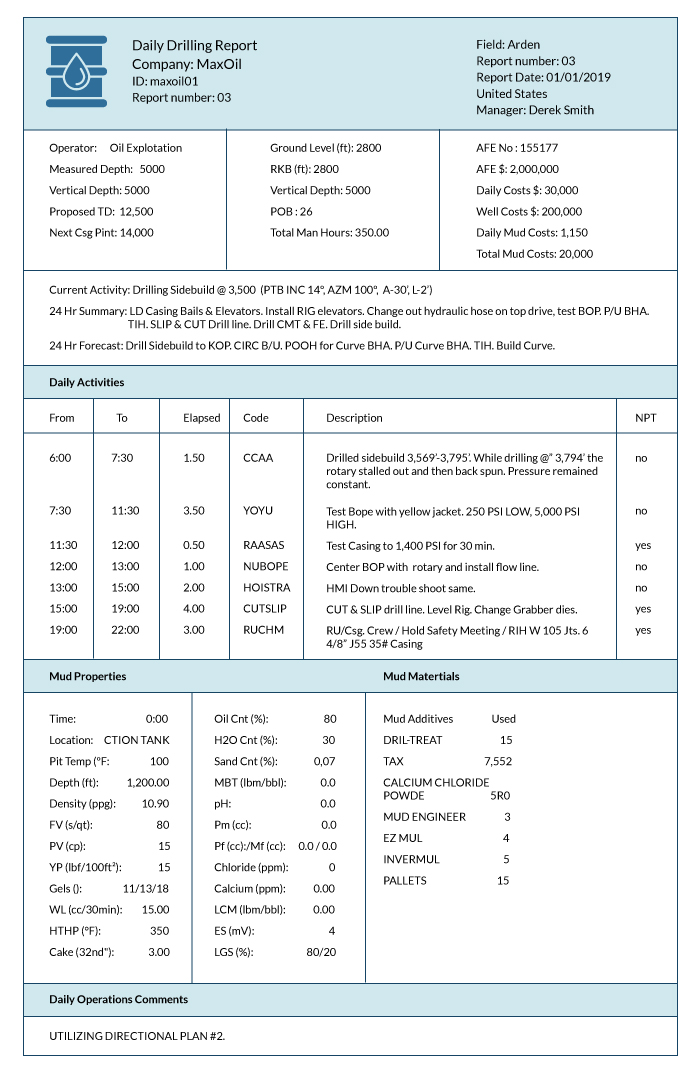
Figure 1: Example DDR
MaxOil wants to increase the drilling efficiency in their wells by minimizing NPT, and has asked us, ClearPeaks, to create a solution that can do descriptive and predictive analytics on the DDRs and especially on the NPT, so that their analysts can better understand the root causes and then take actions to mitigate them.
2. Challenges
For the implementation of this solution, there are various challenges that need to be taken into account:
- Number of reports: the company operates hundreds of wells, so there are hundreds of DDRs per day. The company has been operating for decades, so there are millions of DDRs with tens of millions of drilling activities to analyse.
- Extracting the relevant information from the PDFs: even though we could use a direct connection to the RDBMS where they are stored in order to extract the fields we need, we’re going to use only PDFs as input so as to demonstrate how to deal with this scenario.
- Analysing NPT: this requires the analysis of a text field containing the description of the activity that led to NPT, a description filled in by field engineers using completely free-form text (even though there are some standard terms like o.w., which means waiting on weather).
3. Solution Overview
We have combined Big Data and AI to create a solution that can interactively analyse NPT for the different wells, and filter by DDR attributes, and by the description of the activities done during the drilling. Because the description of an activity is a natural text written by well engineers, we use a search engine on this field; using NLP, we have enhanced the search capabilities to include semantic search, and we have also done clustering of the NPT (using the description of the activity) to identify and analyse the types of cause that trigger NPT. For example, we can analyse the effect of weather on the amount of NPT by well, or for the wells in a geographical region. We have also used Machine Learning to predict the NPT for a well and a day.
Our solution is based on Cloudera and we leverage the following services:
- HDFS as the data storage layer.
- Hive as the processing engine and enabler of SQL access to data.
- Solr (Cloudera Search) as a scalable search engine for text attributes which can be enhanced to calculate cosine similarity between embedding vectors, powering highly scalable semantic similarity searches.
- Morphline & MapReduce to load data into Solr.
- Spark as the processing engine and enabler to run NLP and ML (SparkML and TensorFlow 2.0).
- Impala as a fast SQL engine to access the data.
We also use Docker to run processing containers and Tibco Spotfire as the visualization / reporting tool.
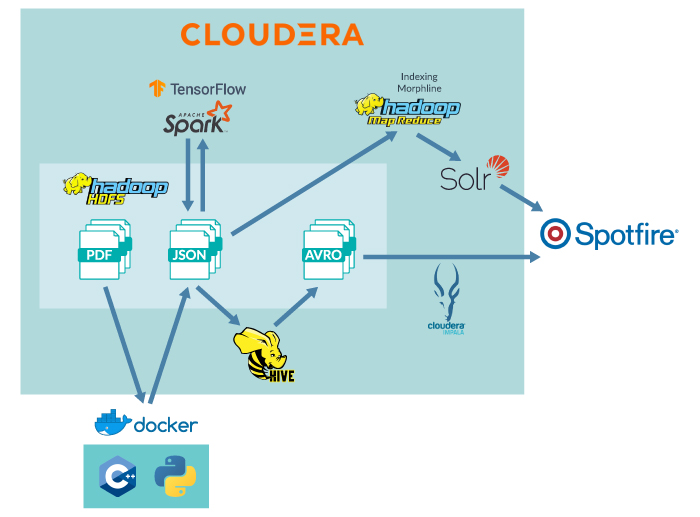
Figure 2: Data flow overview
Figure 2 depicts an overview of the data flow in our solution. Now we’re going to outline the various steps in this flow and later on we will give greater detail for the various parts of the pipeline.
Every day the PDF files from the previous day are processed into JSON files by a docker container that runs C++ and Python code. Using TensorFlow and Spark we process the JSON files and create new JSON files with the data contained on the DDRs parsed, structured and extended. The processed JSON files also contain our predictions for the NPT for every DDR. Note that for every DDR we know what the actual NPT is, but we want to demonstrate the capability to predict the NPT without using directly related information; this way we can create a model that is able to predict the NPT for future well operations and that could help MaxOil improve well drilling efficiency by anticipating issues.
The processed JSONs are loaded into Solr (Cloudera Search); they are also processed with Hive to create Avro files; then we create Hive tables from the Avro files so that they can be accessed by Impala.
Finally, we create some Spotfire dashboards to provide interactive and easy-to-use analytic capabilities, able to access both Hive tables (though Impala) and the Solr-indexed data.
4. PDF Parsing
As mentioned earlier, the best approach to extract the fields from the PDFs would not be to use the PDFs as input in the first place, but to extract the various fields directly from the RDBMS. However, so that we can see how to deal with PDFs as input for these types of analysis, we’ll ignore this obvious best approach and consider a few other options:
- Option 1 – Index the PDFs directly into Solr with Tika and Morphline: this approach treats all PDF content as a single entity; individual fields are not extracted.
- Option 2 – Deterministic parsing of the PDFs to extract all fields based on known positions of the fields (or relative positions).
- Option 3 – ML parsing of all fields, i.e. create a ML model to automatically extract fields from a set of tagged PDFs.
- Option 4 – Use commercial applications such as Amazon Textract or cinnamon.ai.
Since we need to extract the fields from the PDFs (all the PDFs have the same format) and as we also wanted to explore non-commercial solutions, we implemented Option 2. We created a docker that first converts the PDFs into HTML, then a Python program uses the positions of the HTML tags to extract the various fields. Finally, for every DDR two JSON files are generated. The first JSON file contains as many JSON records as activities done during the day, and every JSON record contains an activity with its description and a few attributes to identify which DDR the activity is related to (namely the well identifier and report number). The second JSON file contains one single JSON record with all the fields of the DDR except the activities.
The first JSON looks like this (the snippet shown is a simplification of the actual JSON):
{
  "Report_No": "1",
  "Well_Name": "XX123",
  "StartDateTime": "6/30/2019   4:00:00PM",
  "EndDateTime": "6/30/2019   6:00:00PM",
  "Hours": "2.00",
  "Accountable_Party": "XX COMPANY",
  "Code": "101",
  "Fail_Cat": "WAITING ON",
  "Description": "Waiting on equipment replacement",
},
{
  "Report_No": "1",
  "Well_Name": "XX123",
  "StartDateTime": "6/30/2019   6:00:00PM",
...
The second JSON looks like this (the snippet shown is a simplification of the actual JSON):
{
    "Report_No": "1",
    "Well_Name": "XX123",
    "Rpt_Period_Start": "6/30/2019 01:00:00AM",
    "Rpt_Period_End": "6/30/2019 10:00:00AM",
    "Well_Start_Date": "2/15/2014",
    "Well_Age": "4",
    "Rotating_Hrs": "",
    "Planned_Days": "400",
    "Planned_Cost": "5,111,233.00",
    "Supp_Days": "",
    "Supp_Cost": "0.00",
    "Local_Latitude": "12° 34 44.035 N",
    "Local_Longitude": "23° 22 11.128 E",
    "Orig_KB_Elevation": "",
    "Ground_Elevation": "",
    "Working_Elevation": "63 (ft)",
    "Water_Depth": "41.30 (ft)",
       ...
},
5. Processing and applying ML and NPL
We use Spark and TensorFlow to process the 2 sets of JSON files: the first set contains JSON files with many JSON records, one per activity in a DDR; the second set contains JSON files with a single JSON record per DDR. We’ll call the first set the Activity JSONs, and the second set the DDR JSONs.
5.1. Enabling semantic search on the NPT activity descriptions
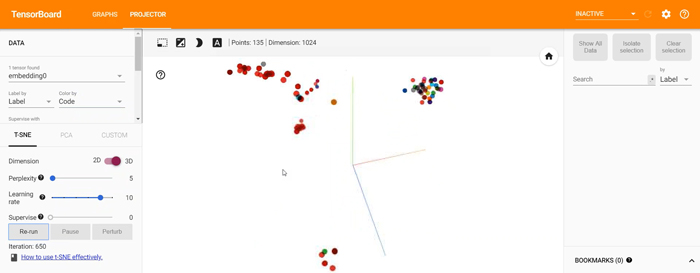
Our objective in this part is to get a high-level understanding of the text description of each NPT event; to do so we will use one of the SOTA algorithms in the field of NLP, ELMO embeddings. By using this pretraining algorithm we are able to convert the descriptions to a numerical vector which encodes some of the semantic meaning of the sentence.
Algorithms capable of performing this embedding such as ELMO and BERT are a current hot topic in research, and to develop this solution we tested some of them and found that ELMO worked best. We believe this is due to the non-restrictive vocabulary being able to better handle specific field jargon; nevertheless, this decision is not final as better models are being developed constantly – recently (2019/06/19) a new model (XLNet) beat several SOTA results.
We will load the embedding vectors into Solr later to enable semantic queries in the scalable search engine, but at this stage (within TensorFlow) we can already explore what it will look like:
5.2. Clustering NPT activities
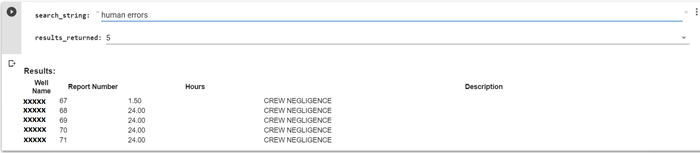
Using the embeddings created we can apply clustering techniques to group the NPT activities and to identify semantically close descriptions providing us with something similar to an “error reason” field; we were able to observe a cluster for reasons related to weather, another for reasons related to human error, etc., as well as several anomalies with a low number of occurrences which warranted further analysis.
5.3. Predicting NPT
Using the various fields in the DDR (using the second set of JSONs), we attempted to predict the total NPT per DDR based on previously known fields. We binned the predicted total NPT per DDR in 4 bins: 0 hours (no NPT), 0.1-6 hours, 6-12 hours and >12 hours.
With this model we could also obtain the feature importance: this provided us with insights such as the fact that the most important field contributing to NPT was the number of personnel working on that day.
5.4. Output JSONs
After computing the vectors and the predictions we dump the two output sets of JSONs back to HDFS. The first output JSON is the output Activity JSONs, and for every activity it also contains the embedding vectors; the second output is the output DDR JSONs, and every DDR has the predicted NPT.
6. Loading into Solr (Cloudera Search)
We load the output Activity JSON files with the embeddings/vectors into Solr to provide search capabilities (including semantic search).
First, we need to create the Solr collection: we create an instance directory with an updated schema.xml to specify the schema of our data and then create a collection:
$ solrctl instancedir --generate /home/myuser/ddor_ac
$ vim /home/myuser/ddor_ac/config/schema.xml
$ solrctl –zk vm-master-01:2181,vm-master-02:2181,vm-worker-
01:2181/solr instancedir –create ddor_ac /home/myuser/ddor_ac
$ solrctl –zk vm-master-01:2181,vm-master-02:2181,vm-worker-
01:2181/solr collection –create ddor_ac -s 1 -r 1
- Note that we have to specify our Zookeeper services, which are 2 master nodes and 1 worker.
- In the file schema.xml we specify the various fields of our JSON records including the embeddings field (we used the plugin in https://github.com/saaay71/solr-vector-scoring).
- For this example, we create the collection with just one shard and one replica.
Second, we use the MapReduce Indexer tool to index the data in Solr using Morphlines:
$ export HADOOP_USER_NAME=clearpeaks
$ hadoop jar /opt/cloudera/parcels/CDH/lib/solr/contrib/mr/search-mr-*-job.jar \
org.apache.solr.hadoop.MapReduceIndexerTool \
--zk-host vm-master-01:2181,vm-master-02:2181,vm-worker-01:2181/solr \
--collection ddor_ac \
--morphline-file ddor_ac_morphline_config.conf \
--go-live \
--output-dir hdfs://vm-master-02:8020/tmp/clearpeaks/ddor_ac \
hdfs://vm-master-02:8020/user/clearpeaks/ddor_ac
- The ddor_ac_morphline_config.conf contains the instructions to parse the JSON and load it into Solr.
7. Creating Avro files and Hive tables
We also create external Hive tables for the two output JSONs sets, and then an Avro Hive table for easier, faster access. Here is the example for the Activity JSONs:
ADD JAR /opt/cloudera/parcels/CDH/lib/hive-hcatalog/share/hcatalog/hive-hcatalog-core.jar;
DROP TABLE ddor_ac_table;
CREATE EXTERNAL TABLE ddor_ac_table
(
my_array ARRAY<struct<
Report_No:string,
Well_Name:string,
StartDateTime:string,
EndDateTime:string,
Hours:string,
Accountable_Party:string,
Code:string,
Fail_Cat:string,
Description:string
>>
)
ROW FORMAT SERDE 'org.apache.hive.hcatalog.data.JsonSerDe'
WITH SERDEPROPERTIES ( "ignore.malformed.json" = "true")
LOCATION "/user/clearpeaks/ddor_ac";

DROP TABLE ddor_ac_table_avro;
CREATE TABLE ddor_ac_table_avro STORED AS AVRO AS select a.* from ddor_ac_table m
lateral view outer inline (m.my_array) a;
- Note that we must load a JAR library to activate the JSON Serde.
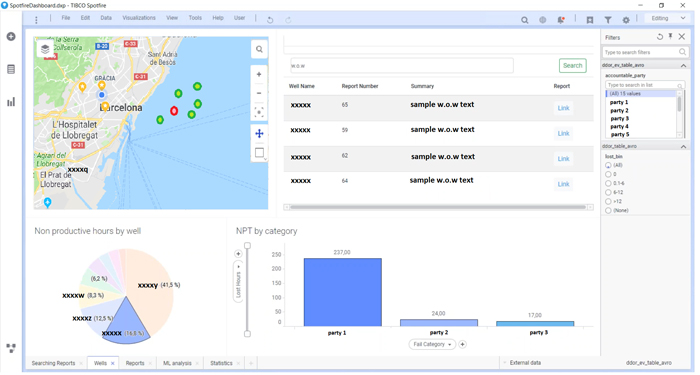
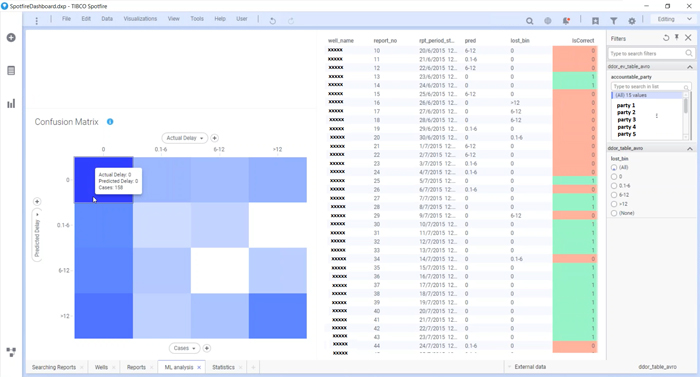
8. Creating dashboards
We now have our Solr collection with all the activities of the DDRs as well as the two Hive tables where we can access the DDRs with the NPT predictions and activities.
We have created some Cloudera Search dashboards as well as some in Tibco Spotfire to be able to visualize both sources on the same page. Note that Spotfire supports Impala out-of-the-box (if the driver is installed) but it does not have a built-in connector for Solr. However, since Solr provides a REST API (which can be explored with the Solr Admin UI) it was not complicated to create a custom connector to Solr with Spotfire. Please find below some of the dashboards that we have created. It is possible to filter by well and observe the cause of the NPT, and we can also filter on the activities description using search (including semantic search); we have created a dashboard to analyse the output of the NPT predictions as well.
Conclusion
In this blog article we have explored a scalable solution to analyse semi-structured data containing fields with natural language; we have examined various options to parse the data, and seen how NLP and ML can be combined with Big Data techs and applied to assist in descriptive and predictive analytics, easily done with a reporting tool such as Tibco Spotfire. The example shown is meant to give an orientation of the type of analytics that is possible, even if data is not structured in tabular formats and contains text fields on which we want to do advanced analytics. For more information on how to deal with and get the most from unstructured and semi-structured data, and thus obtain deeper insights into your business, don’t hesitate to contact us! We will be happy to discuss your situation and orient you towards the best approach for your specific case.