16 Feb 2016 How to control your ETL performance
1. ETL processes and the importance of control
The term ETL, meaning Extract-Transform-Load, comes from the Data Warehousing field and was traditionally used to refer to those processes that transform and move data from the source system to the data warehouse.
Nowadays, the data movements that are done inside a company are much more than a simple source-data warehouse flow. Data supports many different business processes and it has to be shared across different business units and departments. Indeed, in high data-oriented companies, data and ETL processes are a vital part of key business processes such as customer analysis, fraud detection, mailing or any other high data consuming activities.
This increasing high relevance of data in companies has made ETL systems performance essential and an important concern not only for the BI team (usually in charge of the ETL system) but for many other teams. Thus, having a system that properly controls and shows the performance of all the ETL processes can have a very positive impact in terms of data reliability, early error detection and correction, and continuous process improvement.
2. A standard ETL Control System
At ClearPeaks, we identified this as a general requirement in all ETL systems and developed a standard easy-to-deploy system to control and show your ETL performance. We are not only talking about a simple system that logs the result of the executions in files or tables, but a more complete one that allows you to have a good visual feedback of your ETL performance. Therefore, questions such as “How did the executions go tonight?”, “Why can’t I see any data?” or “Is the execution time of this ETL increasing?” will become easy to answer by just taking a look at your Tableau dashboards.

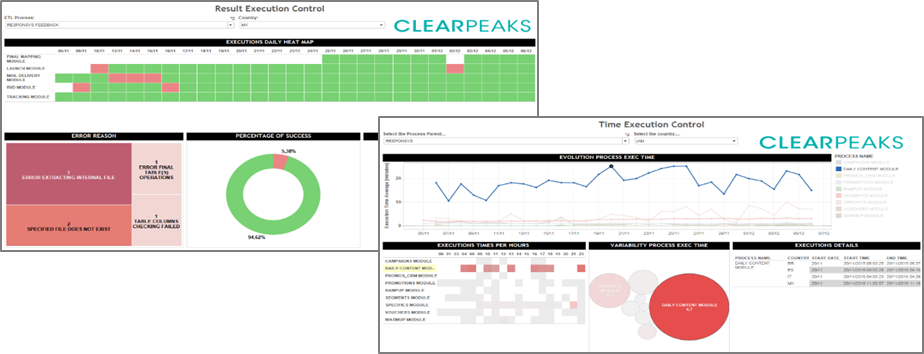
Figure 1. Tableau dashboards of the ETL performance control system
Specifically, we developed two dashboards that offer solutions to the two principal issues when controlling a process; the final result and the time spent. There is one dashboard that informs on execution results, common errors and percentages of success (left-top of Figure 1), and another one that shows execution times and time variables (right-bottom of Figure 1).
These dashboards are designed to enhance scalability and easy implementation so they are useful for any ETL. In the same way, the technical actions required to implement this system are also simple and compatible with any ETL. To empower this high level of standardization, the basics of the Business Intelligence methodology have been adapted to the ETL Control System architecture. Thus, the system is based on an unchanging star database model with some completely standard tables, and four simple functions or boxes (the exact term varies depending on the ETL tool) that must be included in the ETL. Initially, this system has been completely developed in Kettle ETL tool, so implementing the system in Kettle ETLs is very straightforward. On the other hand, if you are using a different ETL tool (such as Oracle DI or Informatica PowerCenter), a mapping from the logs to the star database model must be done.
So do you think you also need to control your ETLs? Would you like to do it with good visualizations? Contact us at info@clearpeaks.com or use our web form if you would like more information about the ClearPeaks ETL Control System, or leave us your comments below!
Blog Article Authors: Pere Vegas & Daniel Albendín