
11 Jul 2017 Extending Oracle DVD Map functionality
1. The challenge
Despite Oracle Data Visualization Desktop (DVD) having now caught up with the leaders in the data visualization quadrant, there are, like in any product, still detailed functionalities which can always be enhanced. As such we are excited to share this product enhancement related to the map functionality with you. In the example below, you can see an out-of-the-box DVD map visualisation showing traffic violations in US.
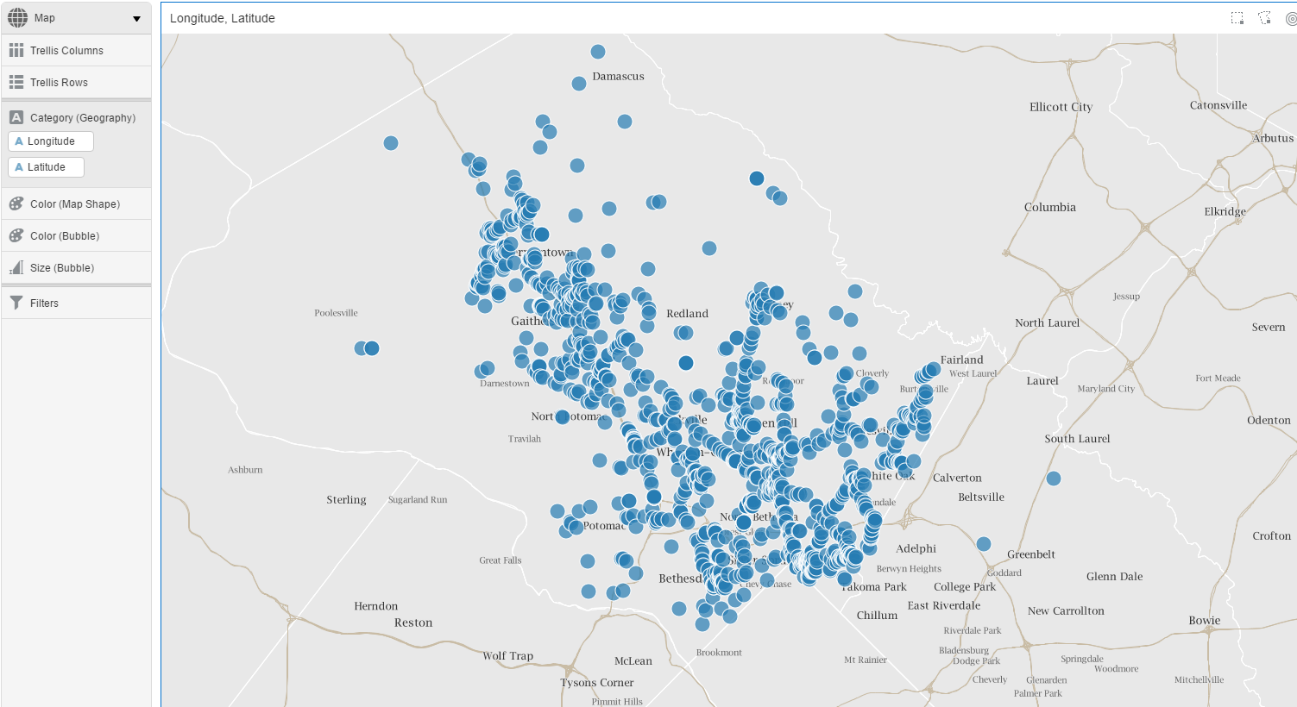 |
Figure 1: US traffic violations map chart |
As you can see there is only a limited amount of insight which can be drawn from this visualization. Let´s try to build on this by adding some sizing based on a measure – in this case, the number of accidents:
 |
Figure 2: US traffic violations map chart- sizing added |
Even after colouring it with the app’s fine amount (Fine Amt), it still looks like something is missing.
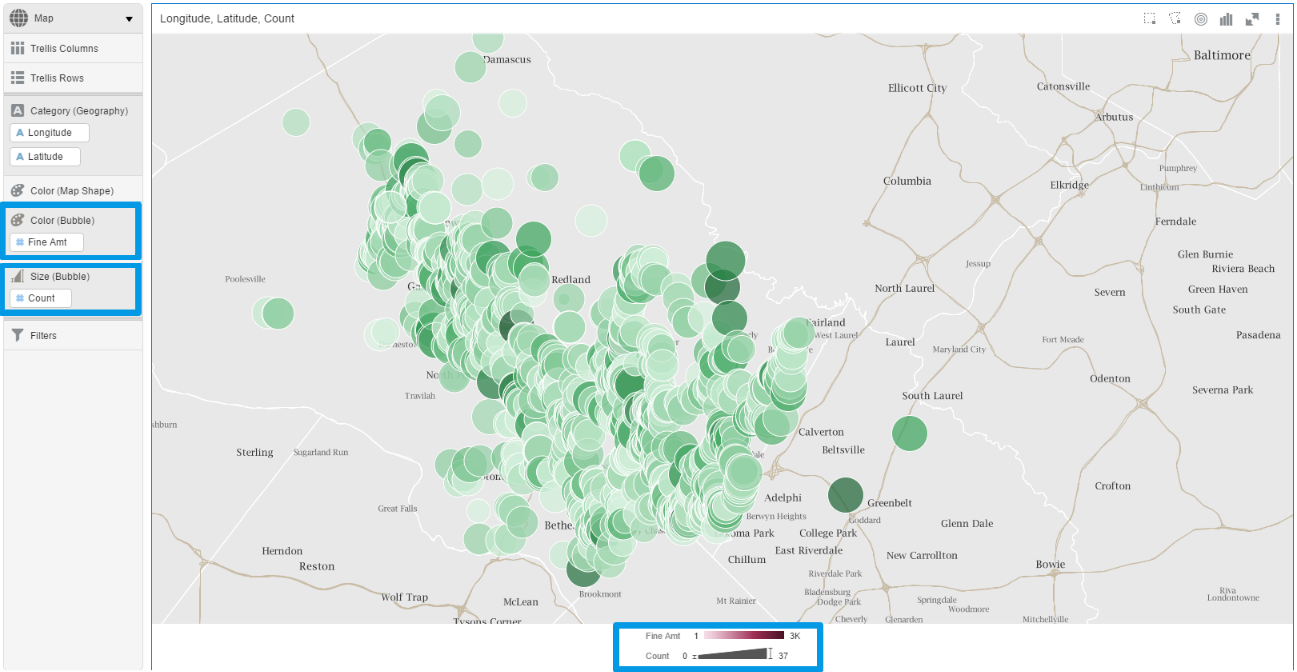 |
Figure 3: US traffic violation – Formatted version |
It’s possible that we could improve our visualisation by colouring by a dimension instead of by a measure; however, DVD does not allow dimension values at this time.
2. DVD 12.3 Plugin
Let´s try downloading the Custom Points Map Plugin from the Oracle Store instead.
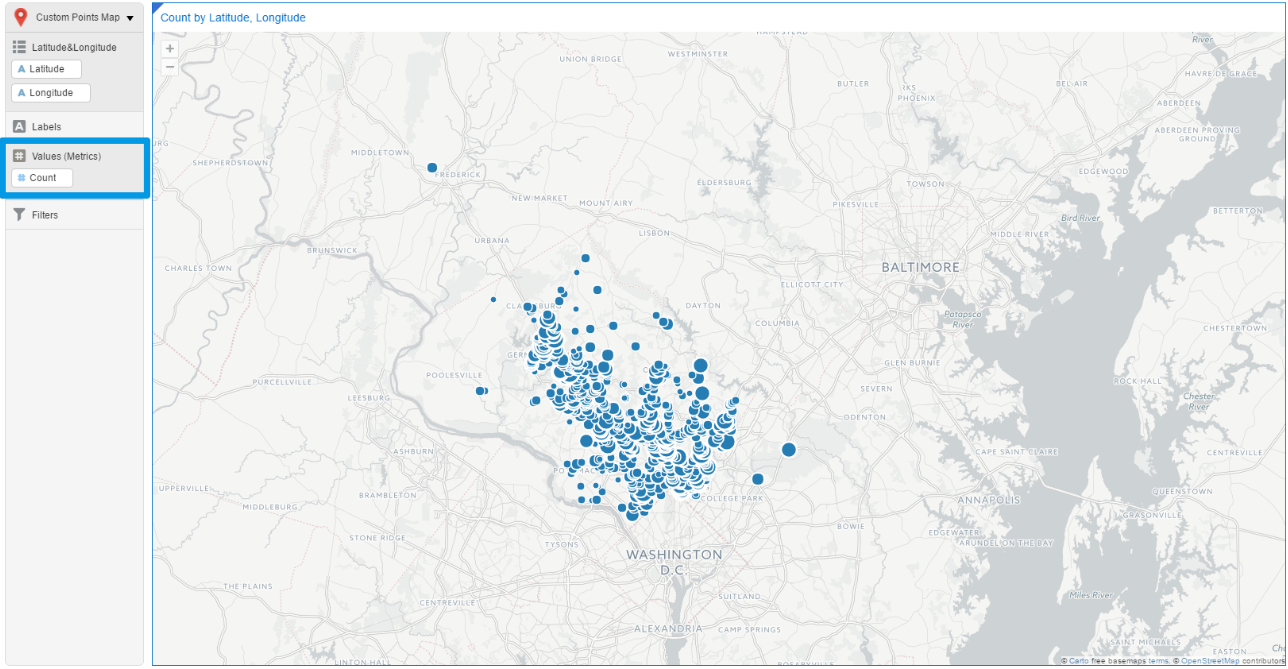 |
Figure 4: US traffic violations – plugin used |
Ok, that looks nicer. The ability to control the size of the dots really helps for better chart comprehension, but the plugin still lacks helpful functionalities, such as being able to colour values by dimension. Further inspection of the plugin leaves much to be desired. What if you decide to maximize or minimize the visualisation? (⤢):
 |
Figure 5: Maximize map chart |
Well, not the best vantage point. Of course, you can resolve this by simply zooming in several times… until the moment you have to max out again.
3. The ClearPeak’s solution
So are you ready now for a bit of magic? Let me present to you the solution that ClearPeaks developed in order to enhance the user experience. By simply adding some adjustments to the code, we were able to address all of these issues while utilizing the same visualisation tool (Oracle DVD 12.2.3) and plugin (Custom Points Map Plugin) as before. Alright, now we are ready to explore our data!
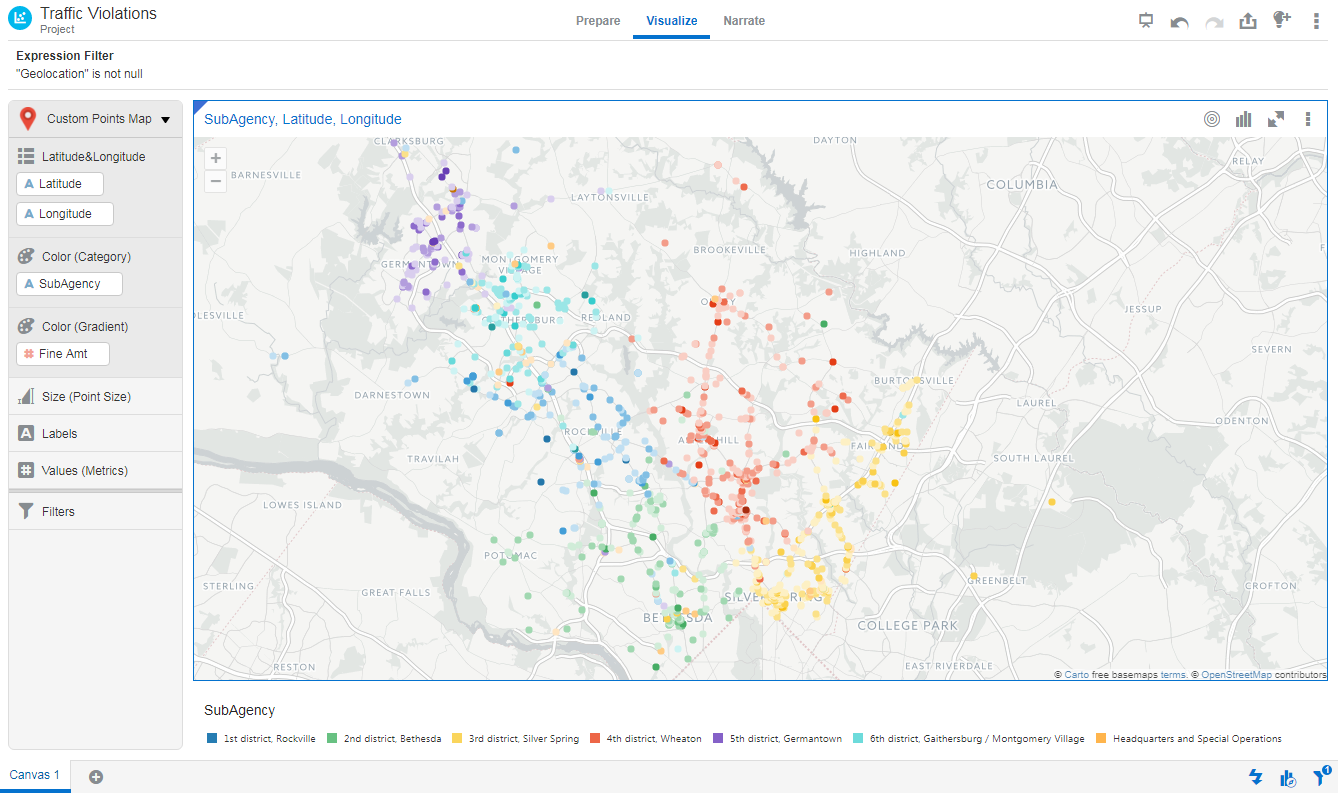 |
Figure 6: US traffic violations – using updated plugin version 1 |
Our first order of business was to resolve the dimension colour problem, enabling this feature for our customer. This was such an improvement! Now it´s much easier to find recognizable patterns or dependencies. We also thought that it may be wise to implement a colour gradient for measures in order to promote further and more accurate analysis of our data, so we did that too!
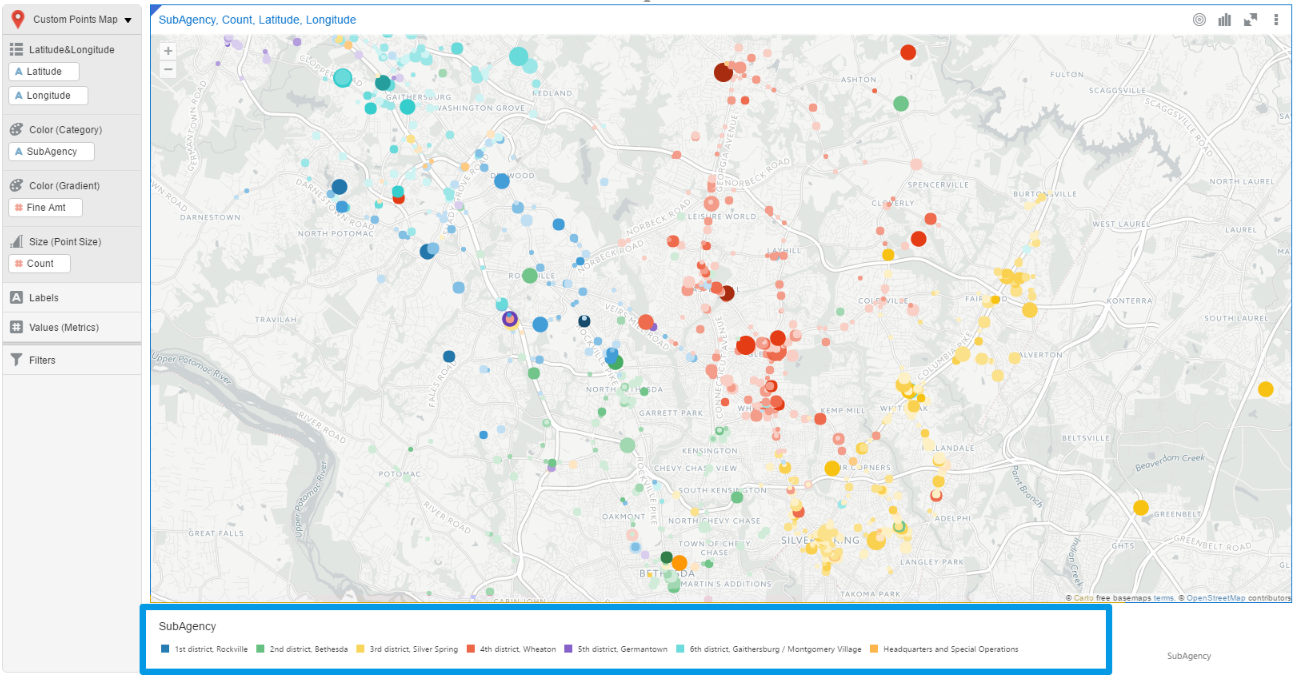 |
Figure 7: US traffic violations – using updated plugin version 2 |
Oh, and the problem with the zooming in/out? Yeah, we fixed that as well. This is the final result of our tweaks:
 |
Figure 8: US traffic violations – using updated plugin – final version |
Looks much nicer, right? Unfortunately, as nothing in life is ever truly perfect, there are still some inconveniences with our touch-up, namely, legends are not available at this time. The good news is that there is a work-around for this problem, called “list chart”. To take advantage of it, add a second visualisation onto your canvas and drag the dimension (SubAgency) into it. Select “list chart” as a visualisation and you’ll have your legend. Do not forget that DVD keeps the colour context within a canvas, so you should not worry about losing your legend.
Curious about how to make this solution work for you too? Luckily, you just have to follow the architecture of the plugin. Define which boxes (colour dimensions) you want to see and which values are allowed in it (i.e. colour boxes for dimension values and size box and gradient colours for measure values). Then, make sure to include them in the plugin.xml file. After that, link them with the map visualisation in the pointsMapVizdatamodelhandler.js file. Defining further details about the colours, buckets, etc. can be done in pointsMapViz.js. Of course, all changes should be synchronized with the main map library used by Oracle – oraclemapsv2.js.
4. Demo
Check out a demo of this solution below: https://youtu.be/nHW5tYy5XP8
Conclusion
Even though there are still some restrictions when using DVD as a reporting tool, Oracle is really heading in the right direction with this new version – 12.2.3, especially with their custom plugins idea. By giving the users the opportunity to download and create new plugins and adjust the code of the plugins according to everybody´s needs, Oracle DVD offers a flexibility that nowadays is required on the BI market. If we combine all this with ClearPeaks’s know-how, it really is a recipe for turning every Oracle DVD project into a success.
Contact us if you’d like to receive more information about this solution.

