
20 Apr 2020 Predicting employee attrition with Machine Learning using KNIME
Data is the new oil. More and more data is being captured and stored across industries and this is changing society and how businesses work. Traditionally, BI has tried to answer the general question “what has happened in my business?”; this would translate into more specific questions depending on the industry: How many products did we sell? How much did we spend on that marketing campaign? What is the loan default rate? How many employees left my company? Today, companies are involved in a digital transformation that enables the next generation of BI: Advanced Analytics (AA). With the right technologies and a data science team, businesses are trying to get an answer to a new game-changing question: What will happen in my business? This translates into more specific questions depending on the industry: How many products will we sell? How much should we spend on each marketing campaign? What is the predicted loan default rate? Which employees are about to leave?
We are already seeing how AA is helping to increase profits in many companies. However, some businesses are late in the adoption of AA due to a lack of information about its power and all the ways it can be used, while others are trying to adopt AA but are failing for various reasons. In most cases, the non-adoption or failed adoption is not due to a technology gap, since almost any organization can now access AA technology, be it through open-source languages such as R or Python, or through tools that ease Artificial Intelligence (AI) operations such as KNIME, Alteryx, Dataiku, Rapidminer, Oracle Data Miner, H2O, Azure Machine Learning Studio, Amazon SageMaker, etc.
ClearPeaks is already helping many businesses to adopt AA, and in this blog article we will review, as an illustrative example, an AA use case involving Machine Learning (ML) techniques. The success of the digital transformation and AA adoption in any business depends on the participation of most of its departments. And, of course, HR departments are key to driving the deep cultural change required, recruiting employees with new capabilities, developing in-house training plans, and most importantly, retaining the most talented employees. We cannot think of a better use case for this blog entry than one that will help companies along their AA adoption journey by keeping the talent making that adoption possible.
Today we will show you how Advanced Analytics with Machine Learning can help HR departments to retain talent. Employee attrition refers to the percentage of workers who leave an organization and are replaced by new employees; a high rate of attrition in an organization leads to increased recruitment, hiring and training costs. Not only is it costly, but qualified and competent replacements are also hard to find. In most industries, the top 20% of people produce about 50% of the output. (Augustine, 1979). On average, organizations invest between four weeks and three months training new employees. Reducing attrition translates into consistent production, reduced recruiting costs, consistent customer contacts and the enhanced morale of the remaining employees.
1. Use Case
This attrition use case takes HR data from a dataset IBM published some time ago; you can download it from Kaggle. We will use machine learning models to predict which employees will be more likely to leave given some attributes; such a model would help an organization predict employee attrition and define a strategy to reduce this costly problem.
We will use KNIME, an open-source tool for developing AA projects, positioned as leader in the Gartner 2019 Magic Quadrant for Data Science and Machine Learning Platforms. With KNIME we can perform data extraction and transformation, feature engineering, as well as model training and evaluation. There is no need for coding, just drag and drop the built-in transformations and machine-learning models onto pipeline canvases.
KNIME also offers an enterprise edition, KNIME Server. This allows multiple users to work on the same projects, to share files and opinions. You can deploy models in production, automate workflow executions, and implement security access to workflows and data. Control versioning, job monitoring and scalability are other key features that KNIME Server boasts.
The input dataset is an Excel file with information about 1470 employees. For each employee, in addition to whether the employee left or not (attrition), there are attributes / features such as age, employee role, daily rate, job satisfaction, years at the company, years in current role, etc. In the rest of this article we will detail the steps we took with KNIME to implement a ML pipeline to predict employee attrition.
2. Data preprocessing
First, let’s look at the data. We import the Excel file with an Excel Reader node in KNIME and then we drag and drop the Statistics node (box with built-in processing action).
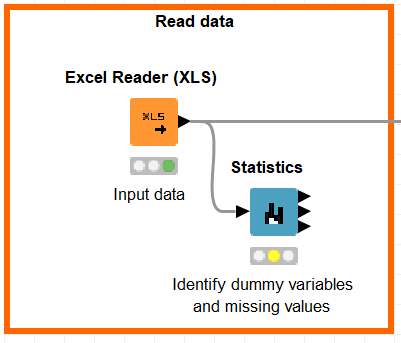
Figure 1: Input data & check statistics.
Right-click on any node to see the outputs generated. Good news, there are no missing values in the dataset. With Statistics view we can also see that the variables EmployeeCount, Over18, and StandardHours have a single value in the whole dataset; we will remove them as they are useless with regard to predictive significance.
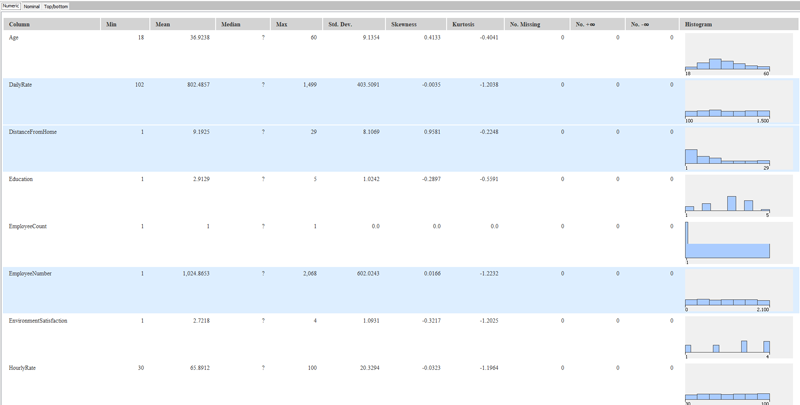
Figure 2: Checking missing values and single-valued variables in KNIME.
Let’s add a Column Filter node to exclude the aforementioned variables. We will also exclude the EmployeeNumber variable as it’s just an ID. Next, we can generate some features to give more predictive power to our model:
- We categorized Monthly Income: from 0 to 6503 it was labeled as “low” and “high” if it was over 6503.
- We categorized Age: 0 to 24 corresponds to “Young”, 24 to 54 corresponds to “Middle-Age” and over 54 corresponds to “Senior”.
- We aggregated the fields EnvironmentSatisfaction, JobInvolvement, JobSatisfaction, RelationshipSatisfaction and WorkLifeBalance into a single feature (TotalSatisfaction) to provide an overall satisfaction value.
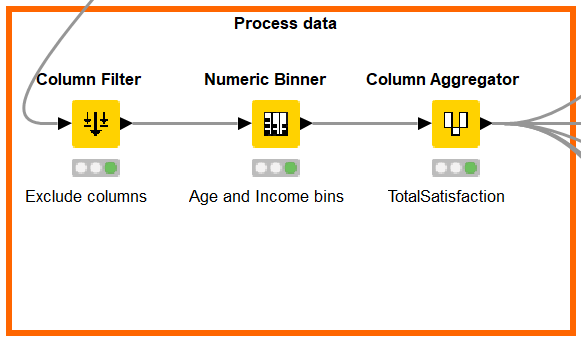
Figure 3: Generating features with KNIME.
3. Data analysis
At this point we will analyze the correlation between independent variables and the target variable, attrition. We will use Tableau as it has much nicer plots. As a sample, you can see 4 analyses below:
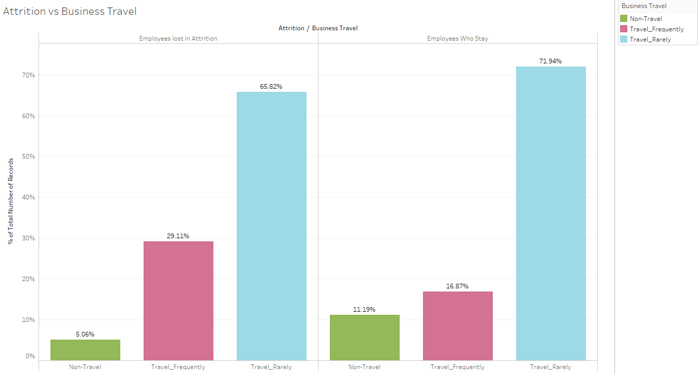
Figure 4: Attrition vs Business Travel.
We can see that employees who travel a lot tend to leave the company more often; this will be an important variable for our model.
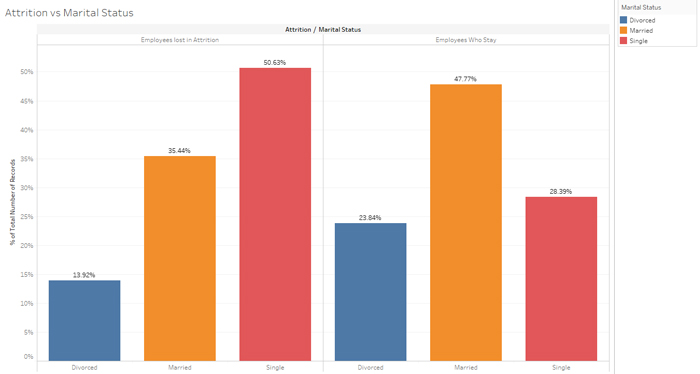
Figure 5: Attrition vs Marital status.
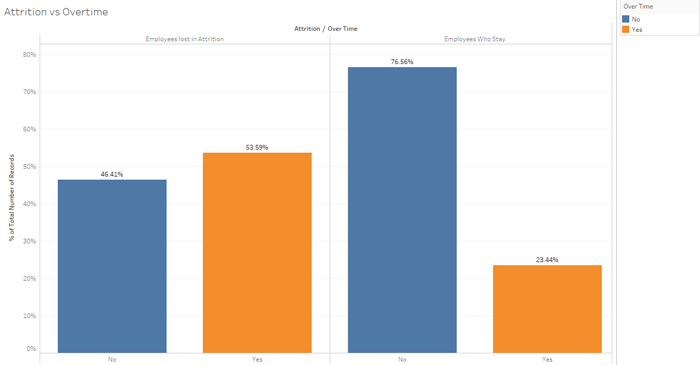
Figure 6: Attrition vs Over time.
In a similar way, single people working over time hours tend to leave at a higher rate compared to those who work regular hours and are married or divorced.
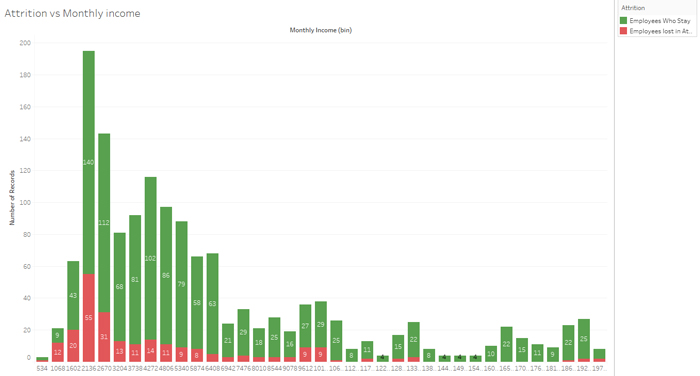
Figure 7: Attrition vs Monthly income.
Finally (and as could be expected), low salaries make the employees more likely to leave.
4. Model training
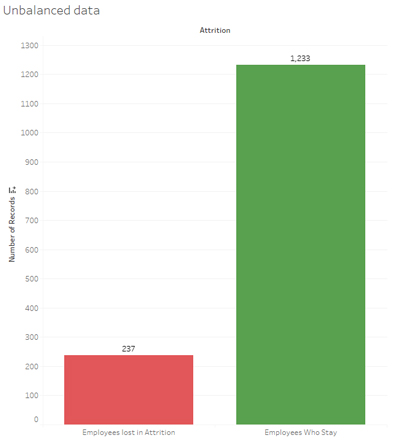
Figure 8: Unbalanced Data.
As the graph shows, the dataset is unbalanced. When training models on such datasets, class unbalance influences a learning algorithm during training by making decision rules biased towards the majority class and optimizing the predictions based on the majority class in the dataset. There are three ways to deal with this issue:
- Upsample the minority class or downsample the majority class.
- Assign a larger penalty to wrong predictions from the minority class.
- Generate synthetic training examples.
In this example we will use the first approach.
To begin, let’s split the dataset into training and test sets using an 80/20 split; 80% of data will be used to train the model and the other 20% to test the accuracy of the model. Then we can upsample the minority class, in this case the positive class. We added the Partitioning and SMOTE nodes in KNIME.
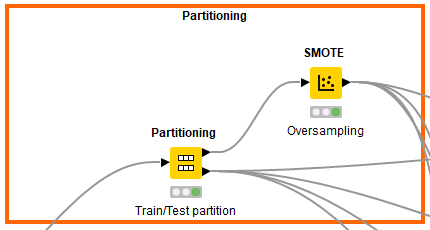
Figure 9: Partitioning and SMOTE in KNIME.
After partitioning and balancing, our data is finally ready to be the input of the machine learning models. We will train 4 different models: Naïve Bayes, Random Forest, Logistic Regression and Gradient Boosting. We can drag and drop the learner nodes to train these models, then connect the learner nodes with the predictor nodes and configure them. In this step, you should start modifying model parameters, perform feature engineering and balancing data strategies to improve the performance of the models. Try with more trees in the Random Forest model, include new variables, penalize wrong predictions from the minority class until you beat the performance of your current best model.
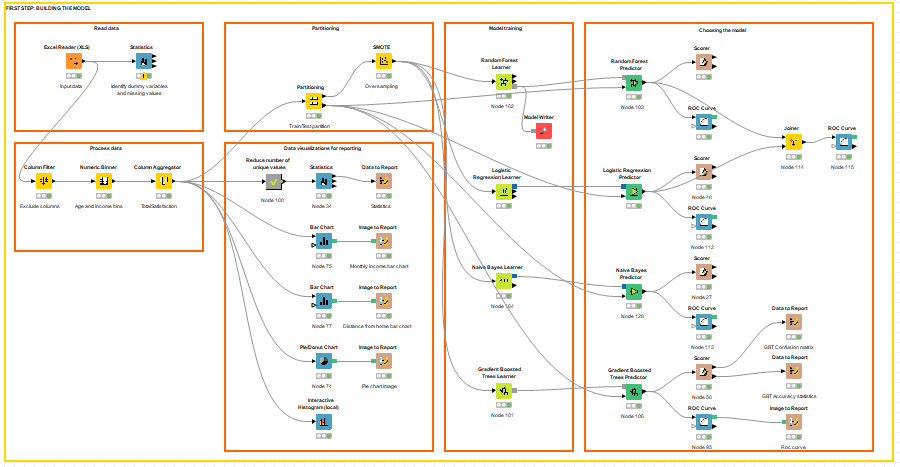
Figure 10: Train and test model.
5. Model validation
Finally, after testing our models with the test set, we concluded that best model was the Random Forest (RF). We can save the trained model using the Model Writer node. We based our decision on the statistics we see in the following table:
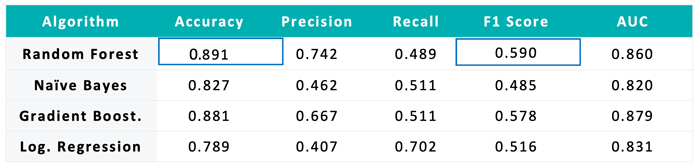
RF has the highest accuracy, meaning it guesses 89.1% of the predictions correctly. Moreover, and more importantly, it has the highest F1 score, which gives a balance between precision and recall, and is the measure to use if the sample is unbalanced. The ROC curve is also a good measure to choose the best model. AUC stands for area under the curve, and the larger this is the better the model. Applying the ROC Curve node, we can visualize each ROC curve.
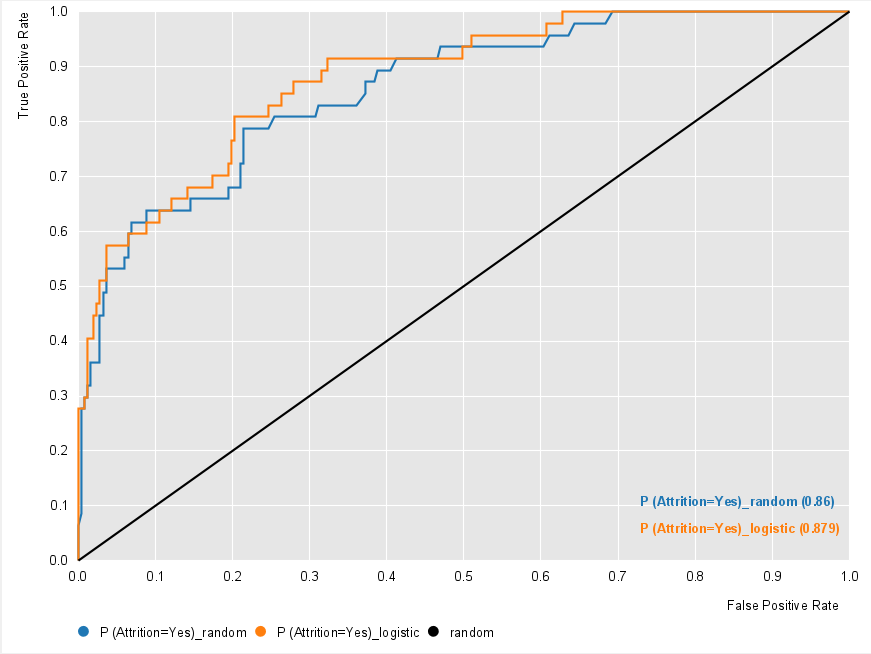
Figure 11: ROC curves: Random Forest & Logistic Regression.
These measures come from the confusion matrix, showing which predictions were correct (matrix diagonal) and which were not. We can check the confusion matrix out of the RF model.
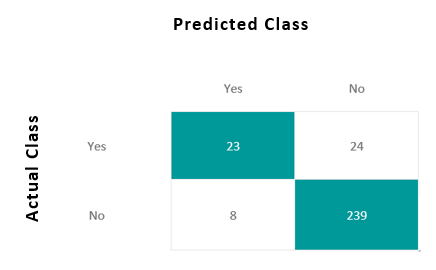
The Random Forest works on the Bagging principle; it is an ensemble of Decision Trees. The bagging method is used to increase the overall results by combining weak models. How does it combine the results? In the case of a classification problem, it takes the mode of the classes predicted in the bagging process.
Once we have chosen the best model, we can predict the likelihood of attrition amongst our current employees. We apply the saved model to the current employees, and generate a new workflow that outputs the predictions to be visualized in Tableau.
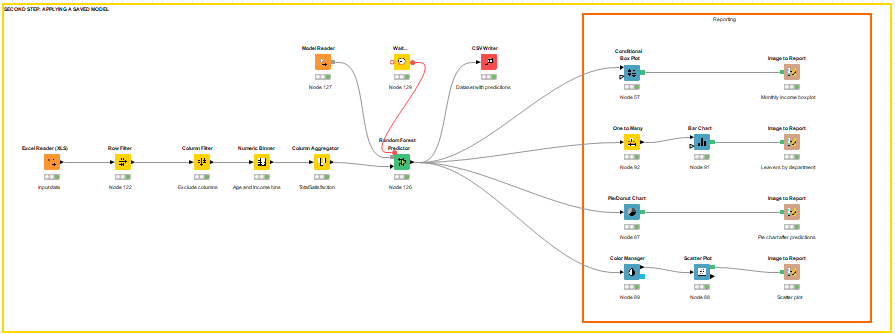
Figure 12: Prediction of attrition amongst current employees.
6. Visualization of results
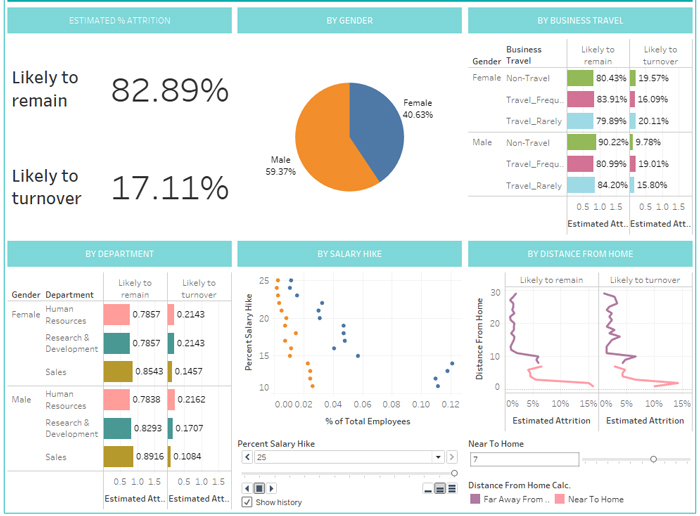
Now we have our dataset with our current employees and their probability of leaving the company. If we were the HR manager of the company, we would require a dashboard in which we could see what to expect regarding future attrition and thus be able to adopt the correct strategy to retain the most talented employees.
We will connect Tableau to this dataset and make a dashboard. (You can see what it would look like below). It contains analysis on percentage of predicted attrition, analysis by gender, business travel, department, salary hike or by distance from home. You can also drill down to see the employees aggregated in each of these analyses. As a quick conclusion, male employees who travel frequently, work in the HR department, have a low salary hike, and live far from the workplace have a high probability of leaving the company.
Conclusions
In this blog article we have detailed the various steps when implementing an advanced analytics use case in HR, employee attrition. We used the open-source tool KNIME to prepare the data, train different models, compare them and choose the best. With the model predictions, we created a dashboard in Tableau that would help any HR manager to retain the best talent by applying the correct strategies. This step-by-step post is just an example of what Advanced Analytics can do for your business, and of how easy it is to do it with the proper tools.
To Download the full Knime workflow, follow this link.
Here in ClearPeaks we have a team of data scientists that have implemented many use cases for different industries using KNIME, as well as other AA tools. If you are wondering how to start leveraging AA to improve your business, contact us and we will help you on your AA journey! Stay tuned for future posts!
This article is also published on the Knime Blog.
