28 May 2014 Tableau helps people see and understand their data
Tableau’s very short and sweet mission statement captures the very essence of why its highly visual BI software has taken the market by storm. With year-on-year sales growth still close to 100% – even a year after IPO and with 17,000 customers – it’s no wonder that Tableau is the product all the other vendors in a crowded BI market are running scared of and the analysts are ranking ever higher in their “Leaders” charts.
If you see and hear the infectious enthusiasm and passion of Tableau users, or experience the buzz of a Tableau Conference, you will start to realise that this product is pretty special.
The best way to appreciate why is to see Tableau in action – most business users who see Tableau, want it!
The last few years has seen the emergence and rapid growth of a new strand of BI technology known as “discovery-based analytics”.
Traditional BI generally enables the exploration of structured data through pre-built hierarchies and relationships: start with some high-level KPI’s, identify the areas of greatest interest (e.g. the ones performing below target), then drill and pivot down and across the various layers and groupings to home in on the underlying causes. In the hands of an experienced analyst, traditional BI enables very powerful insight and can identify actions to add significantly to the business bottom line.
Unfortunately, in many enterprise BI implementations, this tends to get dumbed-down and passed out to consumers as pre-built dashboards and reports that are glanced at but not explored, absorbed or understood. Maybe the graphs aren’t clear enough, the tables are too boring, the tools are not intuitive enough, or the canned reports just don’t answer the questions that you need to ask today.
The discovery-based model starts more from the premise that you don’t know what you don’t know, and the tools make it easy for you to have a conversation with your data without the preliminary round of wrestling the data into submission in Excel. And you can ask it the questions that you as a business user want to ask today, rather than the questions that the BI Development Team thought you might want to ask 12 months ago.
In a large organisation there is usually room and validity for both traditional and discovery approaches. In a smaller organisation, or for a specific business need, the discovery approach – typically requiring less up-front effort and cost to start getting value – can be very compelling.
Tableau is in our view the best of the discovery-based BI tools, enabling beautiful visualisation so that you can present data in a way that the human brain can interpret easily. But it’s not just about a tool being able to draw graphs – every BI tool can do that – it’s about creating the right type of presentation to convey the meaning. If you have played with any graphing tool you will know that it is can be very easy to create nonsensical charts, with pointless axes, too many bars/data points, inappropriate scaling and so on. And it isn’t always obvious how to create what you really mean!
Tableau, as well as enabling a huge set of highly visually-appealing chart types, won’t let you make a bad choice – based on the data you have selected, it will suggest only the representations that make sense. If you have too many data points, you can group all the small values together on-the-fly into a “Total Others” bar – just with a click and drag on-screen, no disappearing off to the admin console to create a new dimension value. Similarly, if a scatter-plot has a lot of outliers, you can just eliminate them from your analysis and focus your concentration on the area of interest.
What impresses me most about Tableau is how astonishingly easily it does things that I always felt other tools were struggling with, or just couldn’t do. It is crammed with so many useful analytical features that to describe Tableau as “a visualisation tool” misses much of the point!
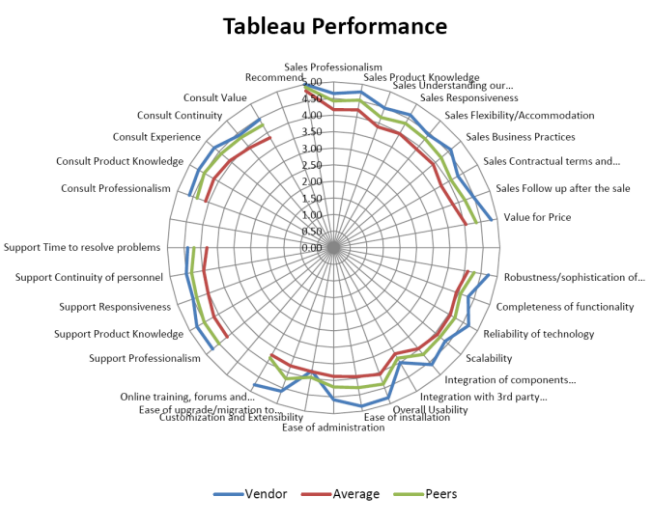
Tableau’s spider chart from Howard Dresner’s BI study.
Tableau gives the BI specialist all the analytical power and creativity that he craves; however, it isn’t aimed at just at the specialist – anyone who is comfortable with Excel, or indeed any information worker, can create their own analysis with very little training.
For dealing with the complexities of the real business world, Tableau has intelligent native connectivity to a wide and growing array of common data sources, and the product developers are rapidly adding more and more “enterprise” features at every release.
Of course, the discovery-based products – Tableau, Qlikview, Endeca, Spotfire and so on – are somewhat over-hyped in their marketing. The notion persists that you just take the tool, point it at any data, and off you go, with no technical knowledge or understanding of data structures. No need for months of building complex plumbing to make it all happen.
It’s true that you can connect to fairly straightforward sources (spreadsheets, flat files, non-complex databases) very easily, and indeed one of the beauties of Tableau is the capability to blend two or more sources together quickly and discover what results the combinations can throw up. But let’s take a quick reality check: most organisations have a complex collection of systems that probably aren’t integrated quite as well as they would like, and there remains no substitute or long-term shortcut for good data management.
The important thing is to strike a balance and understand the difference between rapid-fire data discovery – with possible inherent risks about the “food chain” of data provenance – and robust, consistent corporate information. Each has its place and value, and with a little structure, discipline and process, Tableau can front both of these approaches. The key is “just enough structure”.
Tableau enables you to deliver a very pragmatic and agile solution, especially if your data has some level of organisation to it, e.g. a data warehouse or a small number of datamarts, maybe enhanced by some properly-managed spreadsheet-based data (e.g. Targets or external benchmark data). Its capabilities can be extended by combining with an agile open-source ETL tool, plus maybe an extreme performance layer such as HP Vertica, in order to offer a very compelling , cost-effective and very fast solution even for Big Data analysis.
ClearPeaks helps you to get started with Tableau. We can help you to acquire the right software (we are a Tableau Partner reseller) – the entry cost can be very low, because there is no minimum number of users: you can buy just one user license to begin with if you wish!
We provide training through our excellent Academy (>92% customer satisfaction rating) and offer packages of startup services to help you get your project to first base quickly and build momentum from the success of a quick win:
- Installation, Planning, Training and Best Practices package
- Phase 1 Guided Implementation: Assist and Assure package
- Business As Usual package: 1 year of Support and mini-enhancements
Above all, we bring our many years of experience in implementing robust and successful BI solutions with major enterprise BI platforms such as OBIEE and Business Objects, to ensure that your Tableau implementation is enterprise-ready and doesn’t risk becoming an unmanaged cottage industry.
Are you curious about Tableau? Leave us a comment on what is your experience with Tableau or contact us if you would like to see a Demo.