02 Dec 2018 What´s new in Qlik Sense November 2018?
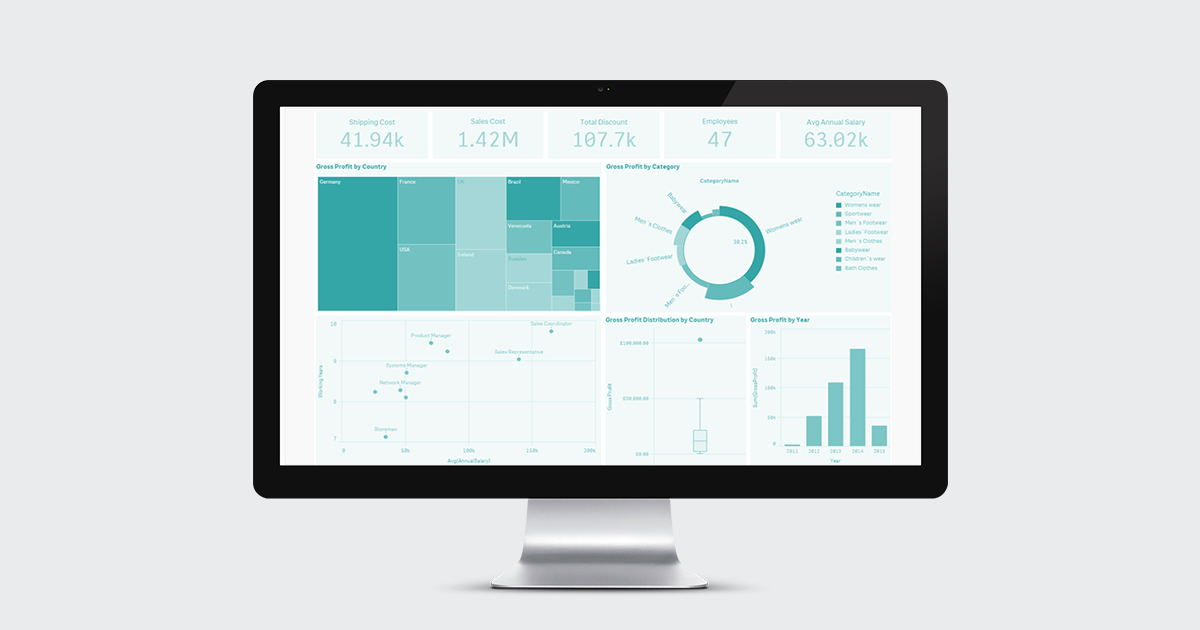
Qlik Sense is one of the best tools for data analysis and visualization due to its powerful engine, high processing speed and its great look and feel.
At the beginning of November 2018 Qlik launched the latest version of Qlik Sense, boasting some amazing features.
The newest features can be broken down into 7 different areas:
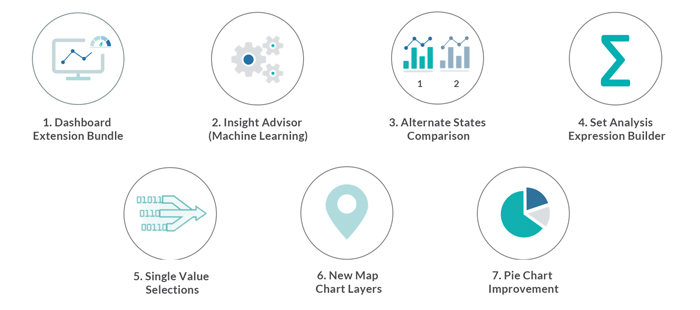
Figure 1: Different areas where Qlik has focused on new features.
This new features add extra value to existing functionalities but some also address the shortcomings of the previous version – issues that were mainly related to visualization capabilities.
Let’s take a look at the new capabilities in each area and see the value they are bringing to Qlik users.
1. Dashboard Extension Bundle
In this version, Qlik has added some of the most used extensions as default dashboard options; to make them available, check the following options during the installation/upgrade:

Figure 2: Chosen options to display Dashboard Bundle when editing a dashboard.
Once the new version is installed, there’ll be a new option in the Custom Objects panel when editing a dashboard. This is the Dashboard Bundle, containing a set of 6 extensions that will facilitate dashboard creation; we can see the possibilities offered by each of them and some use cases below:
1.1. Navigation Buttons
The Button for navigation extension allows the user to embed action-buttons in a dashboard page. In the following example 3 different buttons have been created to navigate to different pages by clicking on them:

Figure 3: Action-buttons embedded in a dashboard.
1.2. Date Selector
A dataset typically contains multiple dates, so managing and filtering them will always be necessary when analysing data. The Date picker extension permits the user to filter with multiple options, as we can see below:

Figure 4: Date picker to filter date field.
1.3. On demand Reporting
The On demand reporting extension allows the user to generate NPrinting reports on demand. This extension provides a specific action-button on the dashboard that enables the user to send a specific report in a specific format by clicking on it:

Figure 5: Demand report extension.
Before starting to use the extension, Qlik Sense must be connected to Qlik NPrinting, the tool to deliver any type of report; without Qlik NPrinting, this extension is pointless. For further details on how to deal with NPrinting connections, please click here.
1.4. Show/Hide Container
The Show/Hide Container extension allows Qlik users to display multiple custom visualizations based on different selections. Each filter combination can trigger a different visualization as a condition is set up for every custom object added to the container. When the condition is true, the visualization is prompted; otherwise, it’s not displayed. The visualizations added to the container must be master visualizations; if not, you should first define them as master objects and then refresh the page. In the following example, when Germany is selected the visualization is swapped for a pie chart visualization:

Figure 6: Show/Hide Container extension without any filters.

Figure 7: Show/Hide Container extension with Germany selected.
The change is driven by the following conditions:

Figure 8: Conditions typed to change the visualization displayed.
1.5. Tabbed Container
The Tabbed Container extension also introduces a feature to enable multiple visualizations in the same container. In contrast with Show/Hide Container, Tabbed Container allows the user to switch from one visualization to another by clicking on different tabs at the top. The selected visualizations must again be master items. As an added value inside each tab, users can enable the option to export the chart:

Figure 9: Tabbed Container extension.
1.6. Variable Input
The Variable Input extension allows Qlik users to implement 4 different ways of variable data filtering:

Figure 10: Input Variable extension.
A variable must be defined in order to filter and affect other visualizations. Buttons are used to filter specific values; the Drop down list is used to select one value from a list of values; the Input Box allows users to enter a specific value; a slider sets up a variable with the value selected in the bar.
2. Insight Advisor
The Insight Advisor is the automatic tool that uses the Qlik cognitive engine to create visualizations based on fields and master items that users select. It can also automatically create a set of visualizations by analysing the dataset as a whole. In the new November 2018 version, Qlik has added pattern and application machine learning capabilities to the cognitive engine that learn from the user’s interactions with the tool. These new capabilities are aimed at improving the machine learning model used to provide insights and basically make the tool provide smarter insights and more significant results.
These interactions can:
- Hide a generated insight.
- Designate if a suggested field should be used as a dimension or as a measure.
- Choose if a field should be not used at all in subsequent chart recommendations.

Figure 11: Qlik user interactive actions to improve the Insight Advisor module.
3. Alternate States
The new Alternate States feature allows Qlik users to perform comparative analysis with alternate states; a state is a specific group of value selections. This new capability is available at the bottom of the Master Items menu:

Figure 12: Alternate States panel inside the Master Items menu.
Alternate States is very useful to compare different states on a single dashboard page. To start comparing different states you must create the N-states in the panel shown in Figure 12. In the following example two different states have been created (Country1 and Country2):
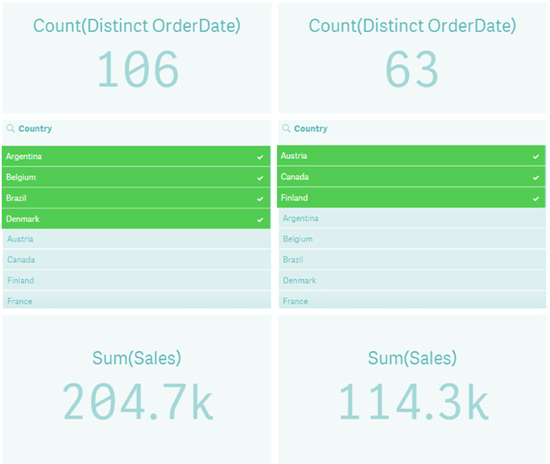
Figure 13: Alternate States use case with 2 states.
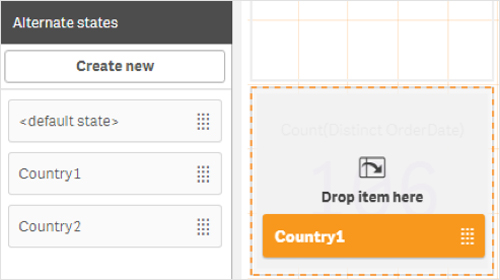
There are 3 ways to reference a visualization to a specific state once they created:
- Drag and drop the state from the Alternate States panel to the visualization:

Figure 14: Dragging and dropping a state onto a visualization.
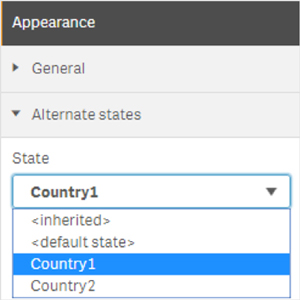
- Select a specific state in the Appearance tab of a visualization (Alternate states tab – edit mode):

Figure 15:Selecting a state in the Appearance Tab in the selected visualization.
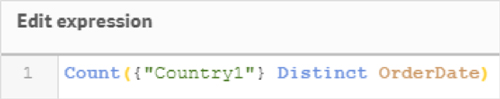
- Use Set Analysis to reference the visualization to the state:

Figure 16:Using state in Set Analysis in order to reference the visualization to the state.
- Drag and drop the state from the Alternate States panel to the visualization:
4. Set Analysis – Expression Editor
Qlik has at last introduced what many of us have been waiting for for a long time: the option to include Set Analysis within an expression. Given the complexity of the previous syntax, this is certainly a breakthrough, and what’s more, for added value, Qlik Sense allows users to perform filters in analysis mode, switch to edit mode, and in an expression editor, when the Set Analysis is inserted, it automatically introduces the last filters performed during the analysis mode.
In the image below, we can see how to insert Set Analysis inside an Expression Editor:
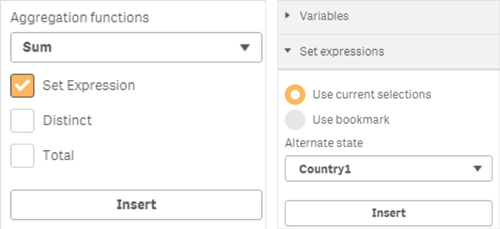
Figure 17:Two different modes to insert Set Analysis syntaxes inside Expression Editor.
In the image on the left, once we select an aggregation mode (Sum, Count…) the Set Expression option is enabled. In the image on the right, there is the option to use a bookmark inside an expression or, as we commented above, to use current selections by default. This is a definitely a big step forward in advanced calculations using Qlik Sense.
5. Single Value Selection
The new Qlik Sense Fields Settings allow users to enable the option to select only one value for a particular field. One selected value can be used in applications that require better control and that could benefit from a single value being allowed as a selection. Imagine that we have an entire dashboard that is filtered based on a filter pane that contains all categories, and as it makes no sense to analyse two categories at the same time, it will be really handy to check “Always one selected value” for the Category field; to check that option, follow the steps below:
- Drag and drop the filter page.
- In the Fields panel, right click on the field we want to filter and click on Field Settings.
- Check “Always one selected value”.
- Drag and drop the field to the filter pane.

Figure 18:Steps to create a single value selection.
As you can see in the image above on the right, there is no option to select any other category once Babywear has been selected.
6. New Map Layers
Qlik has added a new map layer to display pie or bar charts on top of geographic locations that help to illustrate the distribution of measures and dimensions; this new layer is called Chart Layer.
To perform a map with this new layer, below we can see all the sections to fill when selecting a map visualization with a Chart Layer. In our example we have selected a bar chart type:

Figure 19:Steps to define the new map layer.

Figure 20:New layer with bar charts on the map.
There is also the option to change the bar chart for a pie chart. Depending on the different values for a specific dimension, it would be better to select a pie chart (more than 5 distinct values) rather than a bar chart:

Figure 21:New layer with pie charts on the map.
There is also the option to show a table with specific values if the user points directly onto the chart as a tooltip.

Figure 22:Tooltip in a map when a bar or pie chart is displayed on top of the layer.
7. New Pie Chart Capabilities
Qlik has made some improvements in the existing pie chart to allow a second measure on the outer radius where the height of the outer side wall represents that second measure. It’s a great way to see the distribution of a whole for a given dimension. The option that must be checked if you want to introduce this second measure is shown below:

Figure 23:Option to add a second measure to the pie chart.
In our example, we have tried to represent the distribution of Gross Profit by Category, adding Sales as a second measure in order to see the relation between both measures per Category. Sales and Gross Margin are obviously linearly dependent.

Figure 24:New pie chart with Sales as a second measure.
Now let’s use the second measure to find some beneficial insights for our business. We are going to change Sales for Shipping Cost and see what happens:

Figure 25:Pie chart with Shipping Cost as a second measure.
Conclusions
The new Qlik Sense November 2018 version is without doubt the most advanced version focused on usability and machine learning. Qlik has improved the range of existing possibilities with new features in graphics and an even more powerful machine learning engine. In addition, it has broadened this range with wonderful extensions, offering the possibility to make comparative analyses on the same page and also to choose a single value for a specific field. And remember that Set Analysis has at last been introduced into Expression Editor, a great improvement for advanced calculations.
At ClearPeaks, we are Qlik Sense experts and we are always up-to-date on the tool’s latest features. If you want to learn more about Qlik Sense, don’t hesitate to contact us.