20 May 2021 Adding Auditing Capabilities to KNIME with Open Source Plugins
In this article, we are presenting a solution for adding auditing capabilities to KNIME. The solution consists of two plugins that can be added to any KNIME installation. The plugins can be found in this GitHub repository. We have already published a few articles related to KNIME, check them out if you’d like to have an introduction to KNIME and its capabilities. In these previous articles, we have discussed how to create Per-User Distributed Executors in KNIME, how to boost the performance of KNIME Spatial Processing and also how to achieve high performance data processing by combining KNIME with MongoDB.
1. A KNIME Enterprise Deployment
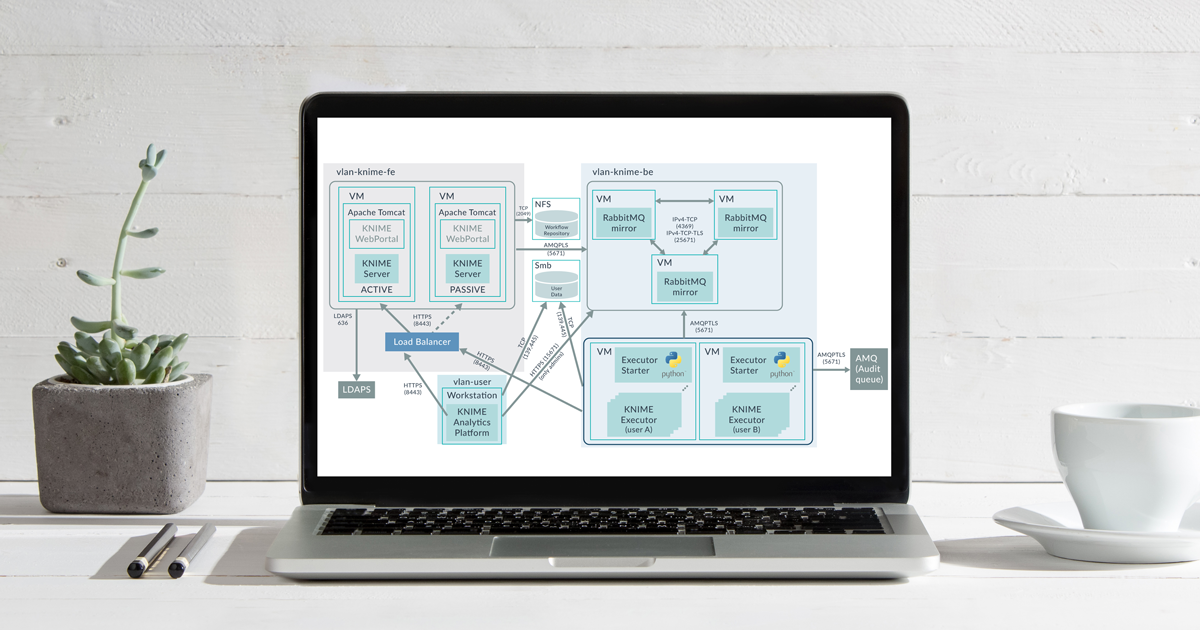
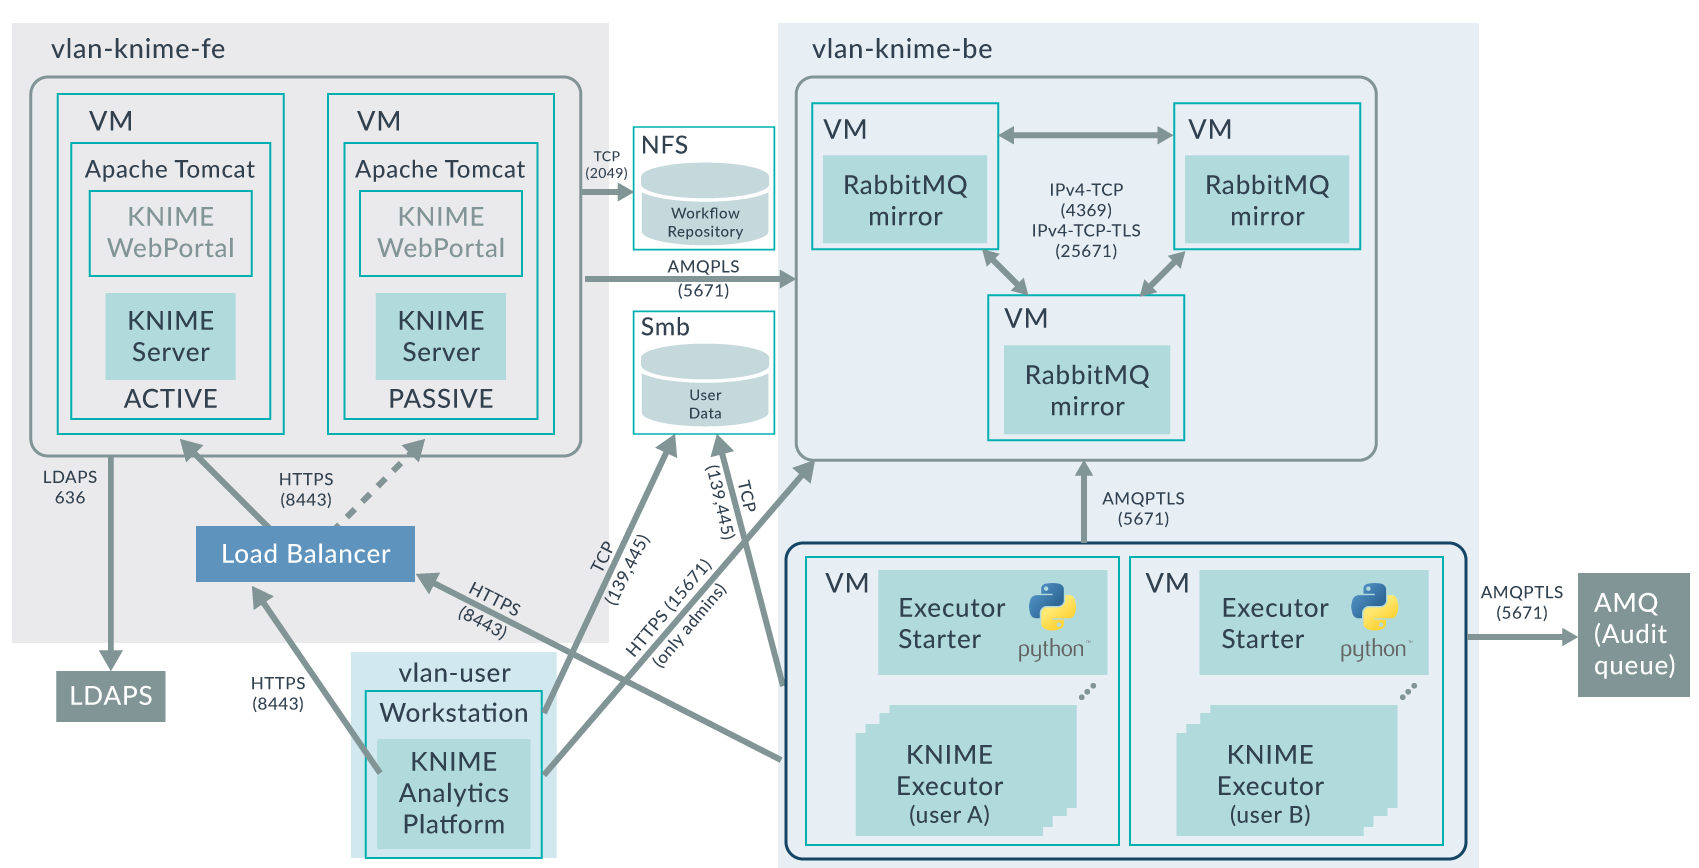
Recently, we were deploying an Advanced Analytics platform for one of our customers, based on a KNIME Server Large Active-Passive cluster using NFS for the shared repository, multiple and redundant VMs running Per-User Distributed Executors, and a RabbitMQ cluster acting as message broker between the components.
The platform not only had to be highly available, but it also had to be highly secure: communication within all components must be with SSL/TLS encryption, KNIME users must authenticate with LDAP, and when accessing data in network shares (Samba/CIFS) within their KNIME workflows, the authentication must be done with Kerberos. Further, each user must have his/her own dedicated redundant KNIME Executor processes with isolated execution environments; and accidental credentials sharing between users was prevented by enforcing password resetting when workflows are shared.
2. Auditing KNIME
Nowadays, enterprises often want their data platforms to be fully auditable, so that it is always possible to know who did what, and whether it was allowed or not. This is exactly what our customer required – more precisely, our customer wanted to know, i.e., to log and to audit when a KNIME node was being executed, whether the execution of a node succeeded or failed, which parameters were used for the execution – focusing on parameters that determine data accesses – and the execution lineage (so it would be possible to identify upstream and downstream executed nodes).
And the customer wanted this information to be sent in real-time to their centralised auditing system via an ActiveMQ queue. If you are familiar with KNIME, you may now be thinking that this is going to be challenging.
The following image depicts the architecture of the platform. It also depicts which protocols and ports are used for the communications between components, and which virtual networks are required to separate backend, frontend, and user domains.
Out-of-the-box, KNIME logs (if logging level is set to INFO; and not WARN which is the default) in a log file (stored inside the workspace directory of the KNIME Executor process) a log entry when a node is executing, is executed, or has failed. However, for an executed node, KNIME does not log anything on which parameters or flow variables were used. Neither does it log anything on which upstream nodes are related to the executed node.
The first approach we considered for auditing KNIME was to parse the information from the log file into whatever auditing system was required. However, this approach had a few problems:
- The information available on the log is limited. As mentioned above, the information on the log does not include used parameters and flow variables, nor does it include lineage information.
- It requires a “parsing” tool that runs in the background and parses the log file into audit events that are sent to the audit system.
- The log file is owned by the user or service account running KNIME. Therefore, technically, a KNIME workflow can be created that could modify or even delete the log file; and if the source for auditing can be tampered with – well, this kind of kills the purpose of auditing.
So, even though one could think (I definitively did) of creating a Python script (like we did to handle the Per-User Executors) for parsing the log file, this was not going to be enough here because of the above-mentioned reasons.
Therefore, we had to think of something else. In the end, after much deliberation with the KNIME dev team, our team of KNIME experts in ClearPeaks, and the customer, we leveraged the fact that KNIME is open source, and addressed this requirement by adding two plugins that did exactly what we needed.
3. Logging Extended Plugin
First, we added the so called “Logging Extended” plugin. This plugin allows to log (in INFO log level) for each executed node: (i) what parameters and flow variables were used for the execution, and (ii) which connections were done on the input ports of the executed node.
The JAR for this plugin can be found here (to access the source code, contact KNIME). If you want to use this plugin, just add the JAR file in the dropins folder of the KNIME AP/Executor installation and add the below line in the knime.ini configuration file.
-Dcom.knime.logging.extended.enabled=true
As an illustrative example, let us consider this simple KNIME workflow: 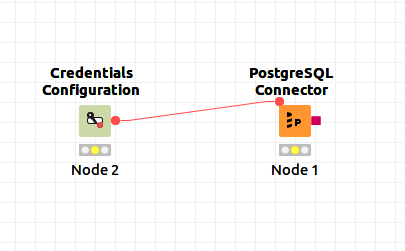
This workflow just creates a PostgreSQL connection using the PostgreSQL Connector node by feeding the credentials from the Credentials Configuration node. When the first of these nodes (the Credentials Configuration node) is executed with the Logging Extended plugin enabled, the following information is output into the KNIME log file:
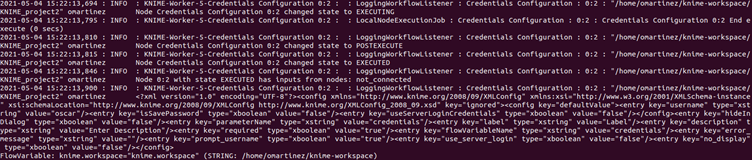
Note that the log entries “EXECUTING”, “POSTEXECUTE” and “EXECUTED” are output by out-of-the-box KNIME if the log level is set to INFO. What the “Logging Extended” plugin adds are the lines with:
- The “has inputs from nodes” which determines which connections has the current node with upstream nodes (in this case “not_connected”)
- The XML which lists all the parameters used in the execution (sensitive values such as passwords are not logged)
- The flow variables used in the execution
4. KNIME Auditing Plugin – AMQ Logger
Thanks to the “Logging Extended” plugin presented above, the KNIME log file now has all the information we require for auditing. The next step is to decide how we bring this information to the central auditing system of the organisation.
As already mentioned above, even though it is doable, directly parsing the KNIME log file with a Python script for auditing purposes would not be an ideal solution; since technically the user running the workflows could tamper with the log file (since the log file is owned by such user), thus killing the purpose of auditing.
Instead, our solution is to develop another KNIME plugin that directly sends the audit messages to the central auditing system at runtime. Note that this is in addition to the log entries in the log file, i.e., when a node is executed, the log entries are output in the log file, and at the same time, the relevant audit events are sent to the central audit system.
Because our client organisation uses ActiveMQ as the message broker to send the audit messages in XML to the central auditing system, the plugin we developed sends XML audit messages to an AMQ queue.
If you would also like to add auditing capabilities into your KNIME deployment, but in your case the auditing system uses another technology to receive the audit events or a format other than XML, you may still use our plugin, but you will need to adapt the source code to your case, for example, you might want to send JSONs to Kafka instead of XMLs to AMQ.
KNIME uses Log4j as its logging framework. The plugin we developed is called AMQ Logger and adds a custom Log4j appender into the KNIME runtime. For certain KNIME log messages, the plugin sends an audit event (a XML message) into an AMQ queue (using Apache Qpid JMS libraries and AMQP 1.0 protocol).
Five types of audit events are sent: EXECUTING, EXECUTED, ERROR, INPUTPORTS, and PARAMETERS.
More specifically, audit events are sent:
- When a KNIME node is starting its execution (“EXECUTING” event).
- When a KNIME node has finished execution – three events are sent:
- The first event is related to whether the node executed successfully or not. Therefore, there are 2 options:
- “EXECUTED” event – indicates that the node executed successfully.
- ”ERROR” event – indicates that the node execution had an error (the error message is also included in the event).
- The second event is related to the lineage of the executed node. This is called an “INPUTPORTS” event, and it indicates the IDs of the nodes that the current node had dependencies on.
- The last event is related to the relevant parameters used to execute the node. This is called a “PARAMETERS” event; parameters which are considered relevant can be controlled by a configuration file. This event also contains flow variables.
- The first event is related to whether the node executed successfully or not. Therefore, there are 2 options:
Therefore, one executed node will cause four audit events: one EXECUTING, one EXECUTED or ERROR, one INPUTPORTS and one PARAMETERS. These four events can be linked together since they share the same job ID and node ID.
All the details on how to configure and use the plugin can be found in the GitHub repository of the plugin. In short, to use the plugin, you must add the JAR file (which you can find here) to the dropins folder of the KNIME AP/Executor installation, and add the following line to the knime.ini.
-Dlog4j.configuration=/path/to/log4j3.xml
Then, you need to create the log4j.xml file and, as explained here, add the definition of the AMQ appender to it. You should also create the jndi.properties file to specify the connection details of AMQ. Note that for AMQ Logger plugin to work as expected, the “Logging Extended” plugin must also be enabled (otherwise the “INPUTPORTS” and “PARAMETERS” events will not be sent).
Following our illustrative example above, the execution of the two nodes (Credentials Configuration node and PostgreSQL Connector node) generates eight audit events, four for each executed node. To catch these events, we have used NiFi (it is also possible to use KNIME to read the messages but we wanted an “independent” tool to be the one reading them – we also just love NiFi). The simple NiFi flow below achieves this (actually NiFi does not support AMQP protocol 1.0 which is the protocol our client required; so we also had to do some “magic” in NiFi to make that possible – we may write a blog article about this, stay tuned!):
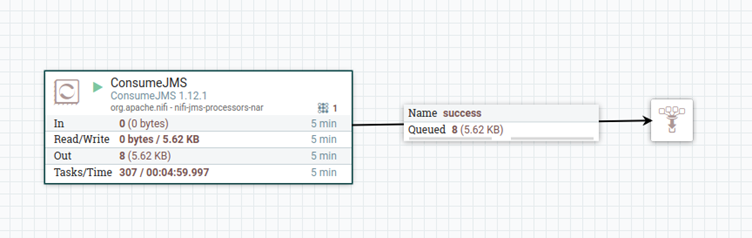
As you can see in the above image, eight messages are read from the AMQ queue. Below, we show the XML snippets of the four audit messages related to the Credentials Configuration node and the other four related to the PostgreSQL Connector node.
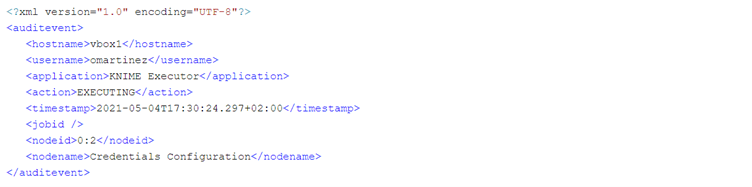
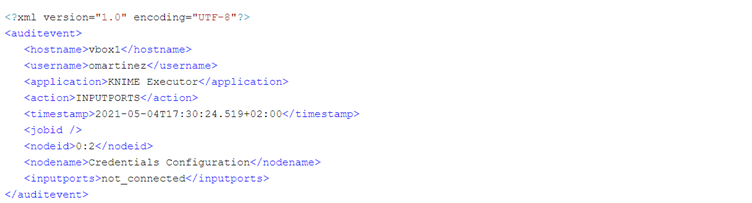
4.1. Example of the four audit messages of the Credentials Configuration node
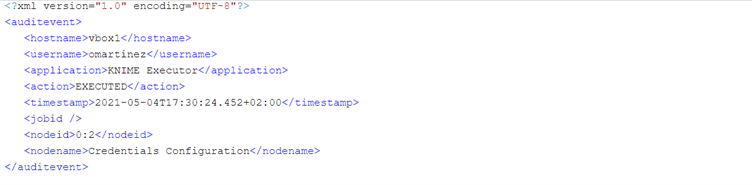
This is an example of a successful node execution. First, we receive an EXECUTING event when the node starts the execution. Second, we receive an EXECUTED event when the node has successfully completed execution. Third, after node has finished execution (successfully in this case) we receive an INPUTPORTS event, in this case the node is not connected to any other upstream node.
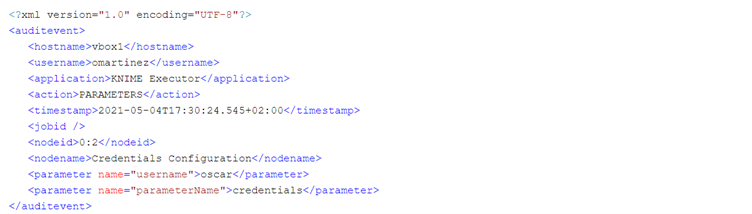
Finally, we also receive a PARAMETERS event which essentially contains node parameters that we deemed interesting (controlled in the AMQ Logger plugin configuration file). Note that the job ID is empty because this example ran on KNIME AP (if this workflow runs on a KNIME Executor, the job ID would not be empty).
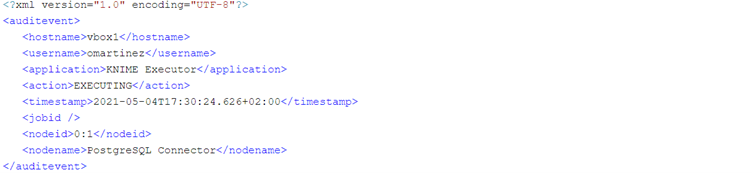
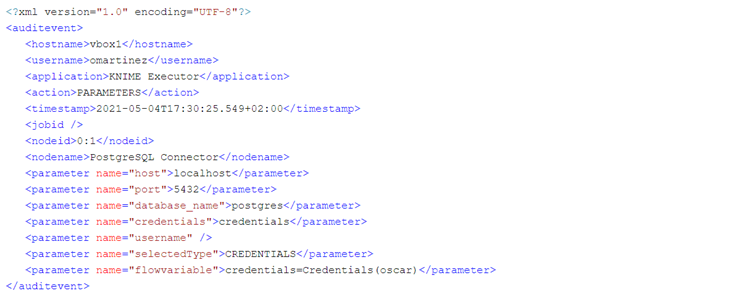
4.2. Example of the four audit messages of the PostgreSQL Connector node
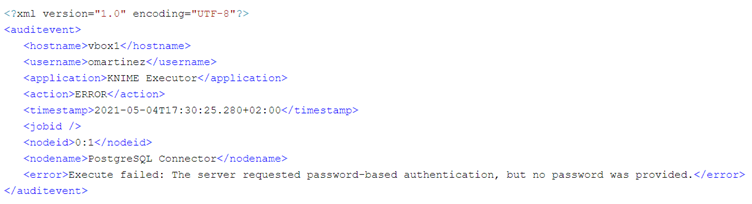
This is an example of an erroneous node execution (in this case due to a wrongly provided password). As in the case above, first we get the EXECUTING event when the node starts execution. However, the second event we receive here is an ERROR event. We can see the error message that was generated in the event, in this case an empty password.
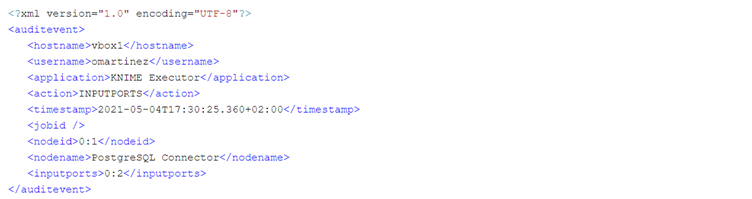
Like in a successful execution, in an erroneous execution we also get the INPUTPORTS and the PARAMETERS audit events. The INPUTPORTS event in this case states that the current node has an input port connected to “0:2” which is the ID of the Credentials Configuration node. The PARAMETERS event states database connection details except the password (which in this case was empty anyway).
5. When does auditing make sense?
An important consideration to make is that auditing really only makes sense when the KNIME application is NOT started by the users, which is usually the case in KNIME Executors; or if it is started by the user, there is some mechanism that prevents the user from starting the application to change its configuration.
If the users are the ones starting the KNIME application and they can change its configuration, they may opt for not specifying the required parameters on the knime.ini to activate the plugins, which then kills the purpose of auditing.
Therefore, the scope of this auditing solution is restricted to KNIME Executors, unless some mechanism is used that would ensure that KNIME AP is started for sure with fixed configuration. This is what we did for our customer, we added auditing only to the KNIME Executors.
Conclusion
In this blog post we have presented an elegant solution for adding auditing capabilities to KNIME, and in the process, also extend the level of logging done by out-of-the-box KNIME. The solution is open-source and can be adapted for other auditing requirements and auditing platforms. Thanks to this solution, it is now possible to know how KNIME users are using the platform.
At ClearPeaks we are Big Data and Advanced Analytics experts, and we often need to create innovative solutions for our customers to meet their challenging requirements. On this occasion, thanks to our customer, we can share one of these developments which we hope can help others in similar situations. If you require assistance with the solution described in this blog, with KNIME, or with other Big Data and Advanced Analytics technologies, simply drop us a line. We’re always happy to help!
