12 May 2022 Automating Google Cloud Platform Cost Monitoring
This blog is the continuation of our previous blog about cost monitoring and management in Google Cloud Platform, where we saw how Google Cloud Platform (GCP), and in general all cloud providers, provide a billing section with a UI containing a set of predefined visualisations and filtering options; where you can analyse your platform costs and manage your invoices. Moreover, in BigQuery you have the information schema table that contains metadata about the jobs executed (who ran it, bytes billed, cost, etc.) to monitor BigQuery costs.
In this blog post we are going to show you how to automate and centralise the billing and BigQuery cost data in one single place: BigQuery.
Exporting Billing Data to BigQuery
The first step consists of extracting the information in the billing page. In GCP, there is no API available to extract detailed information (or any information at all containing costs), so the only choice available is to enable the option export Cloud Billing to BigQuery in the Billing portal, in the Export Billing section. Remember that you will need the roles of Billing Account Administrator and BigQuery User to perform this action.
Considering that we want to centralise all the information in BigQuery, this option is ideal. It actually divides the exports into three, and each will create a BigQuery table, bulk your billing account data there, and update automatically. The exports available are:
- Standard usage cost: Contains standard cloud billing account cost usage information, such as account ID, invoice date, services, SKUs, projects, labels, locations, cost, usage, credits, adjustments, and currency. The table created is called gcp_billing_export_v1_{billing_account_id} and is updated every day.
- Detailed usage cost: Contains the same information as the Standard usage cost table, plus additional fields that provide resource-level cost data. The table created is called gcp_billing_export_resource_v1_{billing_account_id} and is updated every day.
- Pricing: Contains your SKU prices. The table created is called cloud_pricing_export and is updated whenever your pricing changes.
In general, enabling these exports from your Cloud Billing account to BigQuery is always recommendable once you have created the billing account, even if you don’t use BigQuery, as it is the only way to manipulate and extract your cost information from your billing account. Moreover, if you enable it later, you won’t be able to retrieve all the historical billing data, only the data close to the date when you enabled it. You can find more information regarding these three tables in the official documentation.
However, before doing this, besides creating a billing account, we also must create a project (or use an existing one – but we suggest creating a new one), enable BigQuery API, and create a BigQuery dataset. The dataset will be required while enabling each option, as it is where the tables are going to be placed. Once enabled, it can take about a day to see the tables in the dataset.
Automate BigQuery Cost Monitoring
In our previous blog post, we also looked at some queries that can be run on the information schema table providing detailed information about the BigQuery jobs run by users.
As we mentioned in that blog post, one possible option to look at this data is to create views with the queries and then connect to them with a reporting tool like Data Studio. Note that the information schema data is only retained for six months, so historical data older than that can’t be retrieved.
In order to avoid this happening, we have developed a script that executes these queries every month with all the data from the previous month, and stores the output in BigQuery tables. Effectively, we are creating a single dataset with all the billing and BigQuery job cost information. You can have a look at our script in our GitHub!
This script runs serverlessly as a Function as a Service (FaaS) in Cloud Function, and is scheduled to run every first of the month with Cloud Scheduler. As Cloud Scheduler can’t directly call a Cloud Function, we have created a Pub/Sub topic where the Cloud Function is subscribed. This approach is quite similar to the one explained in our blog post Serverless Near Real-time Data Ingestion in BigQuery with the checking functions.
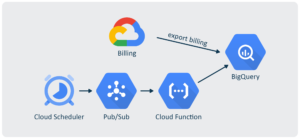
The Pub/Sub is the first thing to create, as it must be referenced in the creation of the Cloud Function. Creating the Pub/Sub is easy, as it can be done through the UI with minimum configuration, only providing the topic name.
Before creating the Cloud Function there are a few additional steps to be taken. The first thing is to create a bucket to store the Cloud Function data, if you don’t have one already available. You must also set a service account: create a new one or use an existing one. This service account must have a BigQuery Resources Admin role in the project where the tables we want to monitor are, to look at their information schema and, in the billing project, this service account must have the role of BigQuery User, to create and update the tables.
Once these steps have been carried out, you can create the Cloud Function. It is possible to do so through the UI, but we advise you to use the Cloud Shell with a command like the following:
gcloud functions deploy {your-cloud-function} --entry-point main --region=us-east1
--source=. --runtime=python39 --set-env-vars {your_env_vars} --stage-bucket={your-billing-
bucket} --trigger-resource {your-billing-topic} --trigger-event google.pubsub.topic.publish
--service-account={your-sa@yourproject}.iam.gserviceaccount.com --max-instances=1 --memory=
1024MB --timeout=540
As you can see, there are many things to consider in the function:
- The first thing to provide is the name of the Cloud Function.
- In our case we selected the region us-east1 but you can select whichever region you prefer, preferably the one where your data is.
- In the set-env-vars parameter you should provide the environmental variables that the script will use. Check them at the top of the script in GitHub.
- The stage-bucket is the one created before to store the Cloud Function data.
- The trigger-resource is the name of the Pub/Sub topic created before.
- The service-account is the service account configured to run the script.
- Memory is set to 1024MB in order to generate the reports. You can change this option to increase or decrease the allocated resources.
Once the Cloud Function has been deployed, you can configure the Cloud Scheduler. We set it at 0 13 1 * *, as we configured it in UTC and wanted to make sure the day has ended in every time zone of the world.
Once we have configured the Cloud Scheduler, we can manually execute the script with the Run now button, which is great to test the execution whenever we want with a single click. Moreover, the script is idempotent to avoid possible duplicates in the case of multiple executions. This is done by checking whether the data from last month has already been ingested.
To monitor the script execution, we can check the logs easily in the Logging service by applying a query containing the name of the function we provided while creating the Cloud Function: resource.labels.function_name=”your-cloud-function”.
The table schemas generated with the script are shown below:
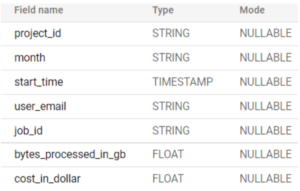
Figure 1: BigQuery job costs detail
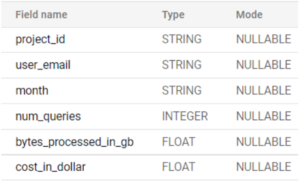
Figure 2: BigQuery job costs per project
Automate Cloud Storage and BigQuery Storage Usage
In addition to these queries, our script can also check the evolution of the data stored in Cloud Storage and BigQuery, key factors in the monthly invoice.
It simply consists of getting the number of bytes of the desired tables from last month in the BigQuery Python SDK, thus obtaining the historical values of the monthly evolution.
Cloud Storage is different; the best way to manage blobs is using the command line tool gsutil. To obtain the size of a bucket or a folder or a blob in bytes we could use the following command:
gsutil du -s {path}
However, gsutil is not available in the Cloud Function environment, so there is no option other than listing all the blobs from a bucket with the prefix being the folder name and adding all the blob sizes with the Python SDK.
The table schemas stored in BigQuery look like this:
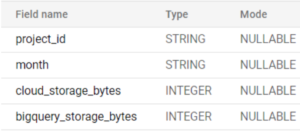
Figure 3: Storage usage schema
Visualising Billing Data in BigQuery
Once all the data has been stored in BigQuery, we can analyse it with the visualisation tool we want – most include a BigQuery connector. The easiest one is Data Studio, as GCP not only provides this synchronisation feature between billing data and BigQuery, but also provides a dashboard template in Data Studio to connect to these managed tables to start visualising your billing data almost effortlessly.
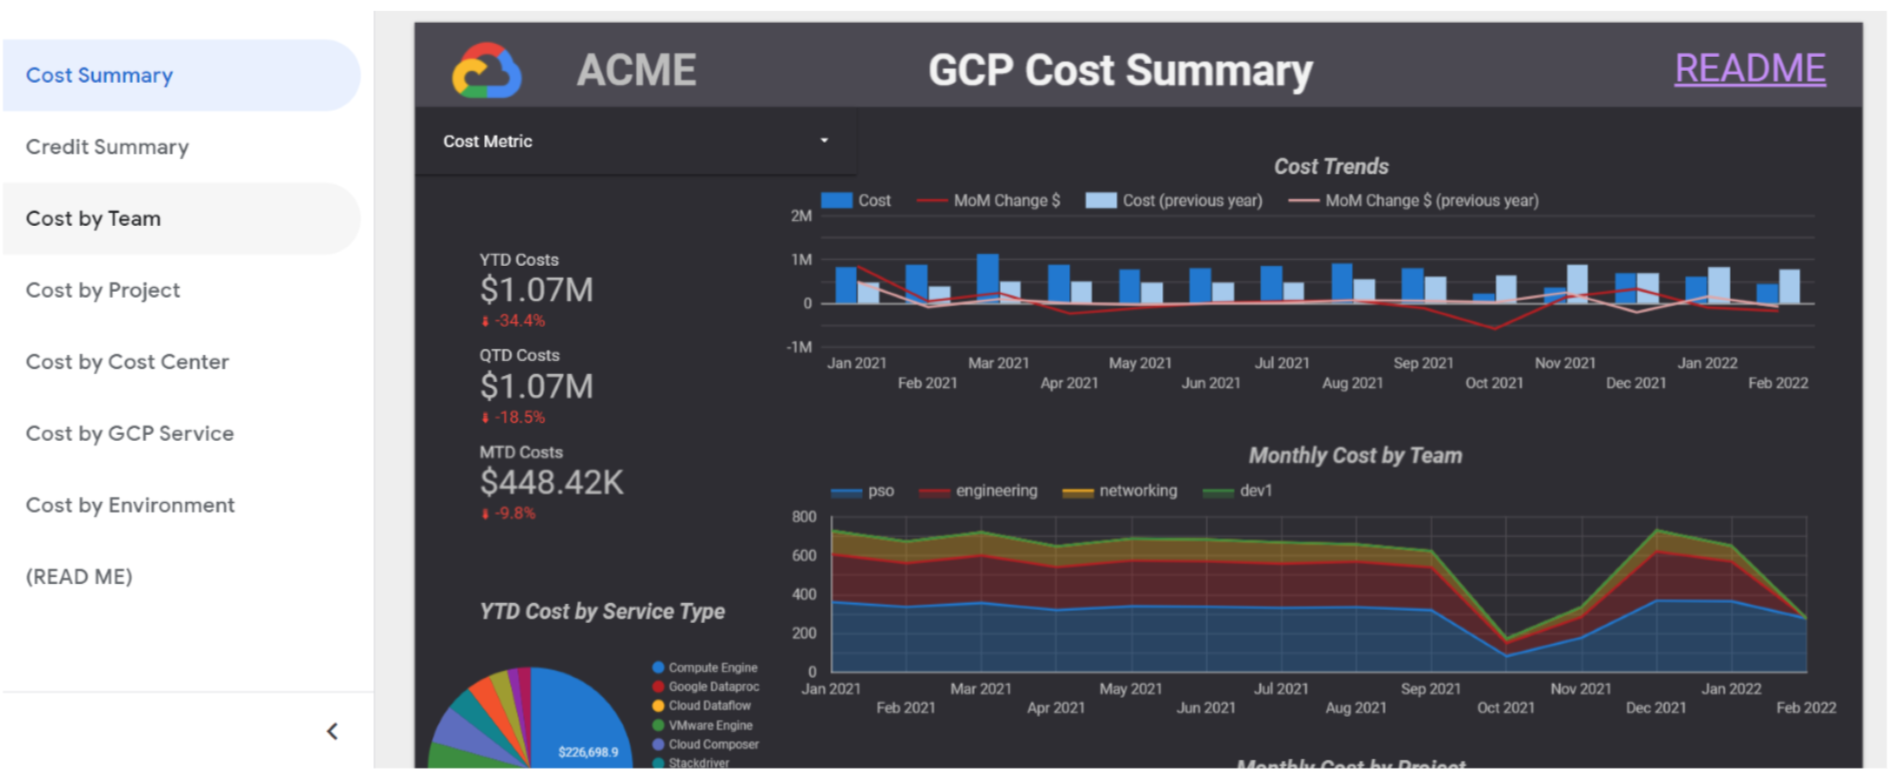
Figure 4: Data Studio billing export template
Additionally, we could personalise this template to include visualisations about the additional tables we create with the script. In the following image, for instance, we are plotting the storage usage in Cloud Storage and in BigQuery:
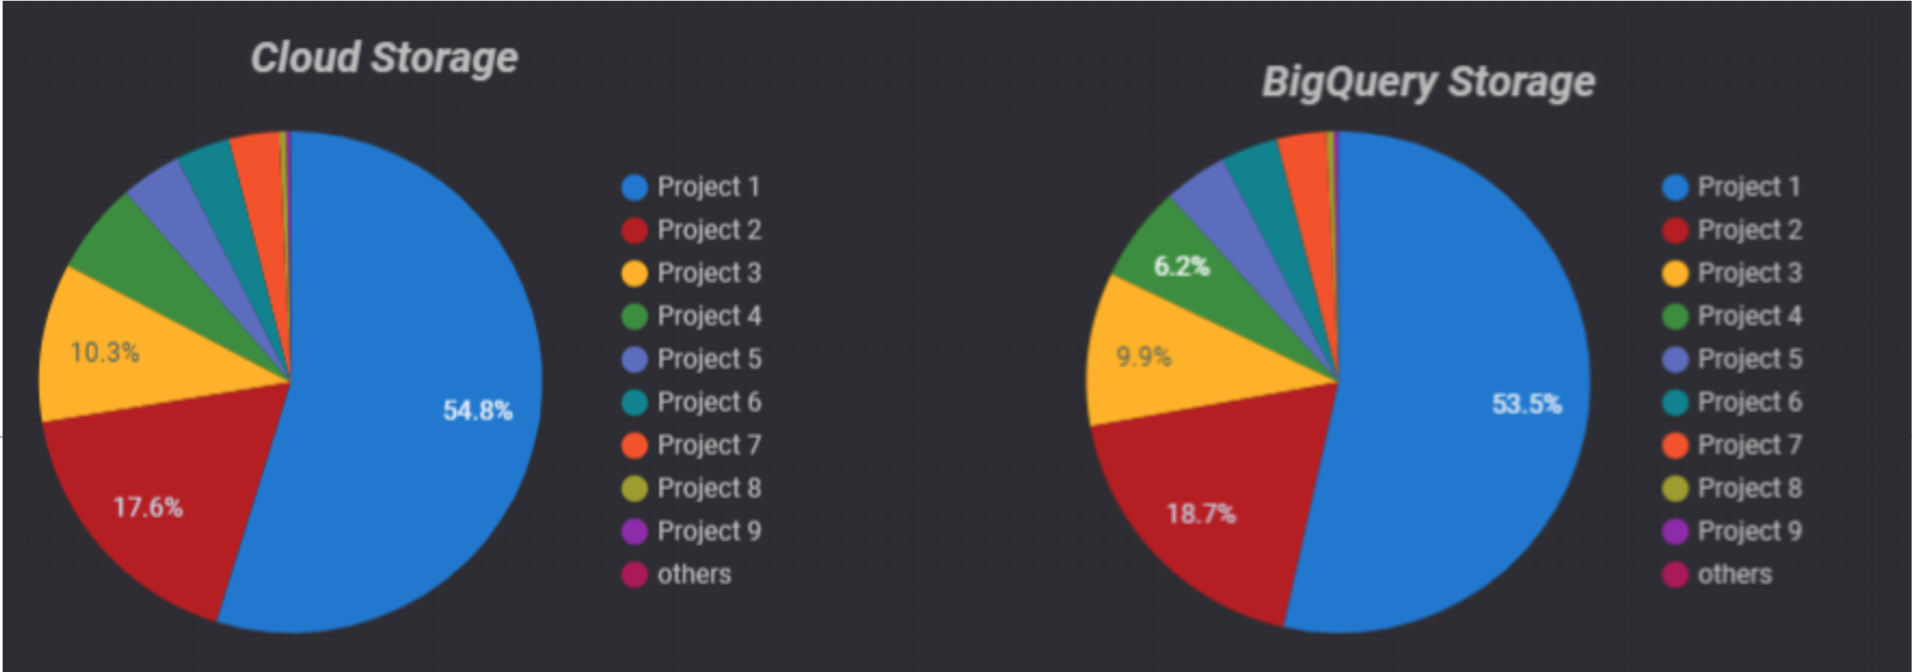
Figure 5: Data Studio storage usage visualisation
Note that the template provided uses some specific labels, so if you don’t have them, some visualisations won’t work.
Now that you have all the historical data available, not only can you visualise your past invoices, but you can also predict future ones!
Conclusion
Monitoring your billing invoices and the jobs running on your data platform is a must to track the evolution of costs and to avoid surprise expenses. Export billing data to BigQuery is a powerful tool that, combined with our script, can offer a complete overview of your organisation costs, track their evolution, and even predict future ones.
Automating this process is not an easy task, and a lack of cost monitoring can lead to unexpected bills. If you find yourself in this position or need assistance in monitoring your platform costs, simply contact us and benefit from our extensive experience building and monitoring data platforms.