
07 Oct 2018 Big Data made easy
Article 1: working with Talend Open Studio for Big Data and Zoomdata to create interactive dashboards with a Cloudera cluster
Most of you will have heard about the most dominant Big Data technology, Hadoop, which, with its ecosystem tools, has brought Big Data technologies closer to non-specialist users. However, using Hadoop and its tools often proves to be more challenging than we had imagined! With this in mind, many tools have emerged or evolved that aim to facilitate Big Data operations. Check here to have a look at the June 2018 Big Data Landscape image maintained by Matt Turck.
Here at ClearPeaks, as experts in Business Intelligence, Big Data and Advanced Analytics, we have used many tools designed to make Big Data easier. In order to bring these tools closer to our readers, in the coming weeks we will be publishing a series of blog articles called Big Data made easy in which we will demonstrate some of these tools. We will be using data from Citi Bike NYC, a bike-sharing service operating in New York. Our demonstrations will begin with extracting the data and go as far as the visualizations and transformations too. We will work with both data at rest and data in motion (a big historical dataset and streaming data respectively). This blog post explains how we used Talend Open Studio for Big Data to develop an ETL to centralize our data in a Hadoop cluster, and how Zoomdata is the perfect tool to visualize the data and to produce live and interactive dashboards.
Please note that the solutions presented in this article and in the rest of the series are not intended to be complex, ultra-efficient solutions, but simple ones that give our readers an idea of the tools’ possibilities.
1. Test case overview
Citi Bike NYC provides open data on all bike trips made. In this example we will integrate all their data together with weather data and we will create some dashboards in order to make Citi Bike NYC a more data-driven company with improved services. We will show the significant influence that weather data has over their business; we have trip data from 2013 to 2017, plus the hourly weather data in NYC.
So that we can explore Talend’s ability to deal with different source systems, we have placed the data in different data sources:
- 2013-2014 trips: Excel files
- 2015-2016 trips and weather data: MySQL server
- 2017 trips: HDFS
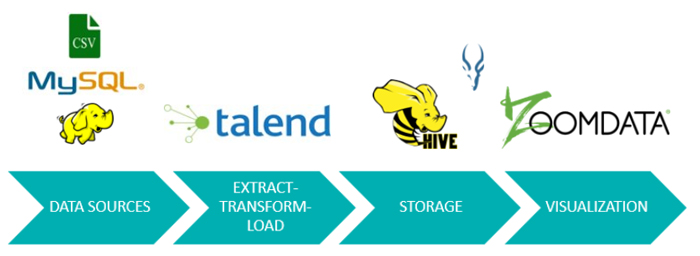
Talend Open Studio for Big Data excels at dealing with ETL processes in Big Data environments. Thanks to this powerful tool, we are able to extract the data from different data sources, merge it into the data lake in HDFS, transform it, and load it into Hive tables. The data processed and prepared by Talend is visualized by Zoomdata via Impala.
2. ETL process with Talend Open Studio for Big Data
Talend Open Studio for Big Data (TOS) allows the user to simplify the ETL process for Big Data. With its pre-built components and generative native code, TOS makes the ETL process easier and clearer. It’s also Hadoop-friendly, and can connect to several types of data sources, such as HDFS, Hive, Impala, cloud services, NoSQL, RDBMS or some SaaS services.
The ETL process we developed for the test case first extracts the data from the three data sources (Excel files, MySQL and HDFS), then transforms it and finally creates the fact and dimension tables in Hive. In the subsections below we will explore the different components of this solution.
2.1. Extraction
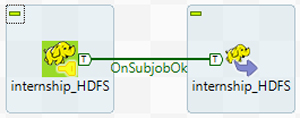
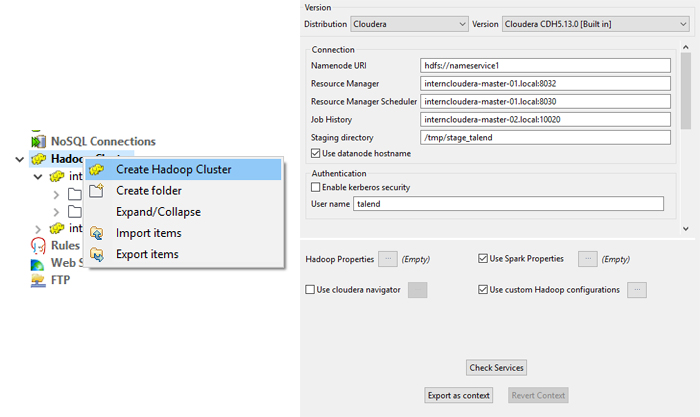
The first component extracts the data from the data sources and loads it into HDFS. In this example, we want to extract the content of flat files: the first thing to do in Talend is to configure the connection to HDFS, and once this has been done we can proceed to extract the data. The component we are going to use is called tHDFSPut.
2.2. Transformation
When the data is in HDFS we can perform the transformation required to change the date attribute format. The component to perform this task is called tMap, and you can use Java to specify the transformations you need.
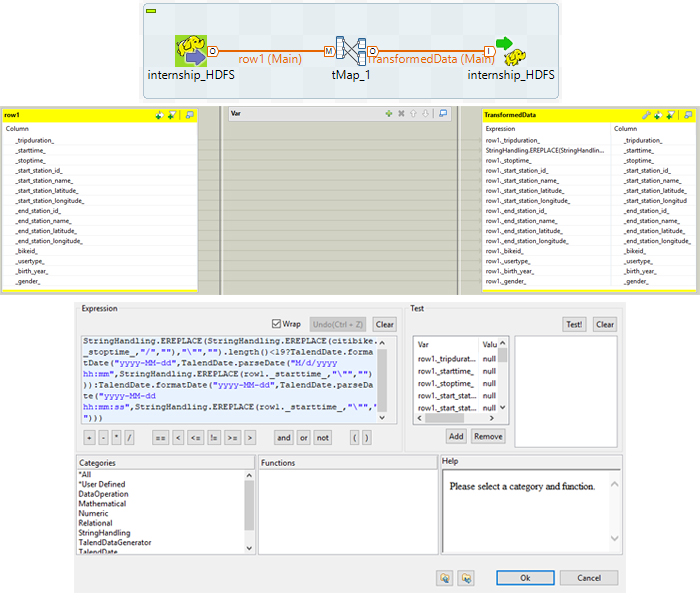
2.3. Load
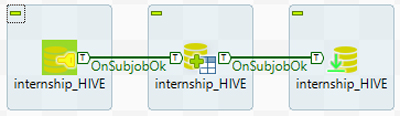
Now that the proper transformations have been carried out, we load the data into Hive tables. To create the Hive tables, configure the connection to Hive – the connection is related to the Hadoop cluster connection we configured before.
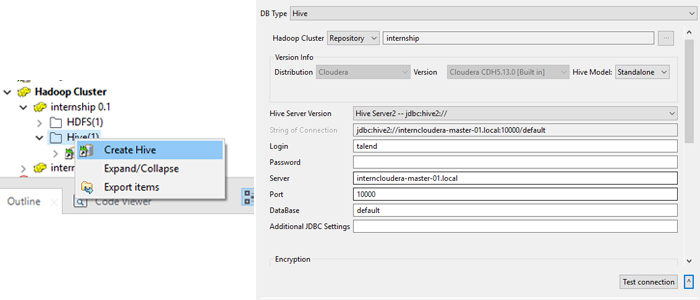
Once we have created the connection, we can work on the process to create the tables in Hive, and then load the data.
3. Visualization with Zoomdata
Now that the Hive tables are ready, we can start to visualize the data. For the purposes of this article, we will be using Zoomdata, a data visualization and analytics tool that allows users to explore and analyze data in their data stores. Zoomdata works in the Hadoop ecosystem and is focused on Big Data analytics.
Zoomdata requests data from the Hadoop cluster (Cloudera) then processes it with a native spark engine (which can be externalized if necessary) and renders the visualizations. Zoomdata was created to work as a Big Data visualization tool, so it is able to work with huge amounts of data. In order to make the user experience as smooth as possible, it offers a sharpening feature: Zoomdata splits the queries into micro-queries, and when the results from the first micro-query return from the source, Zoomdata renders the visualization so the user can see preliminary results while the whole query is being completed.
3.1. Connections
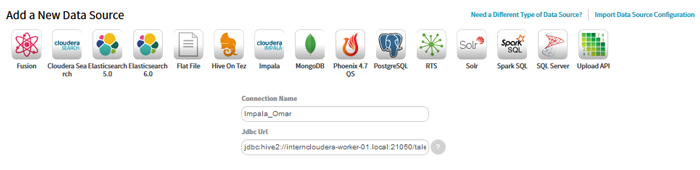
First we connect to the data source, in our case the Hive tables. While it is possible to connect to Hive, the Impala engine is better for analytical queries; this is what we do with Zoomdata.
Once the connection has been configured, we choose the table to create the visualizations; we can also perform some simple transformations on the fields before creating the dashboards.
3.2. Table settings
Once we have selected the table to work with, we have the option to format our fields. It is very important to have the time reference properly configured in a format valid for Zoomdata; we can also add some derived fields. After dealing with the fields, we can schedule when we want to refresh the data on our dashboard.
3.3. Dashboard
Now we are ready to create our first dashboard and apply some filters: the main filter is the time bar at the bottom, allowing us to choose the time period we want to display; we can apply comparison metrics to the KPIs at the top of the dashboard; we can filter by any of the available fields to any charts we want. This is what a dashboard looks like in Zoomdata:
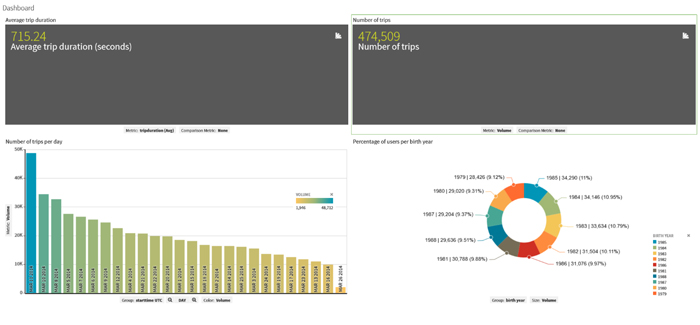
We can see “Average trip duration” and “Number of trips” at the top. The bar chart shows us the number of daily trips in March 2014, the selected period. On the right, we can see the percentage of trips per user birth year.
Conclusions
While working with Talend we experienced its great system integration capabilities, being able to extract data from different sources including most of the Big Data connections one may require; it also has pre-coded components that you can drag and drop to make your data transformations. Moreover, it’s very flexible, and you can add Java code for more customized data transformations. When running your jobs, you can see real-time statistics on the job status. Finally, let’s not forget that it is an open-source tool!
Zoomdata is very user-friendly, offering built-in integrations with Cloudera, Impala, Amazon RDS, Mongo DB, Spark, RDBMS, etc. As you would expect from a self-service Big Data and BI tool, you can create reports and dashboards without specialist technical knowledge. We were impressed by its data-sharpening feature, eliminating the need to wait for hours to see results on large analytics jobs. We also loved its real-time features (not explored in this article): Zoomdata has unified different techniques for real-time data visualizations and historical data analysis into one feature, called Data DVR. This tool works like a video, in that you can pause, rewind and replay real-time data streams instead of just monitoring them. Moreover, the Zoomdata Fusion capability allows you to combine and blend disparate data sources to appear as one, without having to move data to a common data store before “fusing,” and what’s more, it automatically determines when and how to access data sources to produce the best visualization possible.
In the next blog article we will be looking at some other Big Data made easy tools.
If you need help deciding which Big Data technology stack is the best for you, do not hesitate to consult us. Our Big Data experts will be happy to help you!