16 Jan 2019 Big Data made easy
Article 2: Working with Streamsets to ingest and transform real-time data with a Cloudera cluster
This is the second post in our series of blog articles Big Data made easy, in which we are exploring a set of tools that help with Big Data operations. In our first blog article we saw how Talend Open Studio for Big Data simplifies the implementation of ETL processes to ingest and transform data into a Hadoop (Cloudera) cluster; we also showed how to create interactive dashboards with Zoomdata, a Big Data visualization tool with unique features such as data-sharpening, real-time DVR and Zoomdata Fusion. For both the Talend and Zoomdata demonstrations we used the anonymized historical datasets from Citi Bike NYC, a bike-sharing service operating in New York.
In this article, we will again be using data from Citi Bike NYC, but on this occasion we will use data coming from a HTTP REST API that delivers a JSON file with the current status of the stations. We will be working with StreamSets, a platform (set of tools) that simplifies building, executing, operating and protecting enterprise data-streaming architectures, to load the data in real time into Kafka, and from there into Kudu tables in a Cloudera cluster.

As mentioned in our first blog article, please note that the solutions presented here are not intended to be complex, ultra-efficient solutions, but simple ones that give our readers an idea of the tools’ possibilities.
1. Real-time ingestion with StreamSets into Kudu
StreamSets is a DataOps platform that contains a set of tools to ease the implementation and execution of real-time pipelines. One of its components, the one we’re going to focus on in this blog article, is the StreamSets Data Collector – an open-source software made to build, test, run and maintain dataflow pipelines specialized in streaming data.
StreamSets Data Collector ships with around 100 connectors to the most common data sources, as well as dozens of pre-built real-time processors to transform data in motion. These components can be easily dragged and dropped to create real-time ETL processes without the need for coding. Although this might seem like a limitation, lacking the flexibility to apply custom transformations, we can still create our own code with Java or Python and make as complex a transformation as we want.
This open-source software offers deep integration with the Hadoop ecosystem, including connectors for HDFS, Kafka and Solr. One of the connectors to ingest data is an “HTTP Client”, which is the one we’re going to explore in this article. We are going to demonstrate how to get data from an HTTP REST API which is refreshed every 10 seconds, and we are going to go through all the ETL processes designed with StreamSets Data Collector.
1.1. Connection to the HTTP feed
As mentioned above, StreamSets Data Collector has the capability to ingest data coming from an HTTP feed. In our example we are going to work with data coming from the Citi Bike NYC HTTP feed in JSON format; in the JSON file there is information about the status of each station (bikes available, docks available, bikes disabled, etc.). Figure 1 illustrates the information contained in a JSON file:
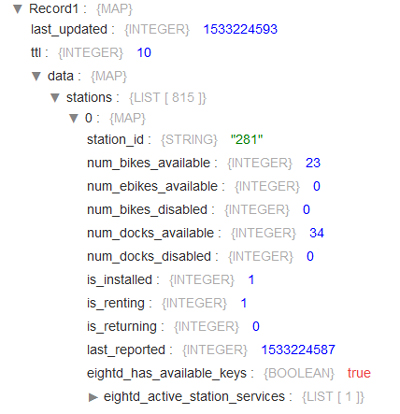
Figure 1: Content of a JSON file from the Citi Bike NYC HTTP feed.
We have used the pre-built components of StreamSets Data Collector to create a pipeline that reads, processes and publishes data from the HTTP feed to Kafka every 5 seconds. Generating the pipeline, in Figure 2, was easy – you only need to drag, drop and link the components together:
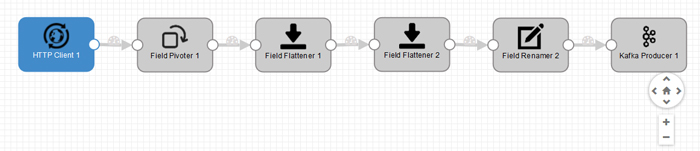
Figure 2: Screenshot showing the pre-built components that extract data from the HTTP feed and publish it to Kafka.
The first component of the pipeline is the “HTTP Client”; once we have dragged and dropped this component we must configure the connection. (The configuration panel of the “HTTP Client” is depicted in Figure 3). We must define the HTTP URL from where we want to get the data (the JSON file), as well as the mode that we want to use to extract the data – we chose polling mode with an interval of 5 seconds (bearing in mind that the data in source is refreshed every 10 seconds).
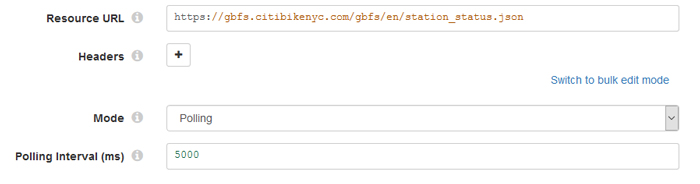
Figure 3: Screenshot showing the connection configuration of the “HTTP Client” component.
1.2. Transformation process
After we have set the connection, the following group of components transform the data coming from the JSONs into flat and structured data. Why do we need to transform the data? It’s because our final storage platform is going to be Apache Kudu, a platform that stores all the data in structured tables, and our main problem is that all the data coming from the Citi Bike NYC web page is in JSON format, which is semi-structured and contains hierarchies within the fields; moreover, some fields contain more than one value per row.
The actual transformation is done through a set of components – a “Field Pivoter”, two “Field Flatteners” and a “Field Renamer”. Before transforming, we only get one record with all the information about 817 stations. The “Field Pivoter” creates one record for each item in the field (one record for each station), and then the two “Field Flatteners” produce a record with no nested fields (fields with no hierarchy). The last step, the “Field Renamer”, renames the fields from the records, as the column names of the final table in Kudu must be the same as the ones in the fields of each record in the pipeline.
1.3. Kafka technology
The last step in Figure 2 publishes the transformed data to Kafka. Kafka is a streaming platform (messaging system) that is designed to be fast, scalable and durable. It provides high performance and low latency when working with streaming data. After dragging and dropping the “Kafka Producer” we need to configure it as shown in Figure 4. First, we must fill the broker URL information with its <host>:<port>. Second, we need to define a topic, with the same name in Kafka. If this topic name already exists in Kafka, StreamSets will add the messages to the topic; if it does not exist it will create a new topic and will add the messages there. The last step defines the partition strategy: in this example we used the default.
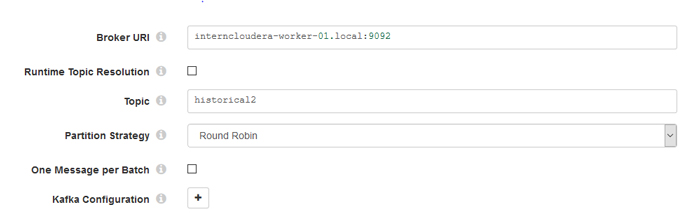
Figure 4: Screenshot showing the connection configuration to Kafka.
But why have we used Kafka instead of inserting all the data directly into the final Kudu table? Sending the streaming data to Kafka before inserting it into Kudu was the best way to create a low-latency data pipeline; Kakfa is acting as a buffer, managing all the messages coming from the JSON files, so Kudu can ingest data in a more efficient way.
1.4. Kudu technology
As already mentioned, our storage platform is Apache Kudu. Kudu combines the best of HDFS (fast writes and fast scans) and HBase (fast updates and inserts and fast small transactions). It is compatible with most of the processing platforms from the Hadoop ecosystem.
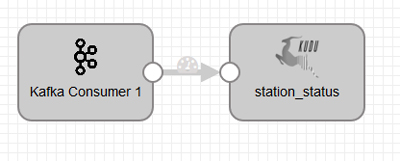
Figure 5: Pipeline from Kafka to Kudu.
We have created another pipeline, shown in Figure 5, to load the data from Kafka into our Kudu table. Before creating this pipeline, we must create the table in Kudu using Impala; Impala is an SQL query engine optimized for analytics, and we used Hue as the Impala query editor.
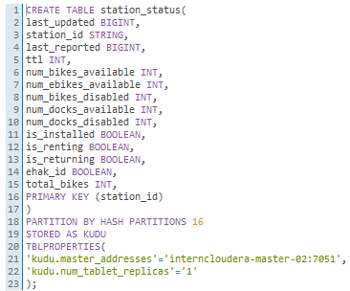
Figure 6: SQL code needed to create tables in Kudu via Impala.
Figure 6 shows the syntax to create the Kudu table “station_status”, the columns specifying the type of data that will be filled in and the primary key of the table, station_id. Once we have created the table, we go back to our StreamSets pipeline and configure the connection to the Kudu component. This is depicted in Figure 7. First we must specify the Kudu masters (<host>:<port>), then define the table that we want to fill (impala::database_name.table_name); the last configuration to define is the default operation. We defined the upsert operation because we want a table to be updated by a primary key (station_id). This operation would add new station_ids if data on new stations arrived from the HTTP feed.
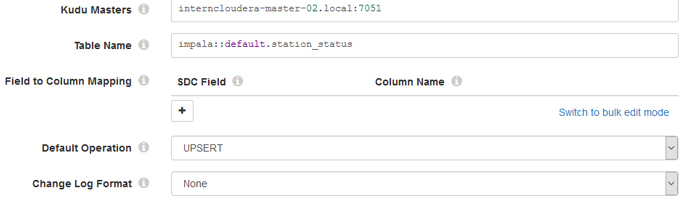
Figure 7: Kudu connection configuration in StreamSets.
2. Conclusions
In the above sections we have presented the implementation details of two simple pipelines in StreamSets Data Collector; the first takes the data from the HTTP feed to Kafka, while the second loads the data from Kafka into Kudu. StreamSets Data Collector has a Preview feature that allows simulating the execution of the pipeline (no data is written), so you can detect errors and see the size of the data in motion. Once you have debugged the solution and the results of the Preview are as expected, you can run the pipelines. StreamSets Data Collector has monitoring features for the pipeline being executed, showing the number of rows being moved, errors, etc.
In this post we have only covered the basic features of StreamSets Data Collector, but we loved how easy it was to make real-time pipelines – especially when contrasted with the amount of coding required to write a real-time application without StreamSets, even more so when Kafka’s in the mix. We also loved the pipeline monitoring feature – it made the task so much easier. Note that StreamSets Data Collector is 100% open source and is based on the Apache 2.0 license, so using this component is actually free. StreamSets DataOps platform contains many other tools for enterprise-level implementations and operations of data-streaming architectures.
Once our real-time data is flowing into Kudu we can visualize it and create reports and dashboards. However, not every BI and analytics tool supports real-time visualizations. Nowadays, the best tools for this task are Zoomdata and Arcadia Data. In our first blog article we looked at Zoomdata, even though we did not cover its real-time capabilities, which are excellent. We will see how to create real-time dashboards with the Hadoop-native Big Data and BI tool Arcadia Data in the next blog article.
At ClearPeaks we are experts on Big Data and BI. We have worked on various projects where real-time visualizations were a must, and have achieved them with different technologies, including the ones discussed in this blog series – StreamSets, Kafka, Kudu, Zoomdata and Arcadia Data – but also with Flume, Spark Streaming and Cloud services like Azure Events Hub and Azure Stream Analytics. Check out our previous blog article where we used the Azure stack to create (limited) real-time visualizations with Microsoft Power BI. If you need more information about StreamSets or other real-time tools, or if you would like to know how to leverage these technologies in your business, don’t hesitate to contact us.