20 Apr 2022 Building an All-in-One Serverless Data Platform with Domo
Nowadays, organisations must make business decisions based on data representing the reality of the market and their environment to succeed and set themselves apart from the rest. Being a data-driven organisation is not an easy task; you must have one or multiple platforms to store, process and visualise your data, and the vast amount of data and sources can make governance an absolute nightmare.
In a previous blog post, we discussed the key points you should consider when choosing your data platform. In today’s blog post, we are going to introduce Domo, a SaaS cloud-based BI platform that provides end-to-end tools to deliver modern BI to business decision makers.
Domo is an interesting proposition as it has all the aspects a BI platform needs: ETL, storage, and visualisation. Domo is different from other BI tools because it is an all-in-one SaaS platform. While most platforms focus on one or two BI steps (for example, Snowflake focuses on storage, Pentaho Data Integration (PDI) on ETL, etc.), Domo covers all the steps, providing tools for ingesting, storing, transforming, and visualising data, as well as for taking action on data insights.
In this blog post, we are going to examine the main components of Domo and take a look at its capabilities and features.
The Domo Warehouse
The Domo warehouse differs from classic data lakes or data warehouses, some of which we have already looked at in previous blog posts such as Building a Cloud Data Warehouse with BigQuery and Data Lake Querying in AWS – Snowflake.
In Domo, you can upload any kind of data through different Connectors or configure Federated DataSets to access external warehouses without importing the data.
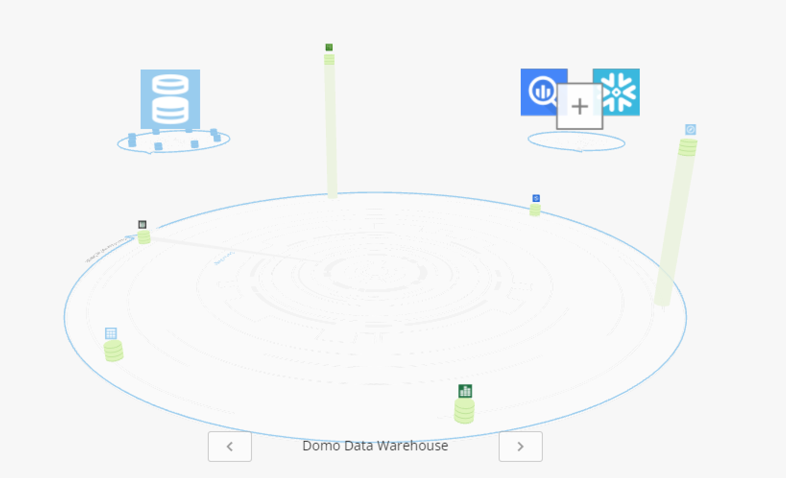
Figure 1: Domo Data Warehouse
This image above represents the Domo Data Warehouse, where you can visualise all the DataSets in Domo and the external cloud data warehouses/lakes in separate circles.
The boxes in the image represent all the sources of your data. In this case, we have six diverse sources such as S3, Synapse, and local files. When hovering over a box you can visualise the number of DataSets coming from that source, the total number of rows and the number of Cards, which are individual visualisations of a DataSet. Furthermore, the height of the green box instantly shows which sources are the bigger ones in terms of the number of rows.
Being aware that many customers might want to stick with their current warehouse and not move their data, Domo offers the ability to connect to data in your data warehouse via federated queries, and also offers native integrations with cloud data warehouses such as Snowflake. For instance, you could use Snowflake as the main warehouse and Domo could cover the transformation of data, writing back the results to Snowflake.
DataSets
In general terms, a Domo DataSet consists of all the metadata and information related to your data from a specific source. There is a section that lists all the Domo DataSets and relevant information like the name, the owner, the number of rows, Cards, tags, and the last time it was run. Moreover, there are multiple filtering options, which is extremely handy when dealing with thousands of DataSets.
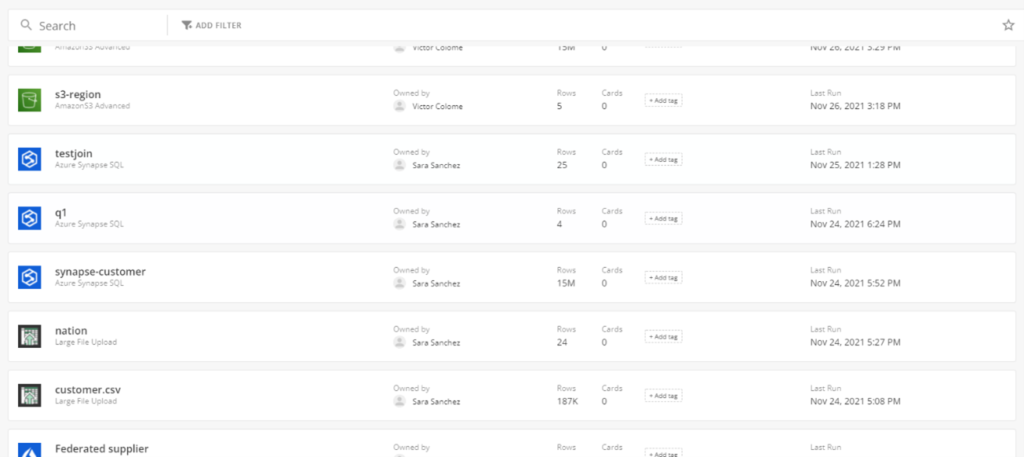
Figure 2: Domo DataSets listing page
When you click on a DataSet, you get a general overview with different sections. In the overview, we can find governance information about our DataSet, such as the impact it has on other DataSets or transformation processes, the number of visualisations powered by the DataSet, and the alerts configured to notify certain users when data points reach a defined threshold.
In the other sections, you can delve deeper into other elements, including viewing the data rows and statistics for each column, visualisations created using this DataSet, data lineage to understand the upstream and downstream impacts of this DataSet, Personalized Data Permissions (PDP) applied, alerts on this DataSet, options for automated machine learning, viewing the Cards, and more.
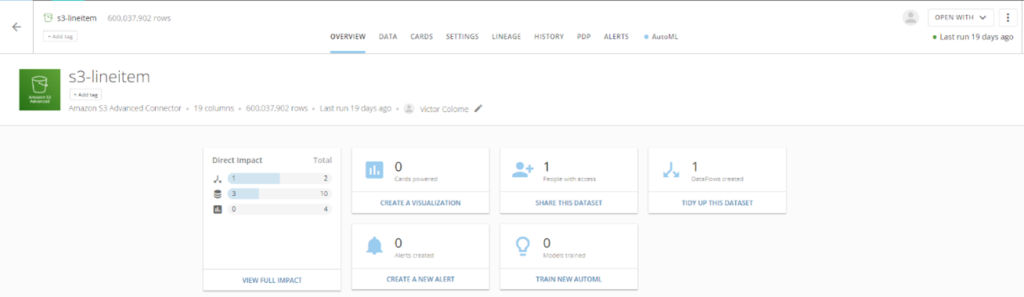
Figure 3: Domo DataSet overview
For the DataSets that are directly connected to a data source outside Domo, there is the history section where you can check the history of all the ingestions carried out, with information about when, how long it took, and the number of rows updated; this is pretty helpful to monitor scheduled updates in DataSets.
As we mentioned before, the data from DataSets can be imported by cloud Connectors. These Connectors are predefined integration connectors that allow importing data from any cloud system to Domo. You can also import data from many databases, IOT tools, and of course there is the option to directly upload files from a local machine. And if none of the given Connectors are suitable for you, you can create your own connector.
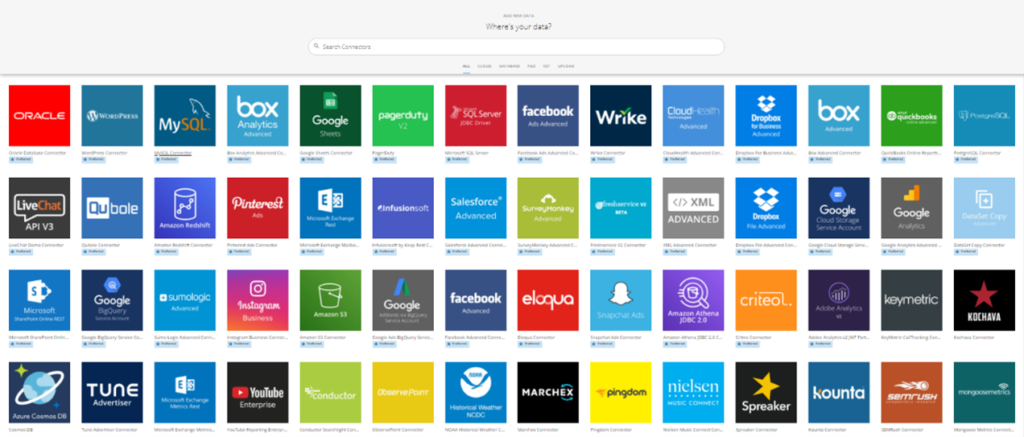
Figure 4: Domo Connectors list page
Each Connector is configured differently depending on the source, but generally each corresponds to a single table in a database or a single file or folder in a data lake, so the number of DataSets can increase exponentially, making management quite difficult. To prevent this, Domo provides a set of governance features, like the tags mentioned above, that make governance easier.
Domo provides many features to leverage governance in the platform, such as the tag, a popular feature in cloud platforms that allows grouping DataSets and checking the impact of a DataSet, seeing which components are directly or indirectly using it, and the DataSet lineage section, which displays related DataSets in a clear format.
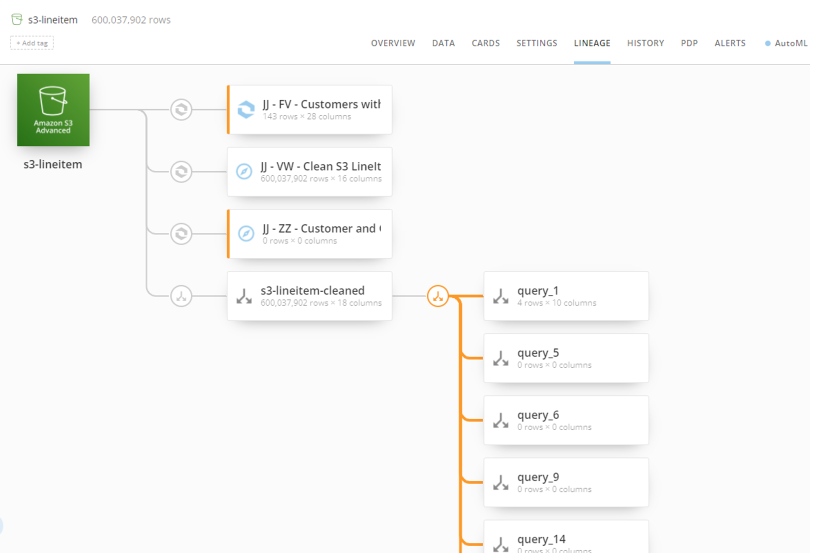
Figure 5: Domo DataSet view
Data Transformations / ETL Tools
Another key component in Domo is the DataFlow, which is used to transform data from DataSets and generate new ones. There are three types of DataFlow: the first is Magic ETL, with its intuitive drag-and-drop functionality that lets you visualise your DataFlows on the go, similar to other technologies that we have already covered in previous blog posts, such as Kettle/PDI.
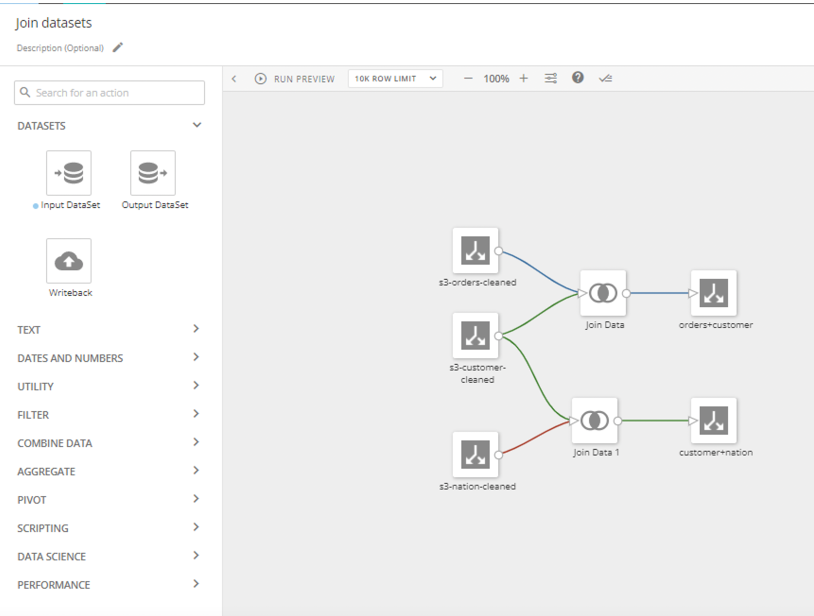
Figure 6: Domo Magic ETL
As you can see in the screenshot above, there are many transformations available: writing back data to the original source, altering columns, joining DataSets, filtering and dropping data, machine learning tools and even writing custom scripts in Python or R.
The second DataFlow is called DataFusion, which basically provides a simple UI to select DataSets and join them by columns based on column keys or by rows if all the DataSets schemas match; the output is obviously a new DataSet.
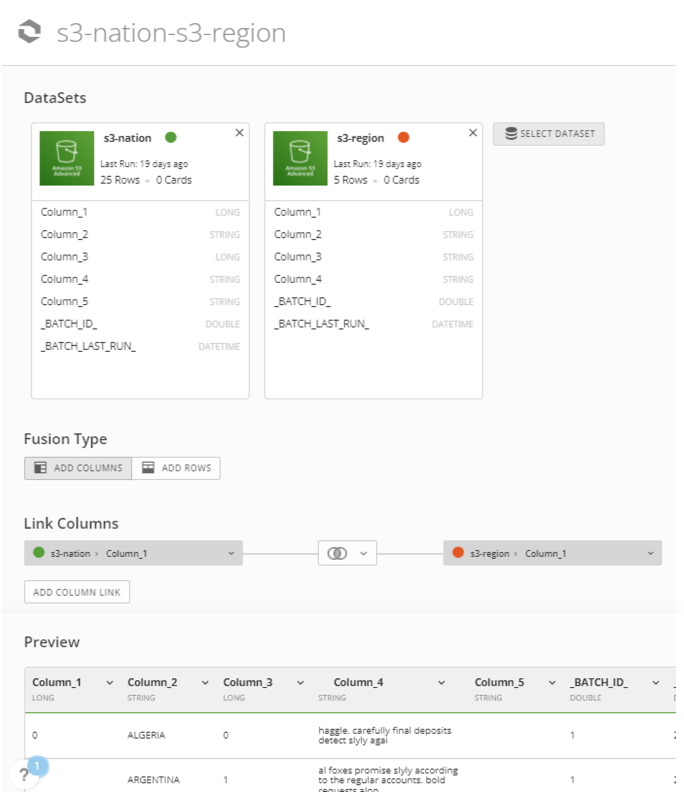
Figure 7: Domo DataFlow view
The last DataFlow is specialised in SQL querying, where Domo provides three SQL expression types to write the SQL sentences: MySQL, Redshift and Adrenaline, the latter being the Domo custom offering.
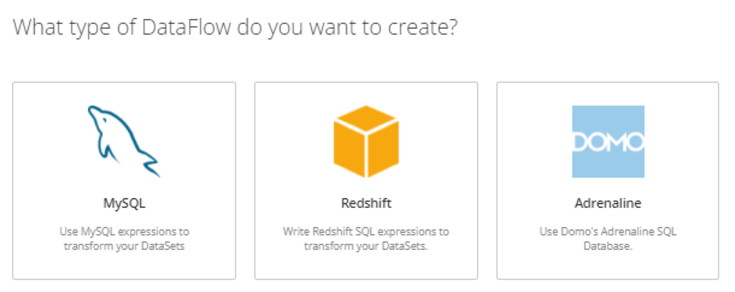
Figure 8: Domo SQL DataFlow types
They all work in the same way: you have to select the DataSets you want to query, and the output will be a DataSet (or more) with the result of the query defined.
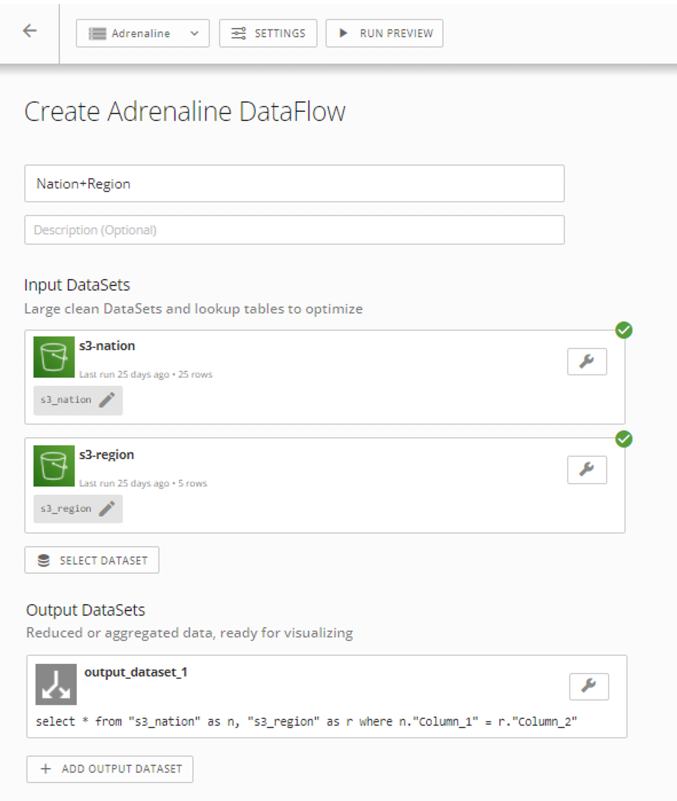
Figure 9: Domo SQL DataFlow view
Visualisation in Domo
As we mentioned before, Cards can be created based on DataSets. A Card is a visualisation of a DataSet, and there are more than 150 chart types that can be used, including pie charts, bar charts, filters, maps, period-over-period charts, Trellis charts, data science charts, tables, and more.
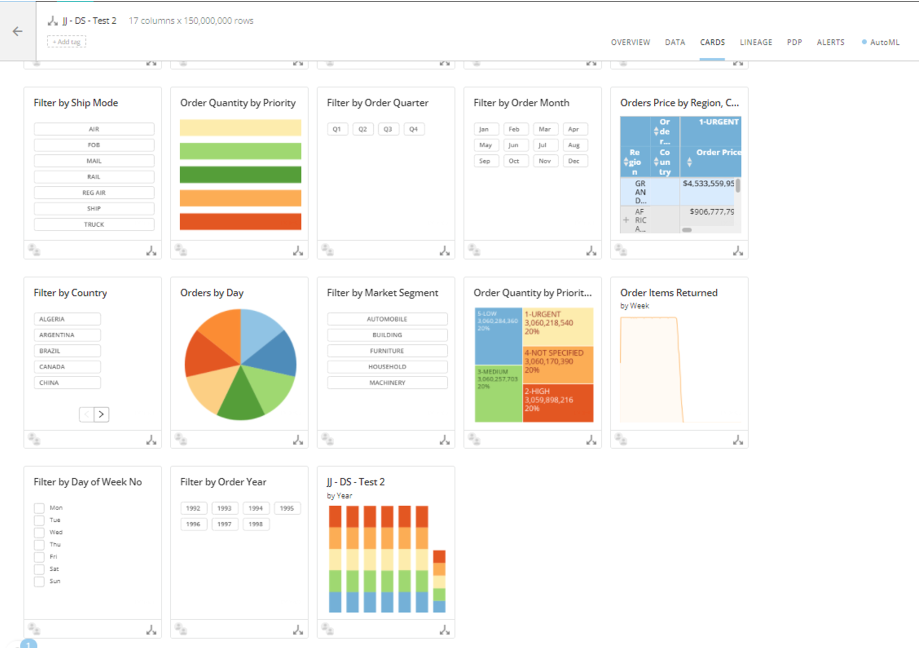
Figure 10: Domo DataSet Cards view
These visualisations are created in the Analyzer tool, an intuitive page where you can click on the chart type you want to visualise, drag columns into the fields, and the visualisation is automatically created with no coding required!
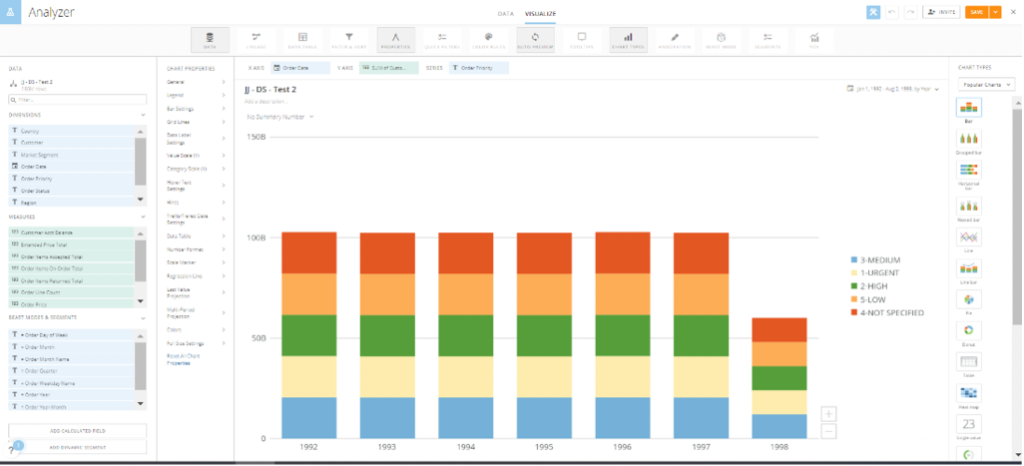
Figure 11: Domo Analyzer view
The visualisations are interactive and widely configurable. We are not going to go through all the configuration properties here, but in general you can configure things like colours, the legend, labels, and scales.
You can use Cards to create interactive dashboards called Stories, which allow you to gather several Cards in one dashboard for easier consumption.
As with all Domo features, Stories sticks to the simplicity of avoiding code; simply drag and drop the desired Cards onto the Dashboard. To start creating one, the first thing you should do is enable the edit mode (click the plus button (Add), then Dashboard, then the wrench icon at the top right) and place a layout for the Cards.
There are many predefined layouts, but you can edit them once placed (deleting a grid, changing grid places, sizes, etc.). Besides Cards, you can also place images, text, headers, calculations, etc.
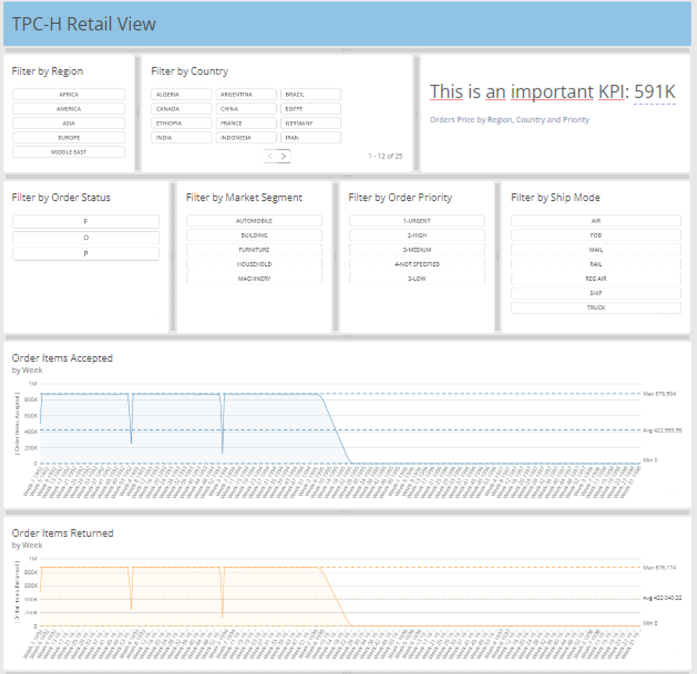
Figure 12: Domo Dashboard example
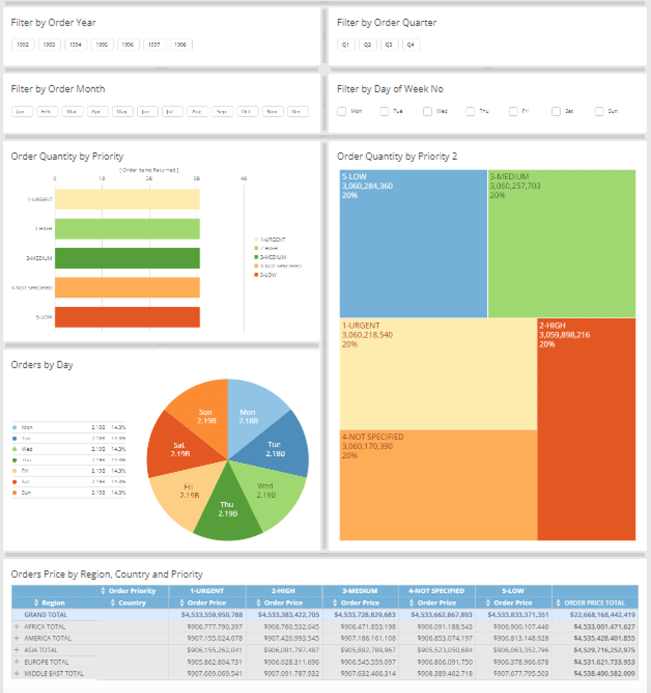
Figure 13: Domo Dashboard example (continuation)
It is also possible to apply filters and save them as bookmarks to later apply them with a simple click, set one of them as default, or grant access to the Dashboard only to a predefined filter; this option allows you to limit the viewing of your data to users according to, for instance, region. Furthermore, filters can be applied to all the Cards from the Dashboard or just to some specific Cards, easily configurable with few clicks.
Governance in Domo
Throughout this blog post we have discussed many Domo governance features, such as tags for DataSets, data lineage, and filtering by users. Governance is a must for companies wanting to become data-driven organisations, and some platforms lack such tools. Domo, on the other hand, has put a great deal of effort into creating a platform where governance is central to all the features they provide in a straightforward way.
These are the reasons why we wanted to conclude this blog with this topic, showing you the user and roles management in Domo. There is a special section called Governance where you can manage several aspects:
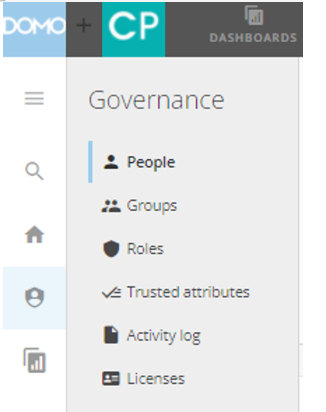
- People: A table with the users in your organisation. You can add as many users as you want, assign roles and divide them into departments. You can also track when the account was created and the last activity.
- Groups: Logical groups where you can assign users and apply security.
- Roles: Where you can create new roles, grant permissions to roles, and set default roles for new users.
- Trusted attributes: Where you can define which user details are set by administrators (email, ID, department, etc.).
- Activity log: A list of all the activity done in Domo by all users, like creating DataSets, updating cards, viewing a Dashboard, etc.
- Licenses: Where you can manage Domo licenses.
In conclusion, Domo has all the governance requirements that you would expect from any proper BI platform—and more!
Conclusion
Domo can help with every aspect of a BI project. It has all the tools and features of an all-in-one SaaS platform, including powerful governance, simple ETL tools, visualisation elements such as Cards and Dashboards, and low/no-code data analysis.
Thanks to these features Domo delivers modern BI to organisations, enabling them to make data-driven decisions. If you are interested in learning more about Domo and how it can drive your business forward, please do not hesitate to contact us!