
18 May 2022 Generic DAX Template to Query Any Power BI Dataset
Power BI is a powerful tool that allows all sorts of businesses, from small companies to the biggest corporations, to leverage their data; and its users range from business newbies to advanced analysts.
Behind the scenes of Power BI Service there is a lot going on: fully fledged instances of Analysis Services Tabular provide the muscle that calculates all your visuals, dashboards, reports, and goals.
Not only that, Microsoft lets you tap directly into all those tabular models and query data directly through XMLA connections, and recently they have enabled access through a REST API service with the full potential of Data Analysis Expressions (DAX), heralding all sorts of data integration in custom applications.
When building such an application, like our very own Observation Deck, one wants as much flexibility as possible, and so we faced the challenge of creating a DAX query template for all use cases. We wanted something as simple and as flexible as the “SELECT * FROM Table” in SQL that we all know and love.
In this brief article, we’re going to present the DAX pattern that solved it for us.
DAX and the Importance of a Good Model
DAX stands for Data Analysis eXpressions, and it’s the language created specifically for Analysis Services Tabular. It is used in products such as Power BI, Power Pivot, and of course, SQL Server Analytic Services (SSAS) and Azure Analysis Services.
Even though it has a lower entry barrier for beginners, especially if compared to Multidimensional Data Expressions (MDX), DAX gets difficult pretty quickly. It’s not long before the recently initiated discover that DAX may sometimes be elusive in its ways and provide unexpected results. DAX must always be learned together with data modelling, studying the theoretical concepts behind star schema, filter context, row context, filter propagation and so on – but that’s something for another blog post (or a series of them!).
For the purposes of this article, we will assume that the dataset in your Power BI Service complies with the basics of the star schema and the Kimball methodology, that you have access to it, and that you know the data model or have access to the documentation.
Template Queries for Automation
Objective
The aim of our template query is to retrieve data from a dataset in Power BI Service using the REST API, with the data to be returned in a table defined by a set of dimensions and a set of calculations, where some filters may have been applied:
Dimension 1 | Dimension 2 | … | Dimension n | Calculation 1 | Calculation 2 | … | Calculation n |
|---|---|---|---|---|---|---|---|
Query Parameters
Let’s define the input for the template:
- Dimensions: Name of the fields of the tables as shown in the Power BI model.
- Calculations: Name of the measures as defined in the Power BI model, or DAX expressions that return a single value (table expressions not allowed).
- Filters: Constraints to be applied to the calculation.
SUMMARIZECOLUMNS and Expanded Tables
The key to our template resides in a single DAX function: SUMMARIZECOLUMNS. Think of your model as if it were built from a single big table: SUMMARIZECOLUMNS lets you select any of the fields of that expanded table, along with any calculation applied and any filter affecting those dimensions. Of course, this is an oversimplification, but a useful one to build our pattern.
Start with the dimensions:
SUMMARIZECOLUMNS (
      <Dimension 1>
     , <Dimension 2>
     , <Dimension n>
)
In this step, SUMMARIZECOLUMNS performs a GROUPBY of the selected dimensions. Note that if the dimensions do not belong to the same logical tables, this expression without any calculation will return a crossjoin.
The dimension parameter needs to be referred as you would a column in a DAX expression: ‘Table Name’[Column Name]
Then include the filters:
SUMMARIZECOLUMNS (
     <Dimension 1>
     , <Dimension 2>
     , <Dimension n>
     , <filter expr. 1>
     , <filter expr. 2>
     , <filter expr. n>
)
Include the filter expressions, regardless of whether they affect the selected dimensions or others in the expanded table. For the filter expression you could get away with a simple TREATAS. However, a more generic way would be:
FILTER (
      KEEPFILTERS ( VALUES( ‘Table Name'[Column Name] ) )
      , <Filter Expression>
)
Let’s take a look at this expression, since it is not so straightforward: the VALUES (‘Table Name'[Column Name]) returns all distinct records of the field. We wrap it with KEEPFILTERS to make sure that other filters affecting this column (from outside the SUMMARIZECOLUMNS itself) are also considered. We then apply the outer FILTER function, which specifies the filter expression in the second argument.
The filter expression can cater to any use case. Some useful examples:
[NOT] ISBLANK( ‘Table Name'[Column Name] )
[NOT] ‘Table Name'[Column Name] in {“Value1”,”Value2”,…,”ValueN”}
SEARCH( “string” , ‘Table Name'[Column Name] , 1 , 0 ) >= <number of instances>
‘Table Name'[Column Name] >= <NumericValue>
Finally, include the calculations:
SUMMARIZECOLUMNS (
     <Dimension 1>
     , <Dimension 2>
     , <Dimension n>
     , <filter expr. 1>
     , <filter expr. 2>
     , <filter expr. n>
     , "Calculation Name 1", <Calculation 1>
     , "Calculation Name 2", <Calculation 2>
     , "Calculation Name n", <Calculation n>
)
It is recommended to use measures that have been tested and are already available in the model, but if you need to build one on the spot, you can. The name for the column filled by that calculation must always be provided in the query, after which the calculation goes:
“Column Name in Result”, [Measure Name]
Use Case with DAX.do
All this pseudocode is great, but now we’re going to put it to the test using the awesome DAX.do service: the content creators at SQLBI generously provide this online service to run DAX queries on a subset of Contoso tables.
Contoso Data Model
Contoso is a fictitious retail company whose database is used by Microsoft in many of their demos and tutorials. In DAX.do we can use the Date, Customer, Product, Sales and Currency tables, all correctly laid out in an ideal star schema. Just like in Power BI, there are also some available measures, such as Quantity, Discount, Total Cost, Margin, etc.
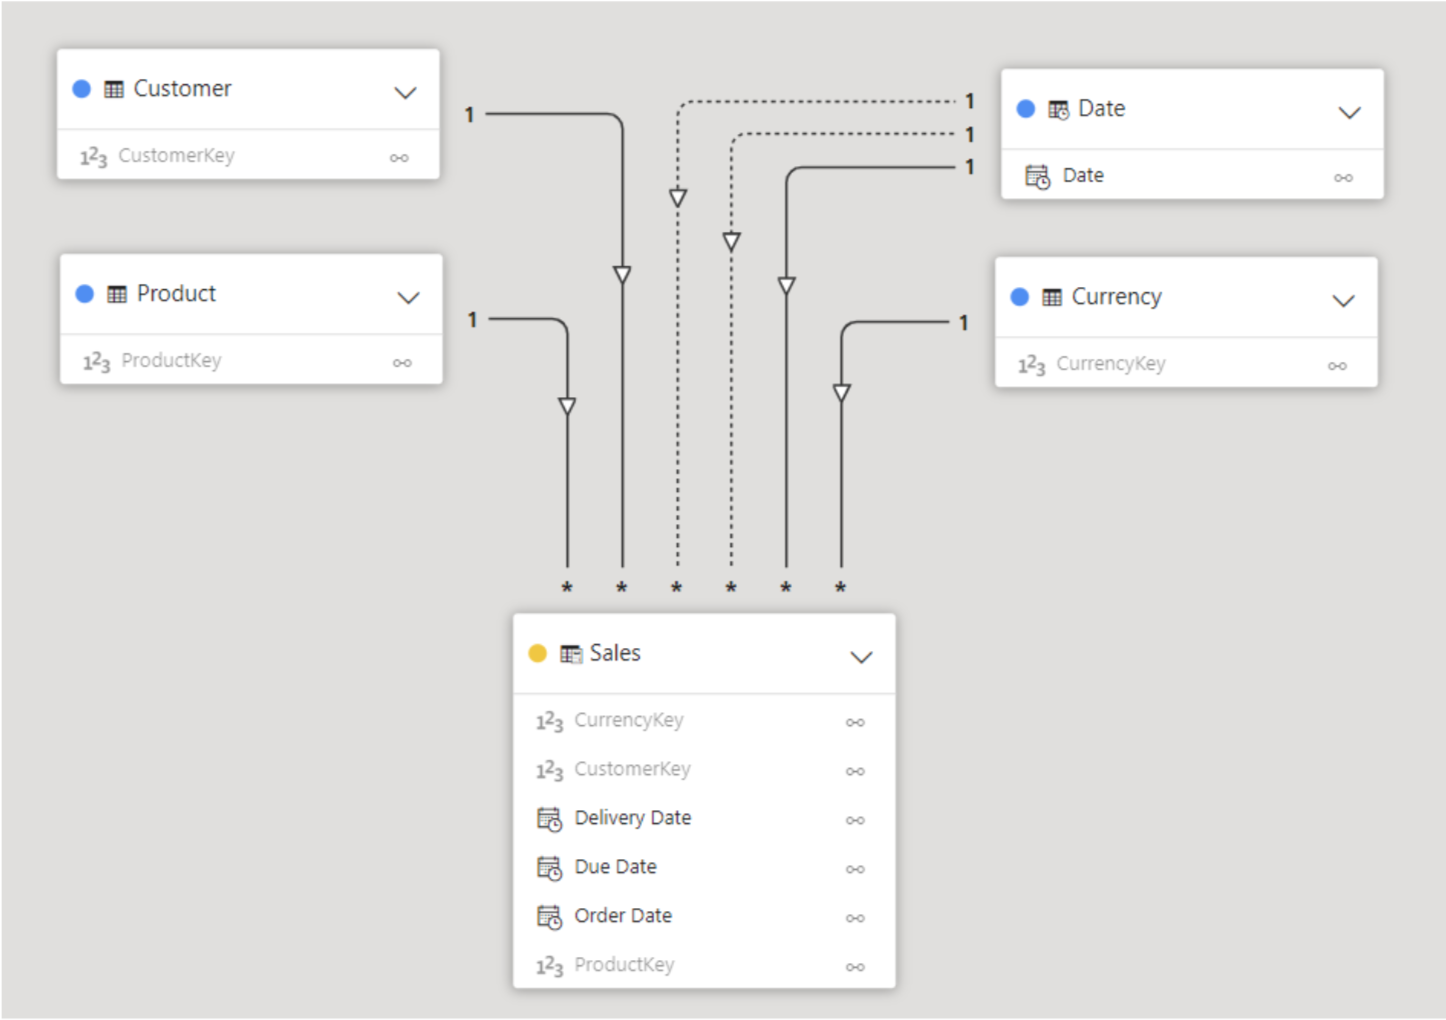
Figure 1: Contoso data model in DAX.do
The Business Question
To illustrate the template, we will run a query to solve the following question:
- For Calendar Years 2007 and 2008, what where the Quantity, Sales and Margin for customers based in California, Washington and Ohio, of products excluding the Games and Toys category?
Building the Query
To build the queries, we can explore our data element by element in order to understand it better. SUMMARIZECOLUMNS can also be used for this, creating smaller queries.
We start with just the dimensions, one by one:
- ‘Date’[Calendar Year]
- ‘Customer’[State]
EVALUATE
SUMMARIZECOLUMNS ( 'Date'[Calendar Year] )
This returns the distinct values available in that field:
Calendar Year |
|---|
CY 2005 |
CY 2006 |
CY 2007 |
CY 2008 |
CY 2009 |
CY 2010 |
CY 2011 |
The State dimension has 100 records. We won’t go into them here, but you can review them with the following query:
EVALUATE
SUMMARIZECOLUMNS ( Customer[State] )
If we include both dimensions in the expression without any calculation, the result will be a crossjoin, since the fields are not connected until evaluated together with the Sales table. Before we showcase that, let us explore the filter expressions. As a standalone, they are already table functions, which can be evaluated to retrieve a result:
EVALUATE
FILTER(
        KEEPFILTERS( VALUES('Date'[Calendar Year]) )
        , 'Date'[Calendar Year] IN { "CY 2007", "CY 2008" }
    )
Result:
Calendar Year |
|---|
CY 2007 |
CY 2008 |
However, once included in the SUMMARIZECOLUMNS, the expression becomes a constraint of the selected dimensions:
EVALUATE
SUMMARIZECOLUMNS (
    'Date'[Calendar Year]
    , FILTER (
        KEEPFILTERS ( VALUES ( 'Date'[Calendar Year] ) )
        , 'Date'[Calendar Year] IN { "CY 2007", "CY 2008" }
    )
)
Result:
Calendar Year |
|---|
CY 2007 |
CY 2008 |
Going back to the previous observation, the outcome of having two dimensions from different tables without context will generate a crossjoin:
EVALUATE
SUMMARIZECOLUMNS (
    'Date'[Calendar Year]
    , Customer[State]
    , FILTER (
        KEEPFILTERS ( VALUES ( 'Date'[Calendar Year] ) )
        , 'Date'[Calendar Year] IN { "CY 2007", "CY 2008" }
    )
    , FILTER (
        KEEPFILTERS ( VALUES ( Customer[State] ) )
        , Customer[State] IN { "Washington", "California", "Ohio" }
    )
)
Returns:
Calendar Year | State |
|---|---|
CY 2007 | Washington |
CY 2008 | Washington |
CY 2007 | California |
CY 2008 | California |
CY 2007 | Ohio |
CY 2008 | Ohio |
But when we bring the measures to our next step, context is automatically picked up by the engine:
EVALUATE
SUMMARIZECOLUMNS (
    'Date'[Calendar Year]
    , Customer[State]
    , FILTER (
        KEEPFILTERS ( VALUES ( 'Date'[Calendar Year] ) )
        , 'Date'[Calendar Year] IN { "CY 2007", "CY 2008" }
    )
    , FILTER (
        KEEPFILTERS ( VALUES ( Customer[State] ) )
        , Customer[State] IN { "Washington", "California", "Ohio" }
    )
    , "Qty", [# Quantity]
    , "Sales", [Sales Amount]
    , "Margin %", [Margin %]
)
This returns the accurate calculations:
Date[Calendar Year] | Customer[State] | Qty | Sales | Margin % |
|---|---|---|---|---|
CY 2007 | Washington | 3,675 | 846,622.76 | 52.55% |
CY 2007 | California | 6,881 | 1,808,972.39 | 53.98% |
CY 2007 | Ohio | 361 | 78,231.62 | 55.01% |
CY 2008 | Washington | 1,951 | 523,178.05 | 53.57% |
CY 2008 | California | 5,631 | 1,318,727.82 | 53.68% |
CY 2008 | Ohio | 122 | 39,130.00 | 56.75% |
You might now realise that we did not include the Category filter that was required in the business question. The Category dimension does not need to be included, so the expression will have one more filter, but the same table shape should be returned:
EVALUATE
SUMMARIZECOLUMNS (
    'Date'[Calendar Year]
    , Customer[State]
    , FILTER (
        KEEPFILTERS ( VALUES ( 'Date'[Calendar Year] ) )
       , 'Date'[Calendar Year] IN { "CY 2007", "CY 2008" }
    )
    , FILTER (
        KEEPFILTERS ( VALUES ( Customer[State] ) )
        , Customer[State] IN { "Washington", "California", "Ohio" }
    )
    , FILTER (
        KEEPFILTERS ( VALUES ( 'Product'[Category] ) )
        , NOT 'Product'[Category] IN { "Games and Toys" }
    )
    , "Qty", [# Quantity],
    , "Sales", [Sales Amount],
    , "Margin %", [Margin %]
)
The output is just as expected: almost the same, but with lower Sales and Quantity values:
Date[Calendar Year] | Customer[State] | Qty | Sales | Margin % |
|---|---|---|---|---|
CY 2007 | Washington | 3,675 | 840,681.02 | 52.59% |
CY 2007 | California | 6,046 | 1,787,582.98 | 53.95% |
CY 2007 | Ohio | 360 | 78,222.63 | 55.01% |
CY 2008 | Washington | 1,612 | 513,419.78 | 53.67% |
CY 2008 | California | 4,785 | 1,294,766.41 | 53.71% |
CY 2008 | Ohio | 122 | 39,130.00 | 56.75% |
Conclusions
The generic pattern presented in this short article has a lot of potential for automation: the usage of variables for each element of the query allows for any sort of combination of dimensions, filters, and measures. There is also the chance to include an ORDER BY statement to present the data in the proper sorting, or even FORMAT expressions to customise the result even more.
As DAX is an immensely powerful query language, the customisation possibilities for the embedding developer are endless, as are the analytical capabilities that the developer will be able to include in their application.
It’s also worth noting that while the construct presented here might look overly complex, it was inspired by how Power BI runs queries behind the scenes, and the performance obtained is virtually the same as using Power BI itself to run the calculations.
We wanted to use the REST API capabilities in our executive BI framework, Observation Deck, a web-based application for the C-level manager. We added a semantic layer that allows the final user to navigate and filter through Power BI content, jumping from one dataset to another or from one report to another, all without needing to open the sometimes cumbersome Power BI service website.
If you’ve got any queries yourself about what you’ve just read, or your BI projects in general, please don’t hesitate to get in touch with us here at ClearPeaks – our certified expert consultants would love to help you!