
20 Jan 2021 High Performance Data Processing with KNIME & MongoDB
Both KNIME and MongoDB are powerful engines. However, at the time of writing this article, the standard integration nodes between them are not exhaustive, which prevents users from taking full advantage of these two amazing platforms. In this article, we are going to discuss the use case of utilising Python to execute MongoDB aggregation pipelines via KNIME.
When using KNIME as a data engineering tool and MongoDB as a backend database, we may want to push the complex operations to the database instead of processing them in KNIME. This helps to conserve KNIME resources for other critical workflows, and leverages the database’s power to handle ETL operations, which it is good at.
It is also worth mentioning that MongoDB as a NoSQL database can execute aggregation operations on massive data within seconds. The same operation, when carried out entirely in KNIME, may take more time. This is because it involves reading data from the database, applying transformations, and then executing the real aggregation.
In this article, we’ll take a look at two approaches. In the first, we will show the simple average calculation use case, which queries MongoDB and performs the average calculation completely in the KNIME environment nodes. Then, as a second approach to reduce time and resource complexities, we will show the use of a Python script node in KNIME to leverage the MongoDB aggregation pipeline.
The first approach involves different sequential steps:
- Query the MongoDB database for the required time frame
- Fetch the records into KNIME
- Convert JSON to table
- Apply ‘mean’ aggregation using the GroupBy node
- Repeat the same operations ‘n’ times using a loop
Let’s take a sample use case where we have the taxi counts of 174 areas stored in a MongoDB collection called ‘TAXI_COUNTS’ for each five-minute interval in a day. In other words, as there are 288 five-minute windows in 24 hours, there are 174*288=50,112 records per day in the database. This gives us 18,290,880 records per year. Our objective is to find the simple average for each five-minute-window for the next 12 hours.
Let’s say we execute the workflow on ‘2020-11-08’. We need to compute the average taxi count for each area, for the time period starting from ‘2020-11-09T01:00’ till ‘2020-11-09T12:55’, with a five-minute window.
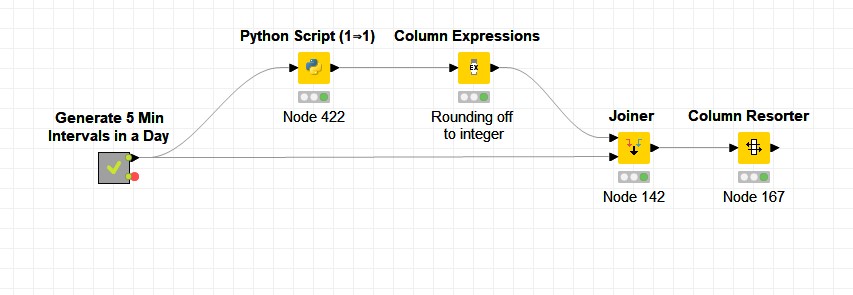
1. Aggregation in KNIME environment
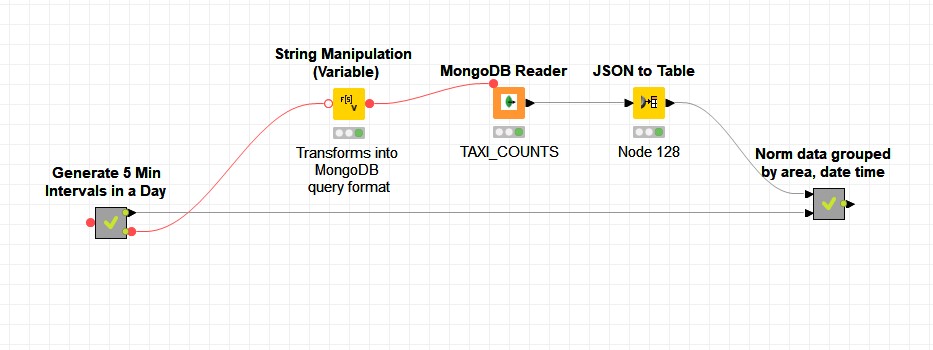
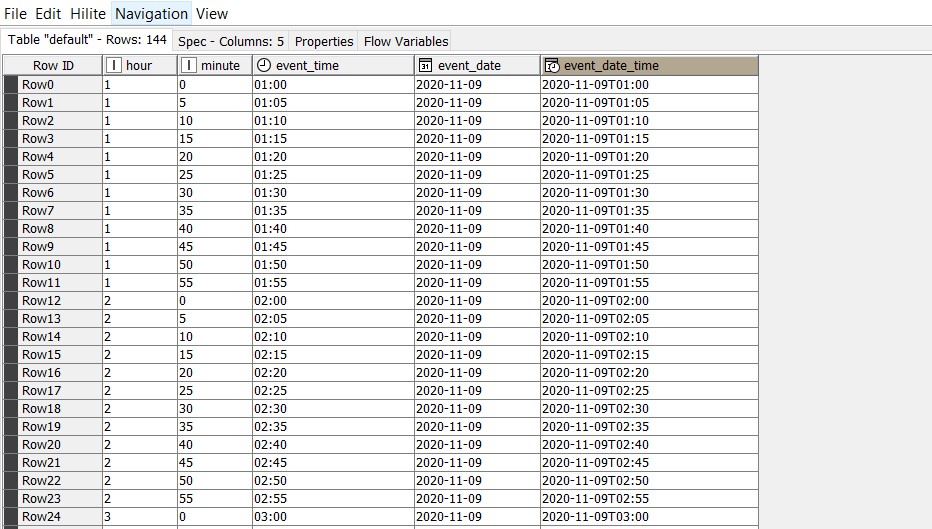
‘Generate 5 Min Intervals in a Day’ creates 144 records with five-minute intervals for the next 12 hours as shown below:
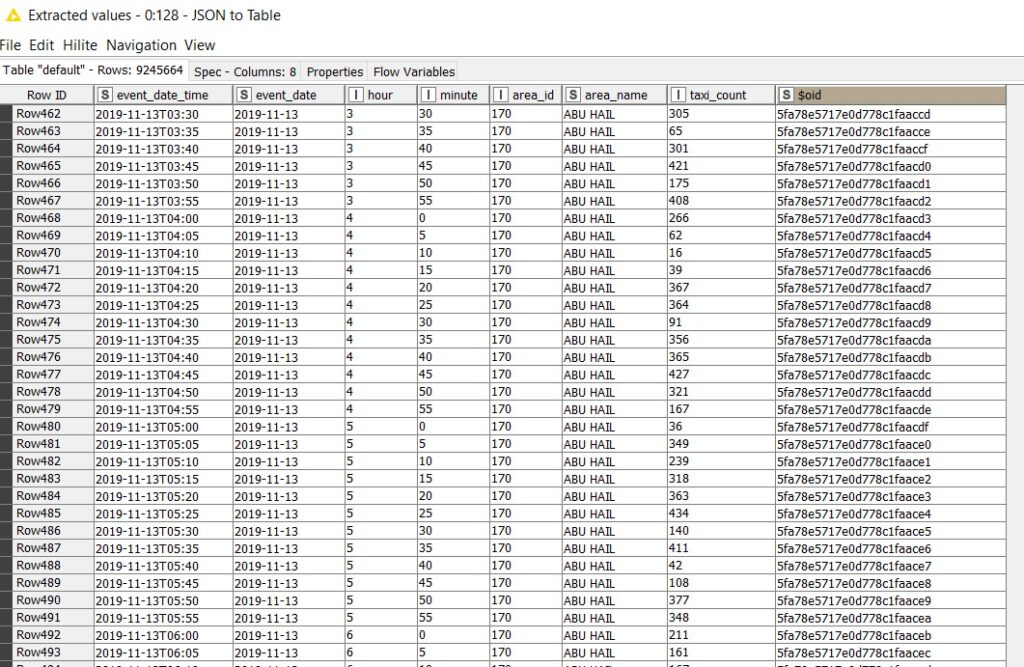
In the first approach, the data is fetched from the MongoDB collection ‘TAXI_COUNTS’, where event_date > ‘2019-10-09’ (past one-year data) using the ‘MongoDB Reader’ node. Thus, the data will include taxi counts of all the 174 areas for a period of one year.
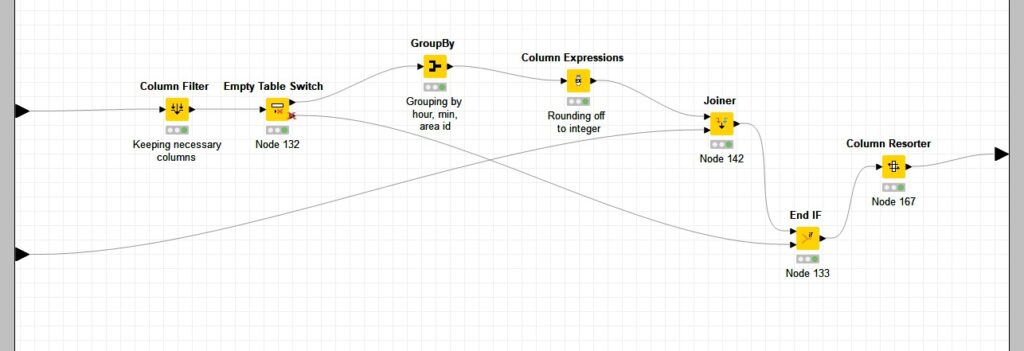
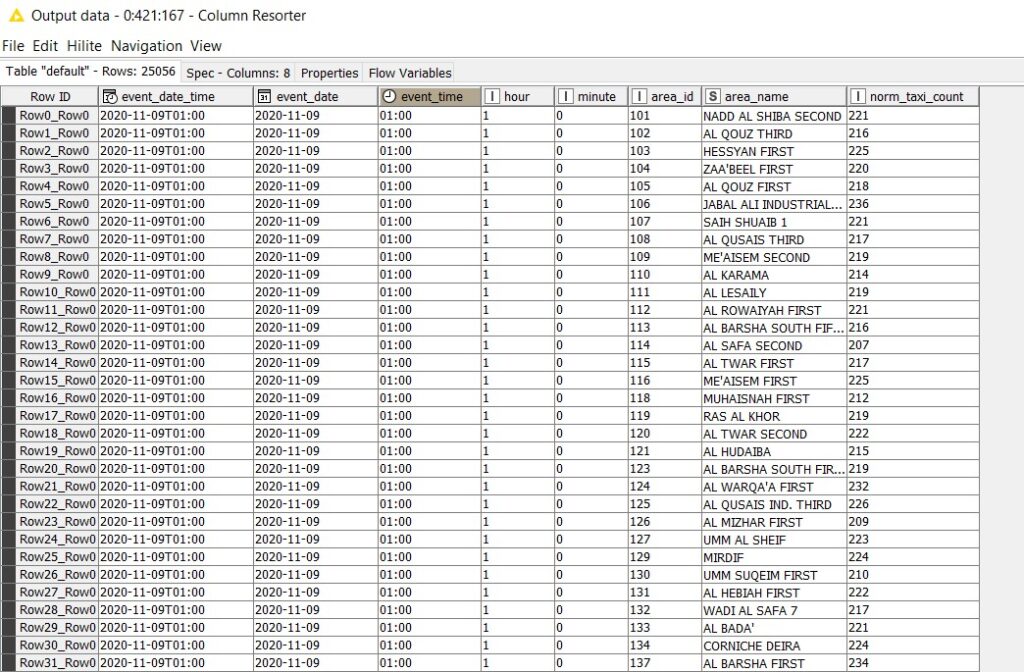
‘MongoDB Reader’ does not support aggregation operations, so we do the aggregation after bringing the data into the KNIME environment. Since the count of taxis is hugely dependent on the time field, the data from MongoDB is then grouped by area_id, area_name, hour and minute fields. The mean of taxi counts is then calculated (MEAN(taxi_count)) and rounded off to the nearest integer to form the norm (‘norm_taxi_count’). This is then joined with the 144 date time intervals.
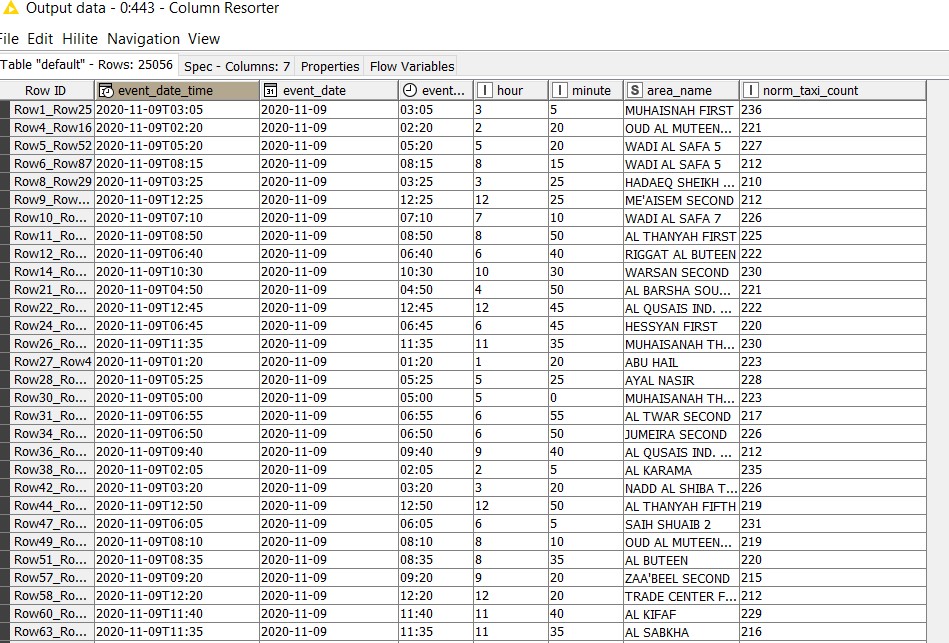
The transformed output contains 144 * 174 = 25,056 records with average values(norm_taxi_count) as shown below:
In this approach, we fetch around 9 million records (half of the total one-year data) from MongoDB and perform the average calculation in the KNIME environment. This is a highly resource intensive and time-consuming process. Thus, to improve performance, we take a different approach where we leverage MongoDB aggregation capabilities and perform an in-database operation through a Python script.
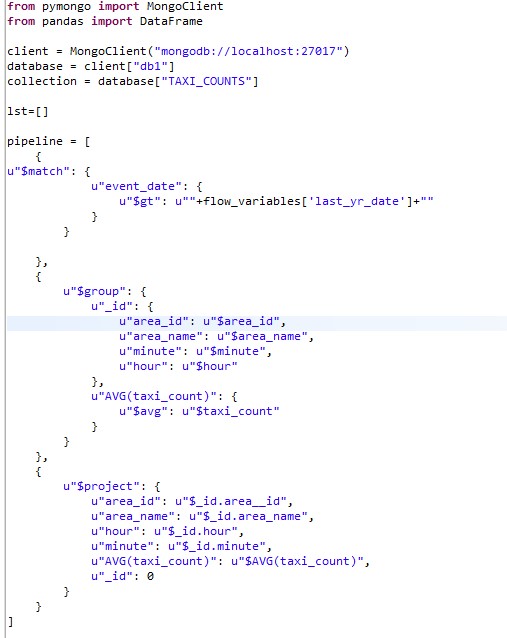
2. MongoDB Aggregation Pipeline using Python
We perform the aggregation operation to find the mean of taxi counts for each area id, area_name, hour and minute using MongoDB aggregation pipeline with a Python script as shown below.
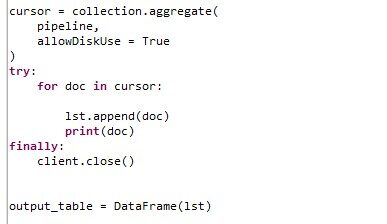
The output containing the average taxi counts is converted as a data frame (‘output_table’) and fetched into KNIME. This is then joined with 144 date time intervals as in the previous approach, to get 25,056 unique records having ‘norm_taxi_count’ for each of the 174 areas for the next 12 hours.
Enabling MongoDB In-DB aggregation accounts for huge improvements in execution time and resource utilisation. The execution time of this optimised approach is 40x faster than the first approach.
Conclusion
To summarise, as KNIME and MongoDB integration nodes are still in an early stage, we tried out Python nodes in KNIME to fully leverage the power of MongoDB power and increased the efficiency of data processing.
Please follow this space for more interesting articles about KNIME and its applications. We’d love to help you with complex data challenges in your organization, from engineering to machine learning, with our innovative solutions. Simply drop us a note at mailto:info@clearpeaks.com or sales@clearpeaks.com.