
10 Nov 2021 How Feature Engineering Trumps Algorithms
In the AI community we have recently seen a greater emphasis on moving from ‘Model Centric AI’ to ‘Data Centric AI’. Within the ‘Data Centric AI’ space there is an important data science lifecycle component known as Feature Engineering, and in a world obsessed with modern algorithms, this component is often ignored or given a low priority in the pipeline. Feature engineering is more science than data, because domain knowledge and understanding the business problem form its essence.
1. Methodology
In this article, we will focus on 3 different sets of feature engineering along with 3 different algorithms. We will test these 3 different methodologies on an electricity consumption dataset, and then compare the errors and conclude how feature engineering, when done right, can trump the choice of algorithms.
The algorithms used here are XGBoost, LightGBM, and GRU.
2. Dataset Description & Methodology
I will be using electricity consumption data at 15-minute intervals for a commercial building, which contains data from April 2017 till April 2018. This building has 3 meters (a main meter and 2 sub-meters), so we will predict 3 targets for each method.
The training set date range is from April 2017 till December 2017 and the test set from January 2018 till April 2018.
Since this is a forecasting problem, on the test set we used a weighted RMSE metric to evaluate forecasting errors. This metric gives greater weight to the nearer forecasted months and less weight to the predicted data further in the future.
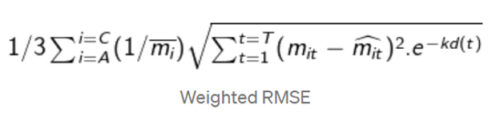
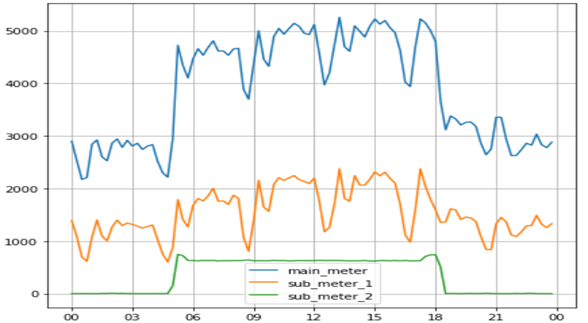
Figure 1: Data for 1-Apr-2017 for a complete day
3. Feature Engineering#1 with XGBoost
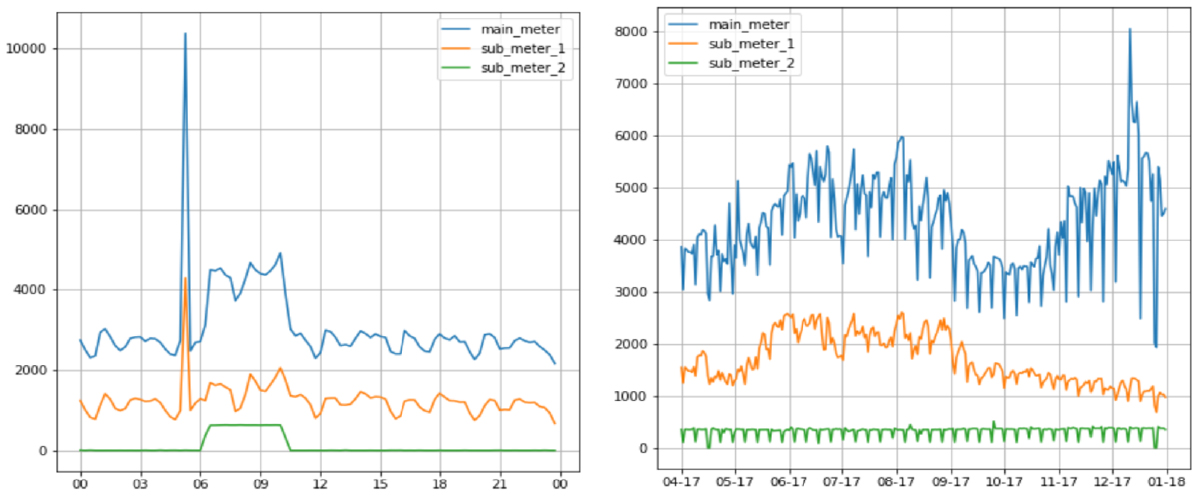
Figure 2: Power consumption on 2-Apr-2017 (Sunday) Figure 3: Monthly power consumption
A few important points to note about the data which will help us to make new features are:
- There is a sudden spike in consumption from 6 AM to 6 PM. We could build a feature like ‘working hours’ (Figure 1).
- On weekends (Sundays) power consumption is relatively low compared to weekdays, so we will build features for days as well (Figure 2).
- Power consumption is high in the June-August and November-January periods, whereas consumption is lower in the remaining months in the main meter readings (Figure 3). We can construct 2 more features like ‘season’ and ‘months’.
After incorporating these features, we took the training set and we trained the hyper-tuned XGBoost algorithm. Evaluation results for the test set show:
Main Meter Error | Sub-meter#1 Error | Sub-meter#2 Error | Overall Avg. Error |
|---|---|---|---|
30.4 | 15.3 | 33.2 | 26.3 |
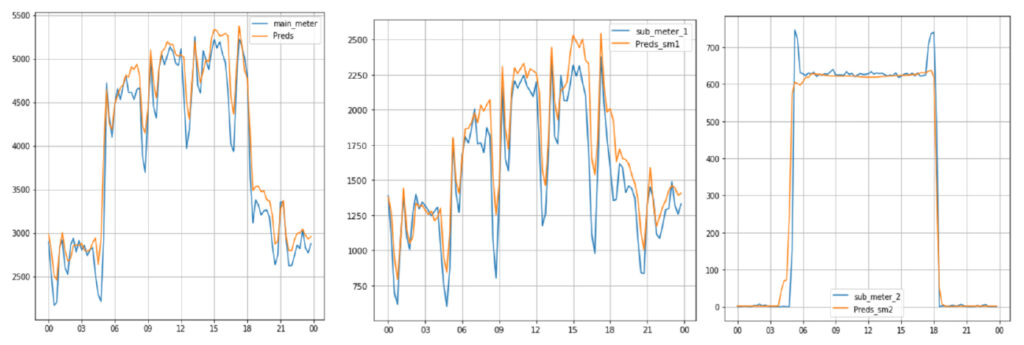
Figure 4: Sample Predictions for 1-Apr-2017
4. Feature Engineering#2 with LightGBM
Now we will explore what our results would be if we used a different set of features and a different algorithm.
- Construct quarter of the hour (0–3), hour of the day (0–23), day of the month, day of the week, month start and month end indicators for each row. Additionally, we could roll up the target value for each of the above features based on its hierarchy. This would give summarised target values for each data point.
Ex: building_number_dayofweek_hourofday_quarterofhour_mean for 1-Apr-2017 23:00 would be derived by taking the average of all target values which have building_number=1, dayofweek=5, hourofday=23, quarterofhour=0.
- The above features can also be converted to cyclical features using sine and cosine transformations. This is done as it can preserve information such as the 23rd hour and 0th hour being close to each other.
After incorporating the aforementioned features, we took the training set and we trained the hyper-tuned LightGBM algorithm. Evaluation results for the test set show:
Main Meter Error | Sub-meter#1 Error | Sub-meter#2 Error | Overall Avg. Error |
|---|---|---|---|
29 | 26 | 42.1 | 32.3 |
5. Feature Engineering#3 with GRU
In this final section, I will experiment with GRU (Gated Recurrent Unit), a special type of Recurrent Neural Network, part of Deep Learning algorithms, especially used for time-series data.
- Construct a corporate feature which takes binary values. For working hours (8 AM to 8 PM) this will be set as 1 and for the rest it will be set as 0.
- Construct day of week feature in the form of One Hot Encoding.
I tried different GRU model configurations: I have tried both training individual models for each meter of each building, and a generalised building-specific model too. I found that the generalised building-wise model, which predicted all the three-meter readings simultaneously, worked better than individual models for each meter.
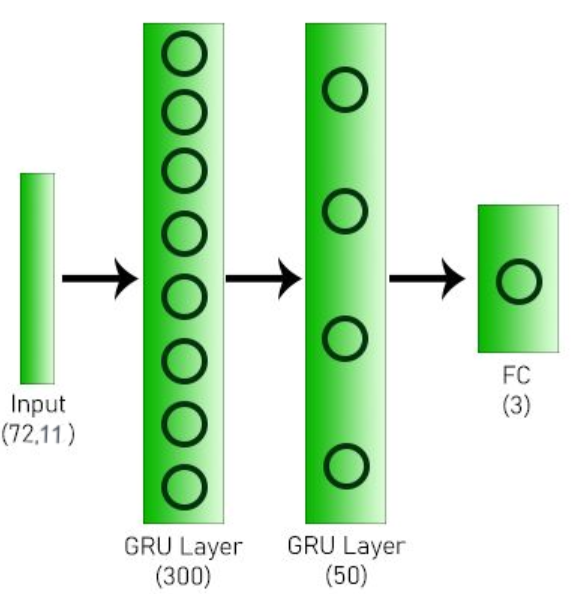
Figure 5: Neural Network architecture used
After incorporating the mentioned features, we took the training set and we trained our neural network for 35 epochs. Evaluation results for the test set show:
Main Meter Error | Sub-meter#1 Error | Sub-meter#2 Error | Overall Avg. Error |
|---|---|---|---|
32.7 | 25.5 | 31.6 | 29.9 |
Conclusion
This concludes my experiment for different sets of features used with different types of ML/DL models. We can clearly see that feature engineering set#1 with XGBoost gave the best predictions out of the 3 sets. Set#2 contains more mathematically-inclined features, but somehow fails to give the lowest error. In set#1, features are more diverse, intuitive and domain-specific.
Sometimes we need to construct features which are simpler, but can explain as much variance in data as possible, which help the model to learn more efficiently. Some features may make mathematical sense, as seen in set#2, but may not be as powerful as you’d expect. It’s trial and error: try different combinations of features with different ML/DL techniques, then settle for the one which gives you the best accuracy or lowest error.
We would really like to discuss the enterprise solutions and services that we can offer to help you reap the benefits of data science in your business. Send us an email and find out how our expertise can help you in your advanced analytics journey!
