
27 Apr 2023 Live Power BI Reports in Microsoft PowerPoint
Let’s imagine that we have a Power BI report, some PowerPoint slides to complement the data shown in the report, and that we want to use both in a presentation without having to jump between the two applications. The solution is to embed the Power BI report into the PowerPoint presentation.
Until now this was not a smooth option, since exporting the Power BI report as a PowerPoint document only created images of the report, like screenshots. Charts and big tables that were too big to fit on a page were cut off, just as they were in the report, but the scroll bar, although displayed in the PowerPoint, was not actionable. The result wasn’t too good, not even with a simple report.
Now, however, there is another option: you can embed live data into your presentation. The idea is not to copy an image of the report into PowerPoint, but to link the slide to the report. Users can now interact with the Power BI report from within the PowerPoint presentation. Let’s see how it works!
Exporting Power BI to PowerPoint
We are now in a Power BI workspace, looking at a report that we want to share in PowerPoint. It’s a two-page report, containing charts with scroll bars, custom visuals, filters, navigation buttons and tooltips (both default and custom):
Figure 1: Sample Power BI report
Starting from this page, the only thing we need to do is go to Export -> PowerPoint -> Embed live data. This will open a new window with a URL that links to that page of the report. Note that the URL only links to that page, so in our example, if we want to export the second page, we need to display it before exporting it, and the link will be different:

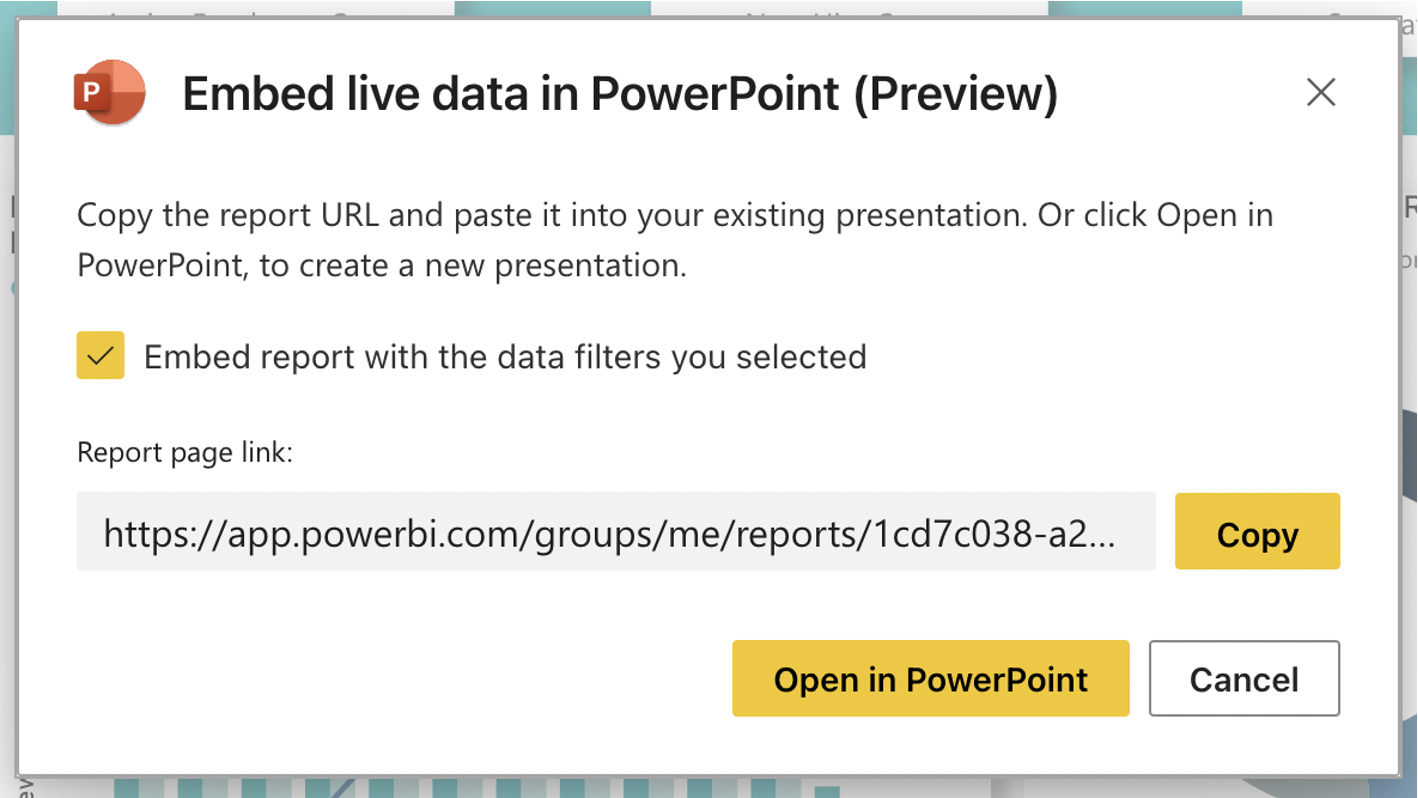
Figure 2: Embed Power BI live data link
To use this feature, you need to have the Microsoft Power BI add-in in PowerPoint. To install it in the desktop version of PowerPoint, go to Insert -> Get Add-ins and then, in the pop-up window, search for Power BI. Please note that there is another popular add-in called Power BI Tiles, and that’s not what we’re looking for in our example.
Then, from the Insert tab, add it to a slide from the document. The new component will ask us for the URL that we just copied, and after pasting it there the report will load into the component. Then we can adjust its position and size inside the slide, just like any other element of a PowerPoint presentation.
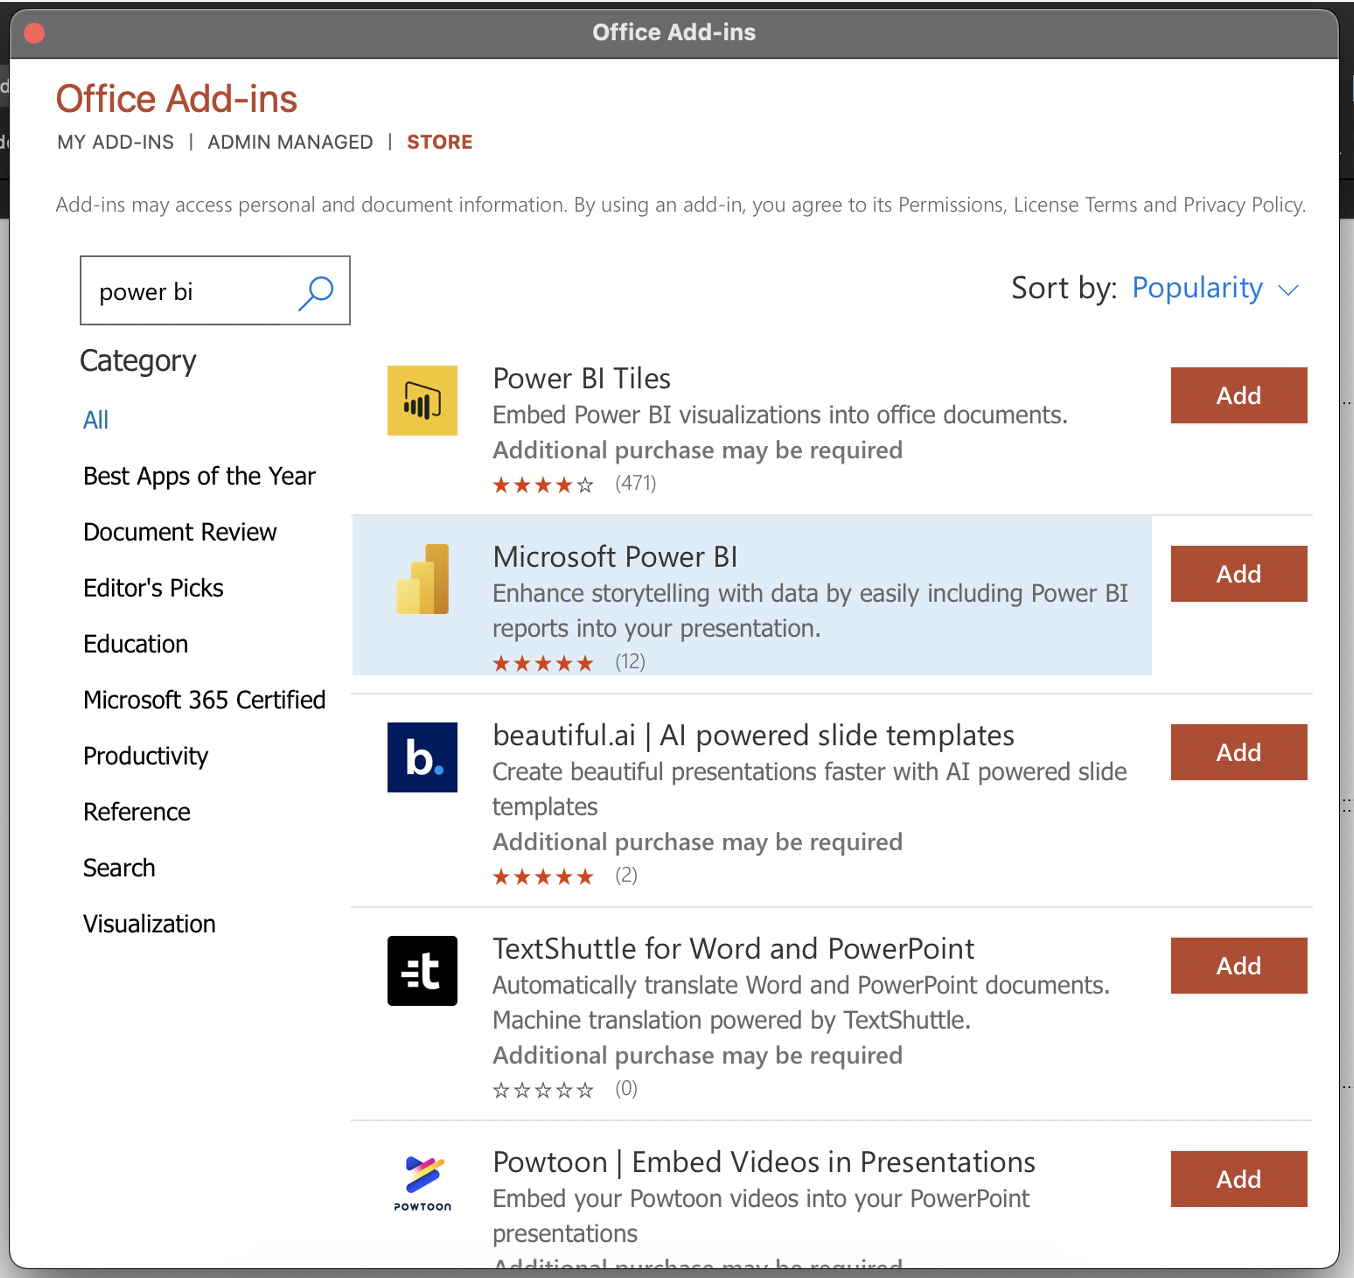
Figure 3: Microsoft Power BI add-in
This new element points to the original report in Power BI. We can apply filters, highlight elements of a chart, check the tooltips, or use the buttons just like in the Power BI page. Any changes made in the original report will be replicated in the PowerPoint, and the data will be updated as well.
The only limitation we’ve found is that you need a different URL for each page of the Power BI report. Although this doesn’t limit the number of pages that we can display in PowerPoint, it does take slightly more time to add the links to the other slides. Nevertheless, we can avoid these extra steps by using the navigation buttons in the Power BI report and thus access the entire report from only one slide.
Figure 4: Adding a Power BI report to a PowerPoint presentation
Sharing Presentations with Power BI Content
Now that we have successfully exported a Power BI report into a PowerPoint presentation, we can share it with other users. It works perfectly in both the desktop and online versions of PowerPoint, making it really easy to share within the company.
What About Security and Permissions?
Security is defined by the Power BI report itself: when a user opens the PowerPoint, the Power BI add-in uses the account information used in PowerPoint to load the report. If the user has access to the Power BI report through the web, it will also work in PowerPoint, and since PowerPoint is not adding anything to the report, row-level security also applies. We are just using a presentation instead of a browser, that’s all.
Conclusion
With this new feature, Power BI and PowerPoint can be integrated smoothly, allowing you to add interactive reports to traditional presentations. This powerful enhancement enables you to show comprehensive slides that visualise key areas, to analyse them, to describe them, and even to access the original data source from the same document, empowering you to deliver impactful presentations. If you’re interested in leveraging Power BI to boost your business, reach out to our team of certified experts and we’d be happy to help you!