
13 Jan 2022 Machine Learning in Manufacturing – A Look at OEE Forecasting
In this article we will run through a project to forecast Overall Equipment Effectiveness (OEE) using Machine Learning (ML), see some of the deliverables enabled by this technology, and also look at the interpretation of the model to better understand how it works and why we can trust its predictions.
Manufacturing has always been an innovative field, no doubt due to its extensive impact, along with its existence in a semi-controlled environment where new innovations can be easily monitored and their benefits measured; and thanks to the very nature of manufacturing, such improvements tend to become part of the process and are not pushed aside by future developments.
Given its history, it’s not surprising to see why manufacturing was one of the first sectors to subscribe to the ML idea of adding sensors to all the machines and storing data over the years.
In this article we will look at some of the advantages this initiative can lead to, looking specifically at a case where data from sensors on multiple machines was collected, indicating which product each machine was working on, at what time, and what stoppages took place.
We aim to provide a helpful analysis by forecasting one of the main metrics in manufacturing, OEE. Forecasting this not only enables us to make more informed decisions considering our future OEE, but also provides an excellent opportunity to look at some of the drivers behind this metric.
OEE
OEE has been a key concept in manufacturing for decades, defined as:
![]()
Where:
- A – Availability: equal to 1 when the machine is running throughout the allotted time.
- P – Performance: equal to 1 when the machine is producing at nominal performance.
- Q – Quality: equal to 1 when all the pieces generated are defect-free.
As we can see, this measure groups together three common reasons for losing efficiency (stoppages, low performance and reject pieces), so it is no wonder that it is a commonly applied standard in very different types of factories.
Resulting Dashboards
In this section we will review some of the final deliverables from the project.
If you want an in-depth review of the technical details of the implementation you should read our upcoming article “Implementing an AutoML pipeline for OEE forecasting”, where we not only explain the ML details of the project, but also how we used an “AutoML-like” approach, enabling the use and maintenance of the project by non-ML experts, using ML more as a tool than an end result, and thus democratising the use of Artificial Intelligence (AI).
These dashboards are tailored towards specific use cases; for example, for the factory manager we offer the following dashboard:
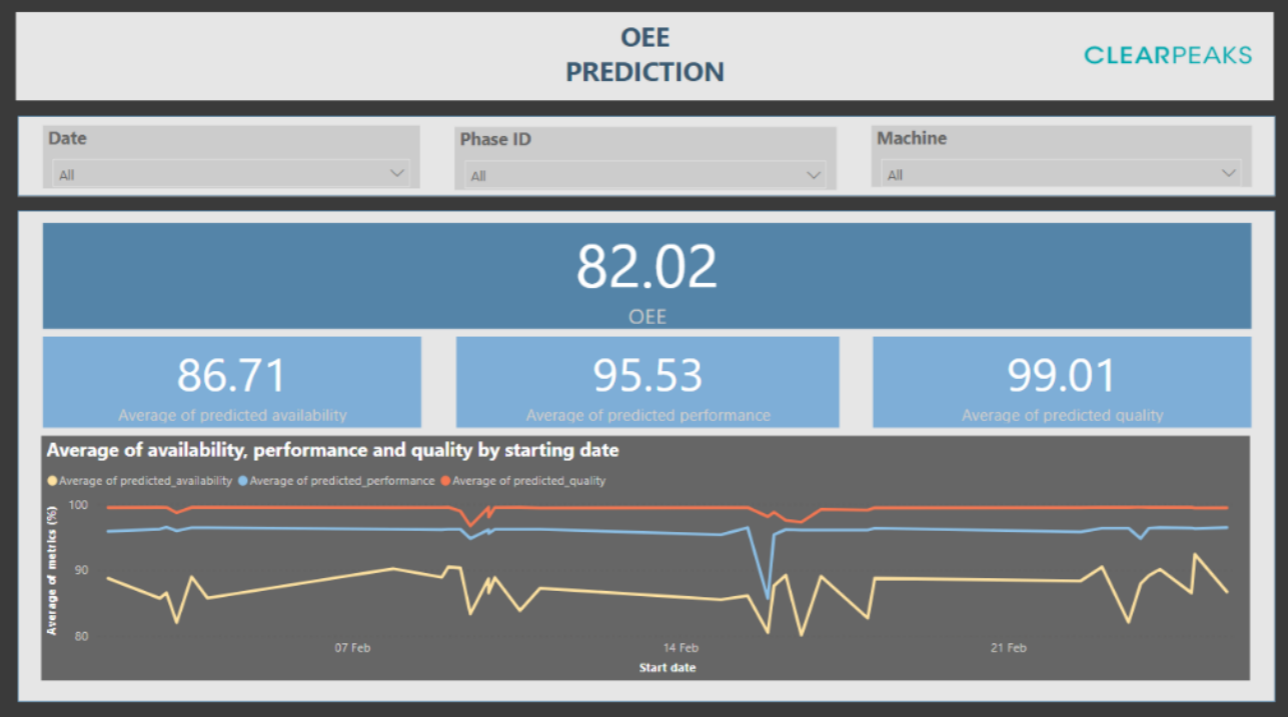
Figure 1: Dashboard showing predicted OEE for future periods.
This dashboard allows the manager to check the predicted OEE for periods in the future and adjust to future planned orders. It also enables them to predict low OEE days and apply corrective measures if possible.
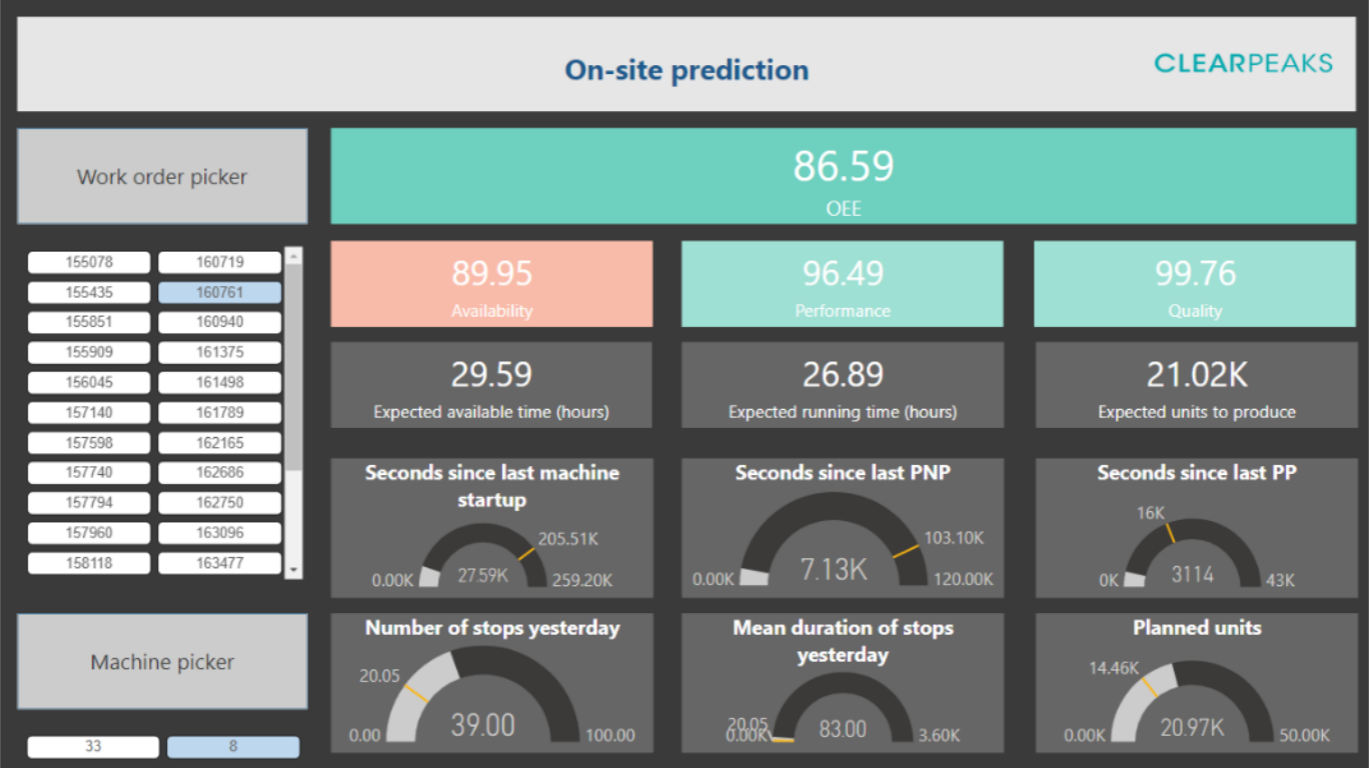
Figure 2: Dashboard just before starting a new production order.
Next, let’s take a brief look at a dashboard to be used by operators tasked with putting new orders into production. This dashboard is shown on the actual machine before starting production, so that we can check any last-minute alarms indicating that the order might have a very low OEE, because the machine sensors are reporting unusual values, the product to be manufactured is particularly tricky, or for any other reason.
These were some of the deliverables we implemented in the project, but a side-effect of using such a general measure as OEE is that the resulting dashboards also end up being very general. The solution is to now adapt the deliverables to your particular use case. For example, a factory producing a few high-value pieces might be interested in forecasting quality, while a factory making a lot of small pieces might be more interested in maximising availability by predicting stoppages and the actions to be taken to avoid them.
Why Does it Work?
Everyone wants their model to offer high accuracy, but that’s not always straightforward, especially if it’s not a model capable of explaining its decisions. Without a valid explanation, the model may be using some specific feature for classification purposes which is incorrect overall, but works for a particular sampling. A recent case can be seen in COVID-19 prediction models, some of which learned that patient reports written in a specific font meant that the patient in question was more likely to have COVID-19! (This was because some hospitals with a lot of positive cases used that font for their reports.)
So, with interpretability we can observe the reasons why the model is making its decisions, and we can even analyse these reasons in order to obtain some insights into the factors affecting production. In this specific case we searched for interesting rules that were able to describe our data:
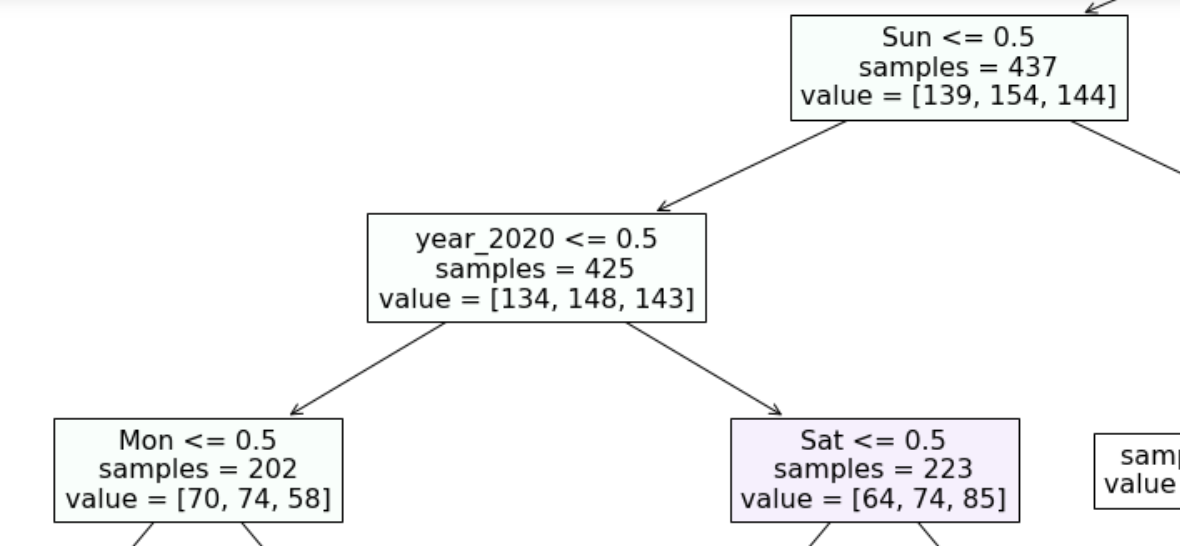
Figure 3: One of the rules found by the model; note that this is part of a bigger tree.
One of the interesting rules that the model found was that the first working day of the week was marked by lower availability on average. This might not have been obvious with the naïve approach of looking at the average availability per day:
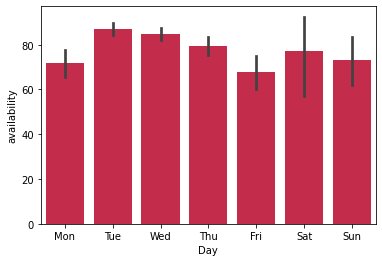
Figure 4: Availability per day.
We can see that Monday has roughly the same availability as Friday; but if we look at the rule extracted by the model, we can see that it is using Monday in data before 2019 and Sunday in data from 2020.
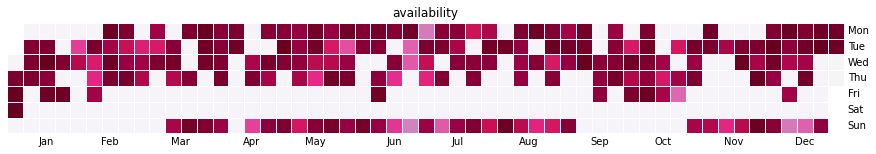


Figure 5: OEE per day during 2020.
If we plot the metrics through the year 2020 (Figure 5, above), we can indeed see that in 2020 the working week started on Sunday and ended on Friday, so we should redo our analysis of availability per day per year:
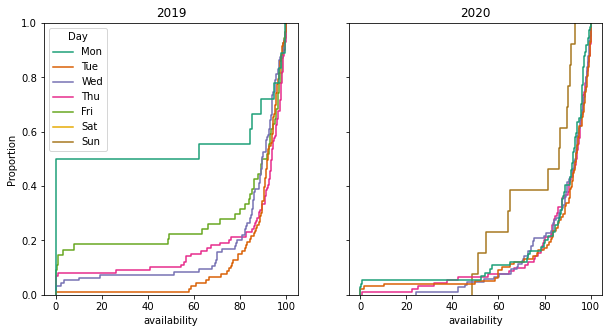
Figure 6: Proportion of availability data for 2019 and 2020.
In this graph we can clearly see the outliers: in 2019 almost 50% of the Mondays had <10 availability and while in 2020 it got better, we still have a clear outlier on Sundays, with a lot less availability.
Conclusions
In this article we have looked at some wide applications for OEE prediction, the possibilities it offers and which use cases could benefit from it. We have also examined some of the rules and interpretations found and used by the model, in order both to ensure that the model’s reasoning is sound and to provide information about the process to operators.
For more details and interesting cases like this please don’t hesitate to contact us. If you have enjoyed what you read here, have a look at the ClearPeaks blog section and consider subscribing to our newsletter!