10 Jun 2020 Mapping Data Flows in Azure Data Factory
Recently, one of our customers requested a solution to implement a traditional ETL pipeline for their data using Microsoft Azure services. In this article, we will walk you through the data transformation part of the ETL in this project using Azure Data Factory’s new service, Mapping Data Flows; we will also compare it with other transformation engines such as Azure Databricks and SQL Server Integration Services. For the purpose of this blog post we adapted this use case to the Covid-19 situation using the publicly available datasets.
General overview of Mapping Data Flows
At the end of last year, Microsoft Azure released a new feature of Data Factory called Mapping Data Flows. For anyone interested in learning about other Azure Data Factory functionalities in detail, check out our article on the topic.
![]()
Figure 1: Mapping Data Flows logo
These data flows are visually designed data transformations with no coding required. They simplify data processing with built-in capabilities to handle unpredictable data schemas and to maintain flexibility for changing input data.
They are executed as activities in Azure Data Factory pipelines so that they can use the already existing Control Flow capabilities, such as scheduling and monitoring.
Data Flow activities run on Apache Spark clusters for scaled-out data processing, which enables interactive debugging, data previews and pipeline debug executions.
Azure Integration Runtime and Data Flow strategies
We can set our Apache Spark cluster by choosing a custom Azure Integration Runtime (IR), where we can specify the size and the number of workers, depending on the size of our dataset. By default, we are given a small 4-core single worker node cluster with a 60-minute lifetime, which will allow us to preview data and debug pipelines quickly; we can increase the cluster size by creating an Azure IR with larger configurations manually.
In order to start it up, we must turn on the Data Flow Debug switch for data flows at the top of the browser. When we are done with the debugging, we should switch it off in order to terminate the cluster and no longer be billed.
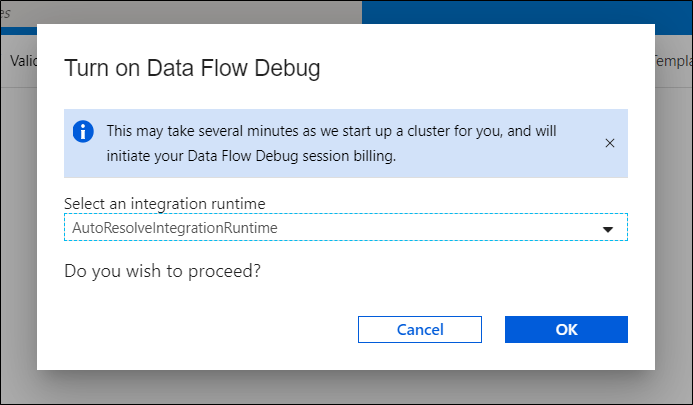
Figure 2: Turning on the Data Flow Debug switch
There are several ways of executing data flows. If we want to execute them in a pipeline in parallel, Azure Data Factory will spin up separate clusters for each activity execution. In consequence, the execution will take the least amount of time but the order of events will be non-deterministic, so it only makes sense for independent flows.
On the other hand, if we want to execute a single data flow, the execution should be done on a single Spark cluster instance. However, for complex flows, this option is harder to troubleshoot and it is not very reusable because all the different logic and rules are gathered in the same flow.
Lastly, we could place several flows sequentially and receive a new Spark context for each execution. This option takes the most time to execute but it provides a separation in each data flow step.
1. Creating a simple Data Flow
In order to create a new data flow, we must go to Azure Data Factory and in the left panel select + Data Flow. The following view will appear:
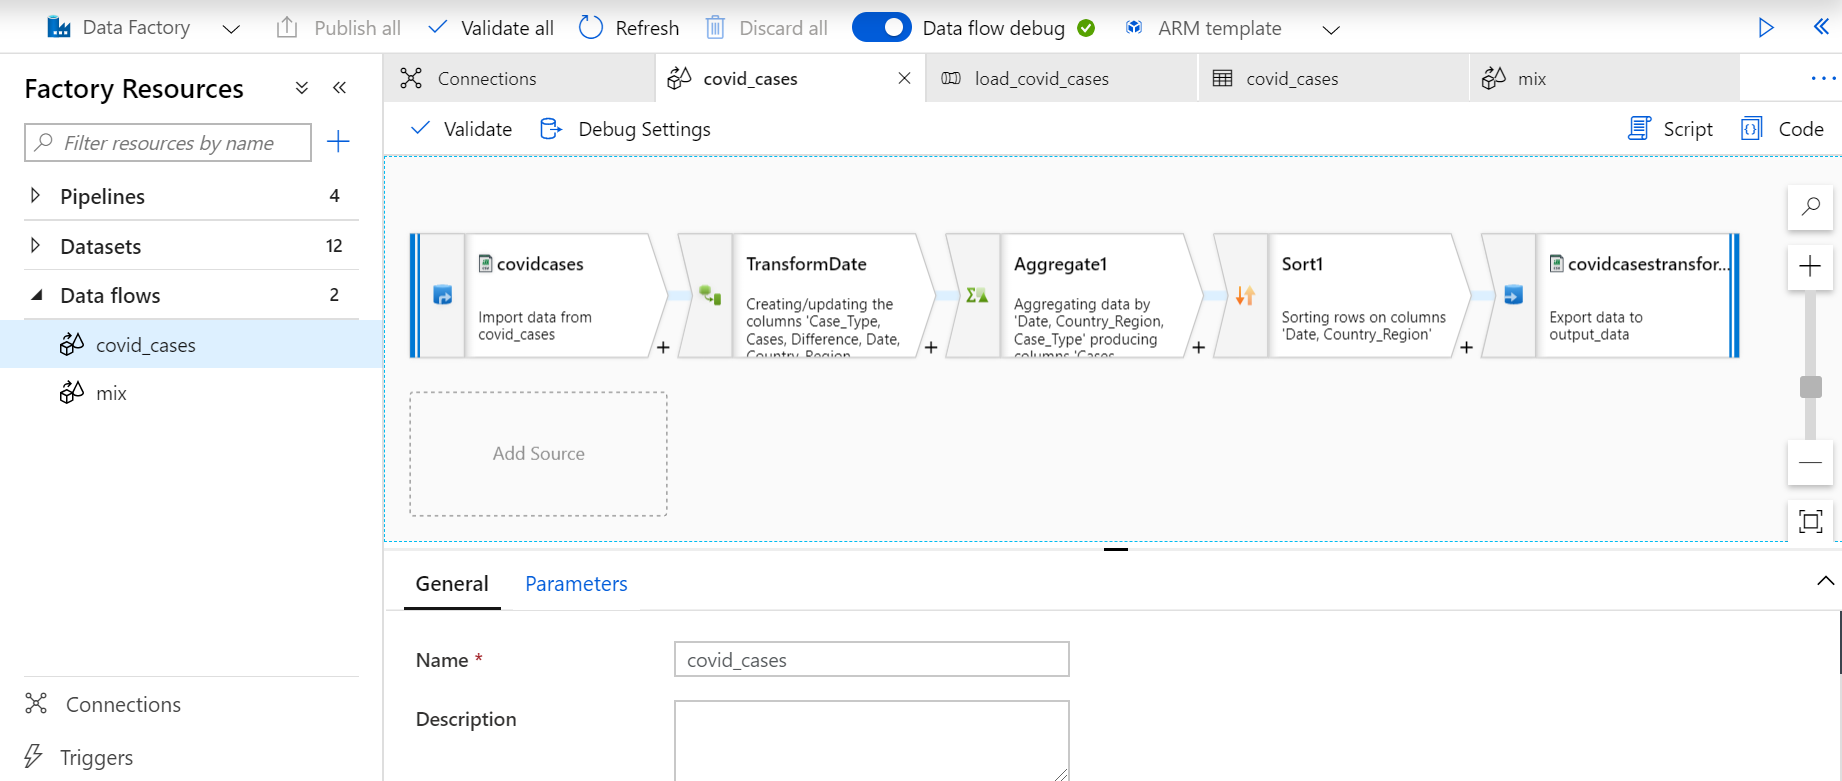
Figure 3: Mapping Data Flows overview
This is where we create and edit the data flows, consisting of the graph panel, the configuration panel and the top bar. Remember that the Data Flow debug switch should be turned on in order for the cluster to be running. The graph panel displays the transformation from the source data to one or more sinks.
To add a new source, select Add Source. The source and the sink each need to be connected to a dataset that created on Azure Data Factory, containing the physical properties of the data source. Currently, there are only a few available source/sink connectors which include Blob Storage, Data Lake Storage Gen 1 & 2, Synapse Analytics, SQL Database and Cosmos DB. To include data from other resources, we should use a Copy Activity in Data Factory to load the data into a supported staging dataset.
To add a new transformation, represented as a box in the flow, select the plus sign on the lower right of an existing transformation.
2. Data Flow configuration
2.1. Configuring the transformations
Every transformation step in the graph can be configured in the configuration pane, where each has a minimum of the following tabs:
- Transformation settings: here we see the specific settings for that transformation. In the case of source or sink transformations, we have the option to switch on the Allow schema drift option that is used to handle changes in our metadata.
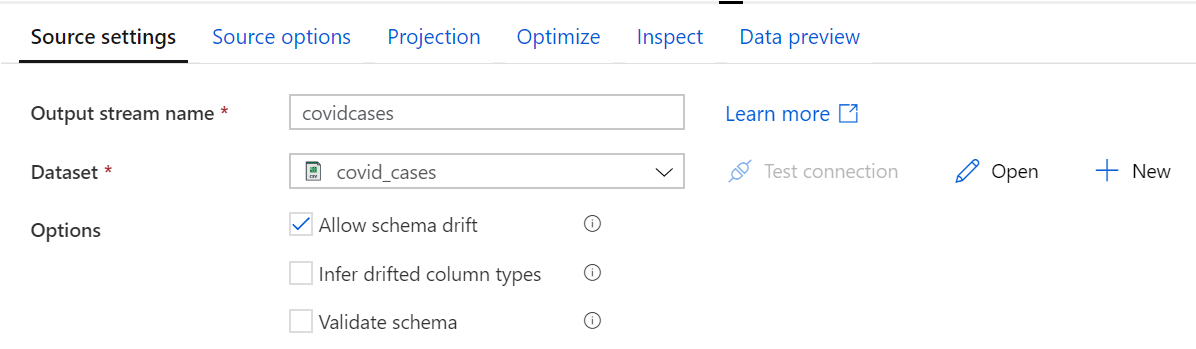
Figure 4: Transformation tab in the configuration panel
- Optimize: in this tab we can choose the partitioning scheme of the source data, if any, which includes Round Robin, Hash, Dynamic Range, Fixed Range and Key.
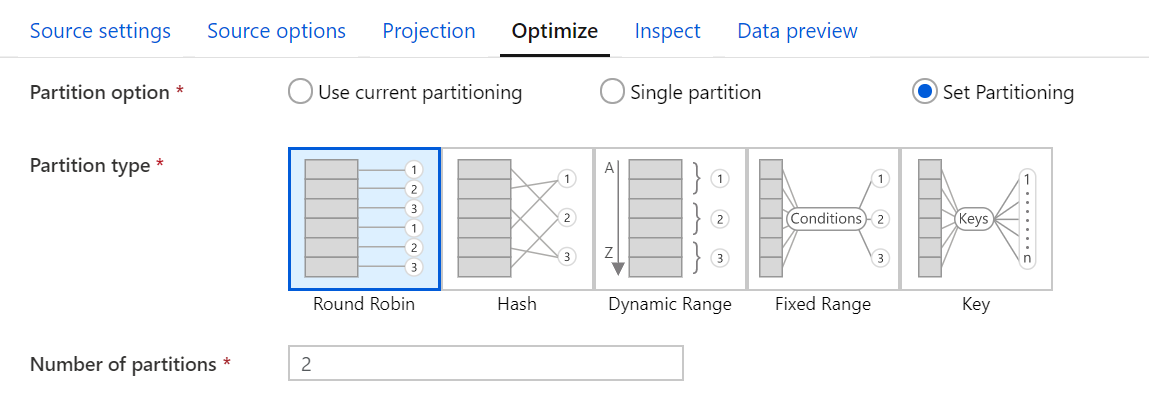
Figure 5: Optimize tab in the configuration panel
- Inspect: provides a view into the metadata of the data that we are transforming, such as the column counts, the columns changed or the data types. We don’t need to have the debug mode enabled to use it.
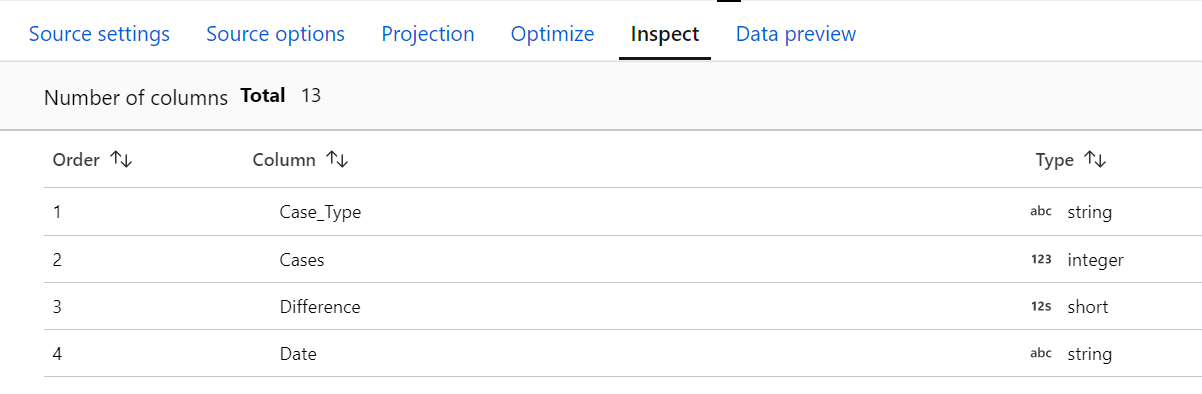
Figure 6: Inspect tab in the configuration panel
- Data preview: a powerful tool that enables us to have an interactive snapshot of the data at each transformation once the debug mode is on.
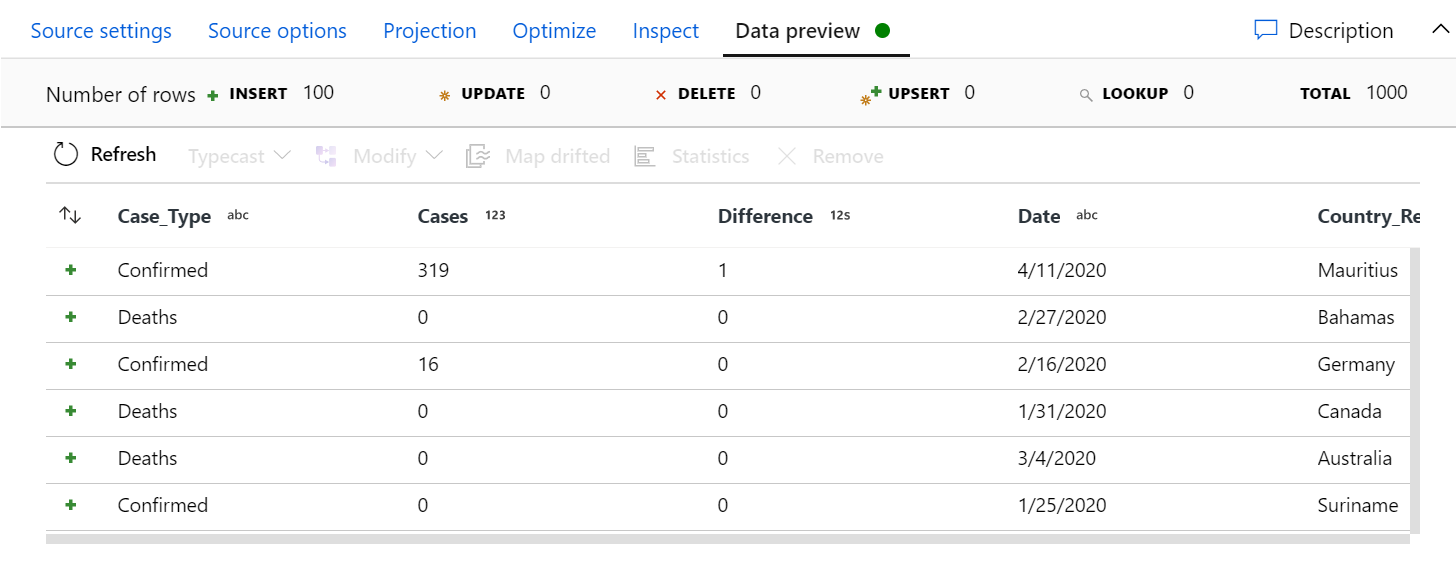
Figure 7: Data preview tab in the configuration panel
2.2. Available Transformations
At the moment, Mapping Data Flows offers the following built-in data transformations:
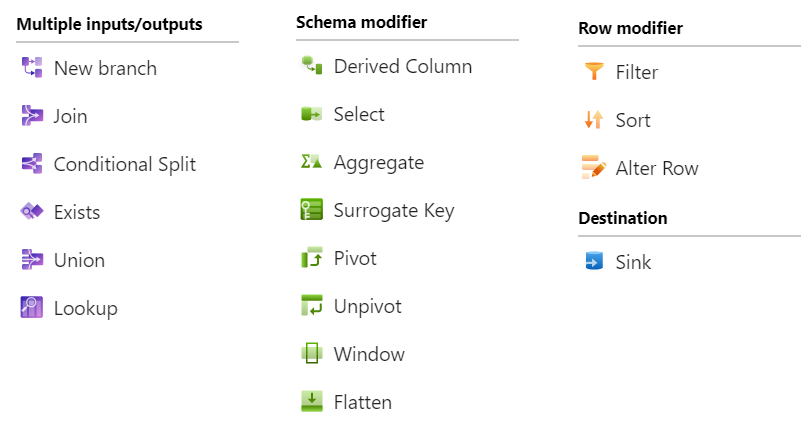
Figure 8: Available built-in transformations
- Source: defines the data coming into the data flow.
- New Branch: duplicates the data from any stage in the data flow; useful for self-joins and for operating on the same data with different transformation requirements.
- Join: the SQL JOIN equivalent, where any incoming data is joined with any other block in your data flow.
- Conditional Split: splits data into separate branches based on conditions; mostly used when sinking data to different locations or different stores.
- Exists: the SQL EXISTS equivalent, which checks the existence of a value in another branch in your data flow.
- Union: combines data from multiple tables based on column name or column position.
- Lookup: looks for data based on the column name or column position.
- Derived Column: the most-used transformation, where rows can be transformed or modified to generate new columns and new column values.
- Select: used to maintain specific columns or remove duplicates, which is common after joins and lookups.
- Aggregate: aggregates data based on the aggregate functions we choose in the expression language.
- Surrogate Key: an auto-generated incrementing key to use as a surrogate key in your data.
- Pivot: pivots row values into new columns.
- Unpivot: un-groups pivoted columns, producing a multiple-row output.
- Window: aggregates data across windows of data partitions; mostly used for ranking data and generating sequential row number values.
- Filter: filters rows, the SQL WHERE equivalent.
- Sort: the SQL ORDER BY equivalent, useful for data exploration and validation but reduces the effectiveness of data partitioning.
- Alter Row: used to define expression filter conditions to update our database with actions such as delete, update, insert and upsert.
- Sink: defines properties for landing our transformed data in the destination data store.
In many transformations such as Derived Column and Filter, it is necessary to define properties with manually entered expressions on the Visual Expression Builder panel. These expressions are composed of column values, parameters, functions, operators and literals that evaluate to a Spark data type.
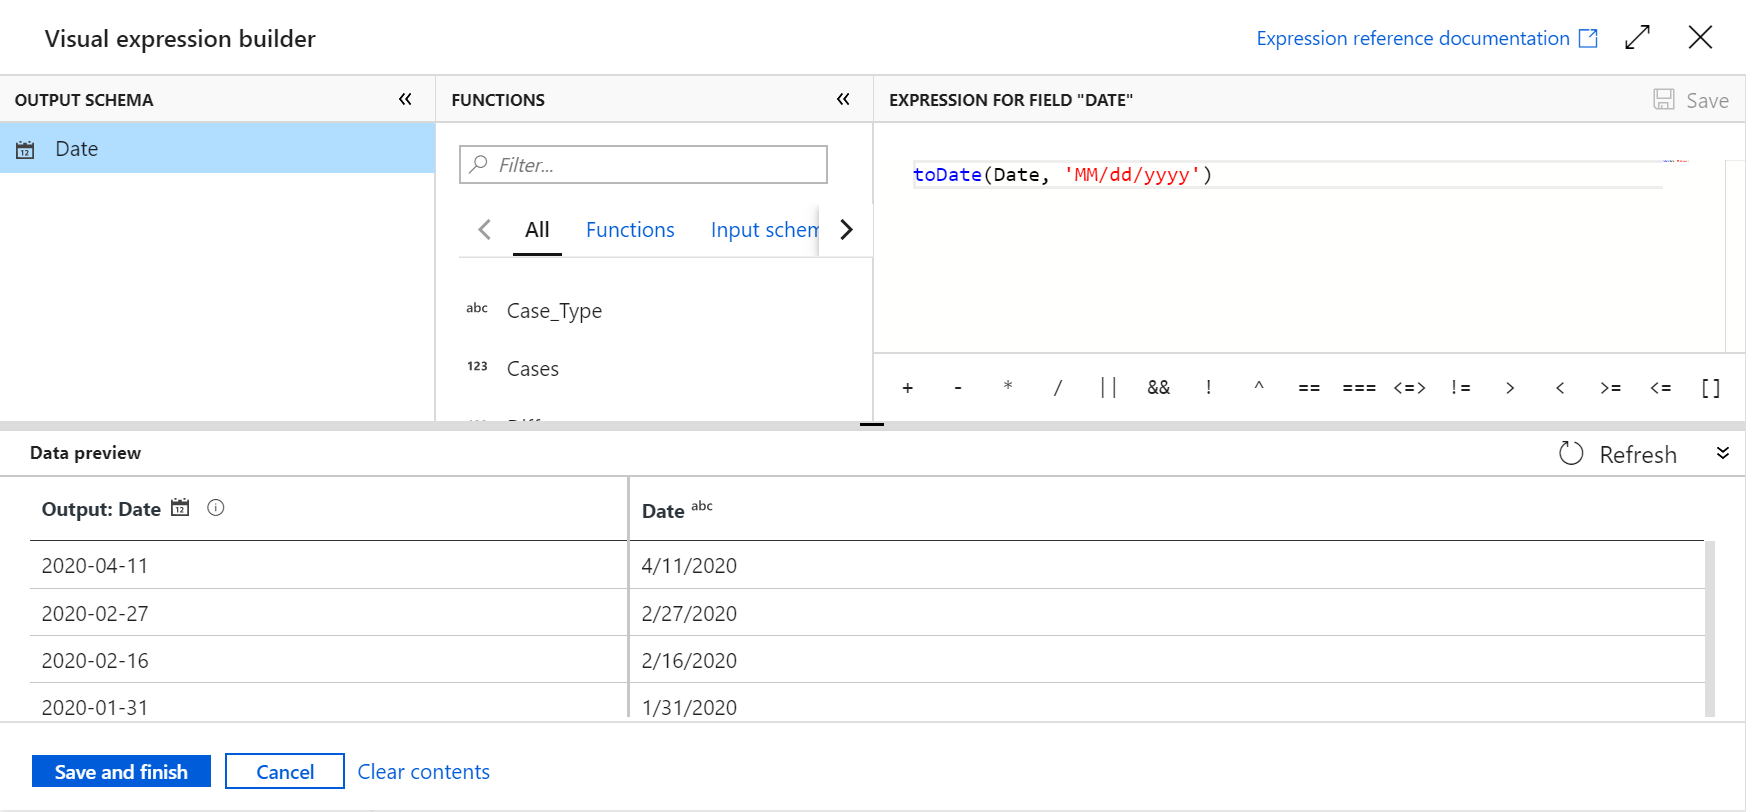
Figure 9: Visual Expression Builder
3. Mapping Data Flows vs Databricks
We thought it would be interesting to compare Azure Data Flows to a similar data transformation technology that we’ve already worked with: Azure Databricks.
Databricks is a Spark-based analytics platform that is a fully integrated Microsoft service in Azure. The code is written in notebooks that support Python, Scala, R and SQL. Storage and compute are separate, so we can turn off the compute cluster when we are not using it but keep our data stored.
For the sake of this comparison, we built the same ETL in both technologies. Overall, we did not find any big obstacles that we could not overcome using either Data Flows or Databricks. Implementing the ETL using Data Flows was an easy and intuitive drag-and-drop experience. Nevertheless, we would like to point out that anyone using this tool needs to understand the logic behind the basic ETL concepts.
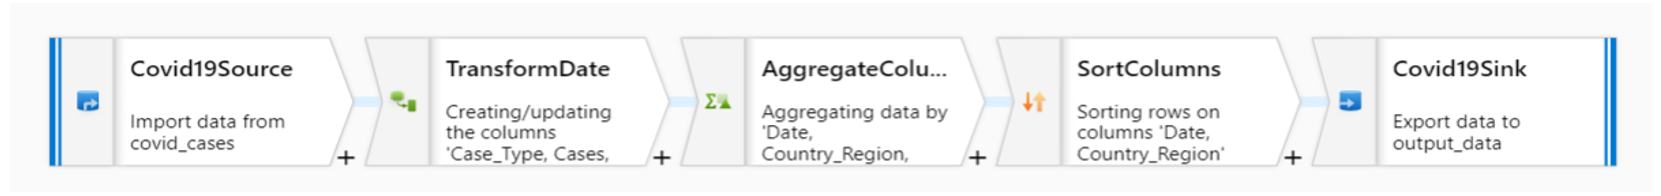
Figure 10: Simple example of data flow in Mapping Data Flows
![]()
Figure 11: Simple example of data transformation in Databricks
The most significant findings:
- Connecting to a storage is straightforward and fast in Data Flows, whereas Databricks requires an additional step that consists of mounting the storage in the service.
- In Data Flows, data transformation is done by using built-in transformations without needing to code; in Databricks, we need to code each transformation in a notebook that supports SQL, R, Python and Scala.
- Comparing simple flows, Data Flow shows a nice, attractive view that simplifies our task when previewing data at each step; it is also more agile than Databricks.
- When comparing more complex flows, Data Flows starts to look a bit messy and becomes tedious to work with; moreover, it is difficult to maintain and to track changes. In Databricks, however, we do not have the impression that it becomes messier when complexity mounts.
- Some simple transformations such as join and select could be merged and improved in Data Flows to avoid having too many steps. In Databricks, it is faster to develop complex transformations.
In conclusion, we can say that both Microsoft Azure services are able to perform similar data transformations, even though Databricks has additional features such as supporting stream processing.
Both services can be combined in an Azure Data Factory activity, where Data Flows could manage simple transformations and Databricks more complex ones.
The resulting ETL could look something like this:
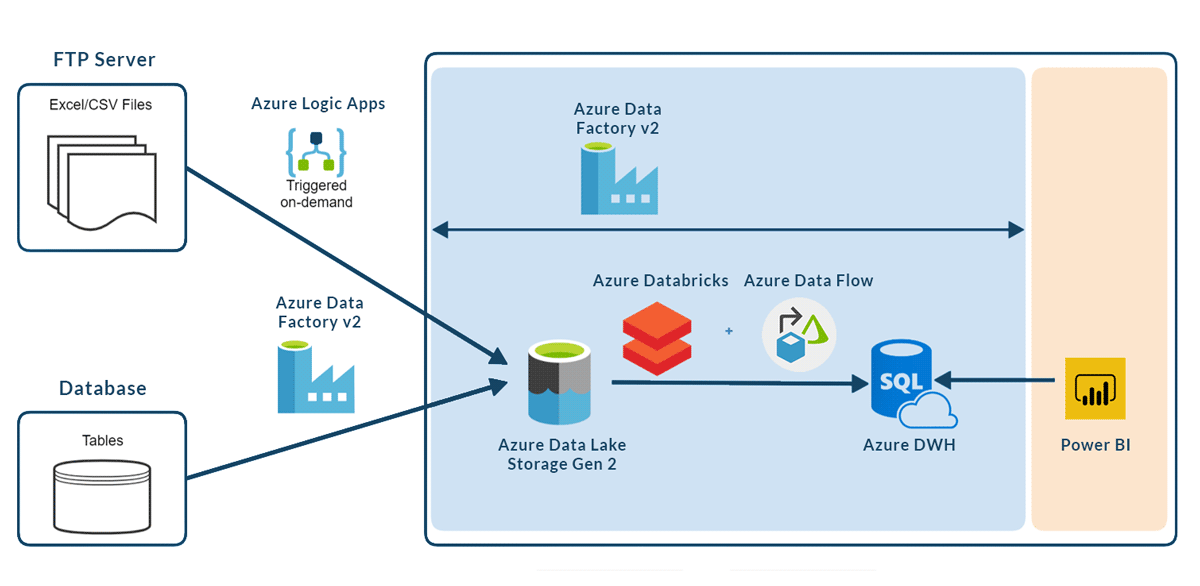
Figure 12: Common ETL architecture that combines Databricks and Data Flows in the data transformation part
4. Mapping Data Flows vs SSIS
For anyone with a SQL Server Integration Services background, Mapping Data Flows is similar to the Data Flow tab of the SSIS Designer, which enables us to create data flows in an Integration Service package. In the same way, the Control Flow tab is the equivalent of the Azure Data Factory pipelines.
Even though SSIS Data Flows and Azure Mapping Data Flows share most of their functionalities, the latter has exciting new features, like Schema Drift, Derived Column Patterns, Upsert and Debug Mode.
To discover more about Azure Data Factory and SQL Server Integration Services, check out the article we wrote about it.
Conclusion
To sum up, Mapping Data Flows is an easy drag-and-drop tool for any organization looking to build simple data pipelines in a faster and easier way. It enables data cleansing and preparation without worrying about managing and maintaining server clusters or writing code in a user-friendly visual environment.
The built-in transformations that perform common actions such as join, aggregate and sort simplify the data transformation process; they can be customized too, using the Expression Builder.
Finally, as we build the graphs, we can validate them in real time using the data preview capability and we can debug the end-to-end process using the interactive debugging.
We hope this article helps you understand how to implement ETLs for your enterprise in an easy way. In ClearPeaks we have a team of Big Data consultants who have implemented many use cases for different industries using this service. If you want to use Mapping Data Flows or any other of the data transformation engines available on Azure in your company but don’t know how, contact us and we’ll be ready and willing to help you. Stay tuned for future posts!