07 Dec 2014 OBIEE 11g tuning and performance monitoring
OBIEE 11g tuning and performance monitoring is often an overlooked yet very important activity after an OBIEE 11g solution has been deployed. For your BI project to be successful is not enough to deliver clear and accurate information. You also have to deliver it fast. Understanding the working mechanisms of OBIEE and its relationship with the Fusion MiddleWare components (FMW) is key to tune your system to get maximum performance out of your existing hardware. In this article I want to approach the OBIEE performance and tuning process by addressing the most important points that you should review in your current project. We will then have a look to how you can monitor day-to-day activities using the available performance tools that will allow you to identify performance issues and take corrective actions. The content of this article is not by any means an extensive guide with all the answers, as something like that is away of the scope of a blog article, but I hope this information will be enough to put the interested reader in the right mindset to start improving and monitoring their OBIEE environments. Why is it slow? Usually the performance problems in an OBIEE environment are first detected because users complain that the application reporting is too slow, or at least slower than before. In this situation, as administrator of the system, you should not guess about what might be the reason. Your experience will be a great asset for you to quickly determine the most probable cause of the problem, but it’s important to test empirically your assumptions. There are four broad areas where the culprit might be.
- OBIEE layer
- Database layer
- Hardware layer
- Network layer
Let’s assume that you are a new administrator to the system and therefore you don’t have any clue on where the problem for this particular case might be. In this case you should follow a formal process to check all the areas until you find the root cause and fix it. This scenario is differs from the one where you might not have any particular complaint from the users but as a proactive measure you are continuously trying to improve your system performance against a preexisting baseline. In this case we would be talking about of optimizing the system. More about this later. So, let’s start by surveying the above four areas to see what are the most likely places where things can go sour.
Improving Performance
OBIEE & Database Layer
If your environment is stable, meaning that these performance complaints are not happening often, chances are that the culprit for this problem is within the OBIEE boundaries. These are some of the operations to try in the same order as below.
1. Reproduce the problem
The first thing to do is to reproduce the scenario to confirm that the performance issue report is accurate. It is important to reproduce it at the same time as reported and also at different times through the day to discard (or confirm) that the resources accessed by that report have some sort of bottleneck access at specific time frames. Also is important to replicate the scenario with the same user who reported the problem and with another users. You can achieve that thanks to the impersonation feature of OBIEE. What we are looking here is for identity filters (row level security) applied to this user that might be causing a bad query generation. These two easy test will give you a better idea of when and for who the problem exist.
2. Check the database query
Once you confirm the problem, the next step is to get the physical query that the report is sending to the back end databases. In the case that we are talking about a dashboard page, you’ll have to go analysis by analysis, though almost always is visually evident which analysis is taking most time, so you can prioritize your efforts. To get the physical queries you’ll need to check the logs (nqquery.log) assuming that your system is configured with a LOGLEVEL of at least 2. If this is not the case and you are in a hurry, you can grab the logical query of the report from the advance tab on the answers editor and then execute the query through the “Issue logical query” from the administration page. In here you can select the log level that you want to apply for that particular query (and don’t forget to un-check the use BI Presentation cache!) Once you have the physical query, if you have a database access you can start your normal query tuning process, like checking explain plans, Tk*Prof, missing indexes, etc…
3. Review your RPD model
As a result of the previous step you might conclude that there is something funny going on with the query generator. This might be for example the inclusion of an extra fact table that explodes the granularity level of the intended analysis resulting on many more rows of the necessary being fetched from the DB and then aggregated by BI server, resulting on the right results but delivered using a costly strategy. In this regard make sure that you follow desirable practices like using aggregate tables, defining properly the content level of your logical table sources and using properly the vertical and horizontal fragmentation. Remember that if you are on OBIEE 11.1.1.7+ you can use the “Check Logical Model” feature that will give you hints about these things. You can execute it for individual business models to save some time. 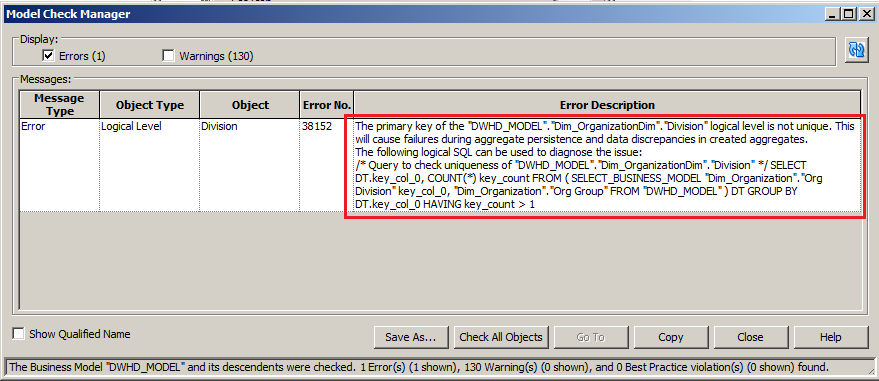
4. Review your OBIEE configuration
If everything is looking ok, still is worth to check some of the OBIEE configurations that might give you some troubles over the time, basically the connection pool configuration and the cache settings. Regarding the OBIEE connection pool configuration, you should double check that your RPD has dedicated connection pools for variable initialization blocks. This is quite important as it will save connection slots for your other data connection pools. For those connection pools it is good to revisit the maximum connections from time to time as your user base grows over time. The rule of thumb says that you can derive a baseline figure for your connection pool by multiplying the average concurrent users of your environment by the average physical queries of your dashboard pages. So for example, let’s imagine that your dashboards have an average of 5 analysis per page, and each analysis executes one logical query that turns into two physical queries (due to federated sources, for example). Assuming a number of 20 concurrent users your maximum connection pool value for could be 20 * 5 * 2 = 200. The consequence of having fewer number of connections will result on a higher physical queries response times. 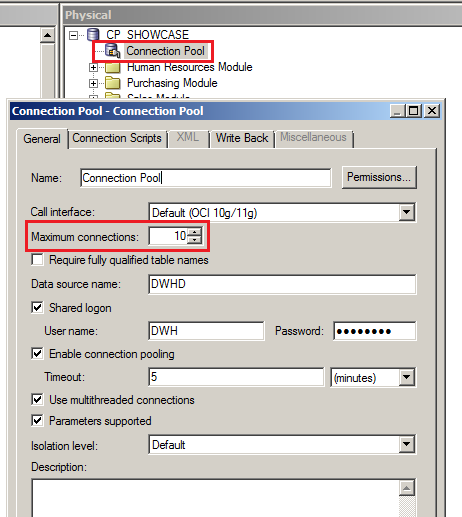
Hardware and Network Layer
Either as discarding OBIEE as the root cause of the problem or as a side effect of it, you should check that the available hardware is enough for the demands of the OBIEE application. This should have been assessed during the infrastructure sizing phase, but as your environment grows in users and complexity is usually a good idea to have a look to make sure that it stills holds on.
Memory
The memory of the system is going to be used basically for the server’s JVM and also for the OBIEE components such the BI Server or the Presentation Server. Depending on the total memory of your system, you can configure the JVM parameters to try to get the most of your memory. We will see how to do this in the next section. When the system runs out of memory, it will start moving the pages to disk, causing performance problems. The easiest way to check if you still have enough free memory is to execute a top and check that the free + cached is still enough to avoid pagination. 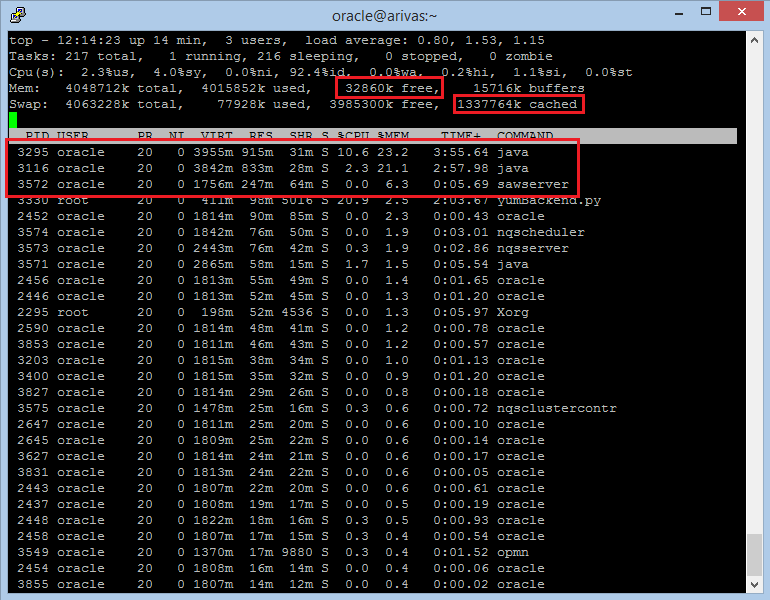 As you can see in the above screenshot, the both Java processes are the two JVM machines (Admin server and Managed server bi_server1, while the sawserver is the process for the presentation server). One way to make sure if your system is doing heavy use of pagination is to use the vmstat command and check for the swap in and out parameters.
 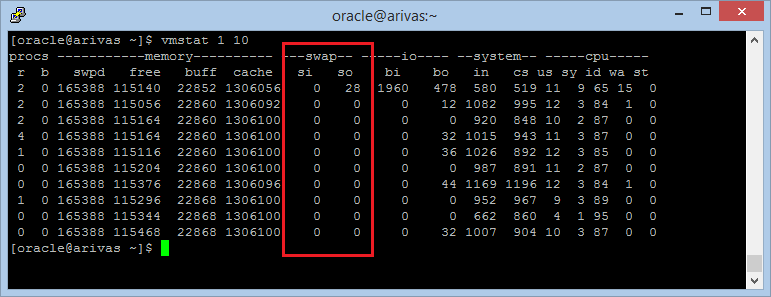 If these two are close to 0 values means that so far you still have some memory to use.
CPU
Normally the CPU consumption for an OBIEE environment should be pretty low. If you see your consolidated CPU cores working at >95% then probably the system is trying to page out to disk as a result of insufficient memory. You can check again using the Top command that will default order the process by CPU consumption and look for the processes that are using the most of your CPU cores. Another documented reason for abnormal CPU consumption are faulty devices. It might be worthy to check the output of the dmesg command and forward it to your systems team if you find repeating messages about faults on some devices.
Network
Often overlooked, your problem might be within the network layer itself. At the end, no matter how fast your database or server is behaving if the network can’t transmit those results fast enough to the users. As with the CPUs the network interfaces should be quite relaxed, so one quick check is to run some network monitor program, like iftop to check what processes are using the most of the network interfaces. 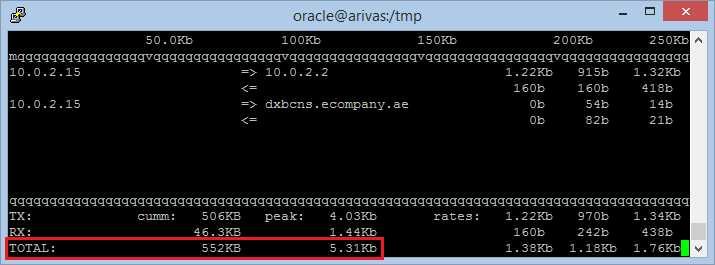 Also you can use IPTraf to monitor a particular network interface to see if the total traffic is the expected one. In this case we can’t see information about the individual connections but we have more statistics about the traffic that goes across the interface.
 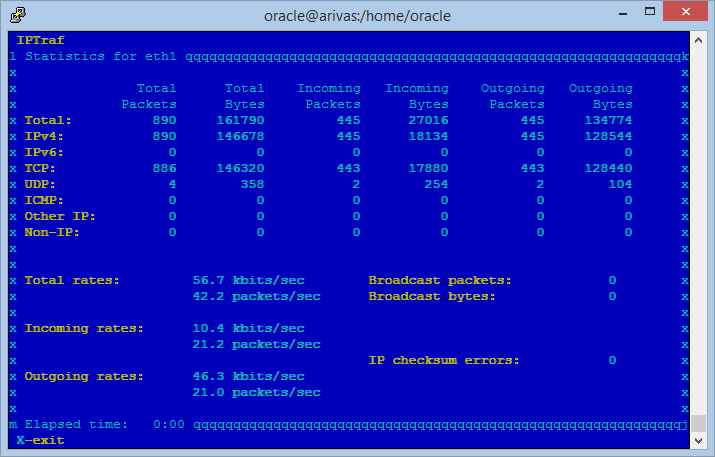 So hopefully after reviewing the above areas you’ll have identified the root cause of your problem and eventually fix it. While this is a good approach that allow you to react to specific complaints or issues from your users, you should embark into the perilous journey of continuous tuning and improvement of your system.
OBIEE tuning, review areas
Oracle maintains updated a document that lists and describes all the parameters that affect the performance of OBIEE across five different areas:
- Operative System Parameters
- Weblogic server
- JVM (oracle, sun or IBM)
- HTTP Server
- Web browser
- Database
You’ll find all the information in the document (Doc ID 1333049.1). You need a valid oracle account to access this document. The latest version available at the time of this writing is January 2014. Of course, you should have a look at the above document, but when talking about performance and tuning, I like to follow the saying “If it ain’t broke, don´t fix it”. Keep in mind that when experimenting when these parameters, you should always test the changes and follow their impact closely after the change. So in my opinion you should play with the below settings just if you are experiencing some sort of performance issue. Below you’ll find an extract of the Oracle Tuning guide with the parameters that in my opinion might yield have the most impact.
Operating System Parameters – Linux
[table id=4 /] There are OS settings for other systems such Windows, AIX or Solaris. Refer to the Oracle Tuning Guide mentioned above for a complete list of OS and their suggested parameters.
Weblogic Server
There are many different areas that might require a review when tuning the Weblogic Server. However, we found that one that yields quick performance improvements (for large OBIEE implementations) is to tune the maximum connections for JDBC data sources. We found this especially important if you are heavily using BI Publisher. Note however that increasing the maximum connection pool setting will impact directly the corresponding database layers of each data source, so make sure that you have enough resources in your database tier. [table id=3 /] You should determine the optimum capacity in your pre-production environment and once the results are good, change also the initial capacity equal to the value of the maximum capacity. In addition to that, if your environment requires more than average long running sessions (because of long running complex reports) it might be a good idea to increase the stuck thread configuration. A thread that has been working for more than Stuck Thread Max Time will be tagged as Stuck Thread by the WebLogic server. If the server gets too many Stuck Threads it will transition to critical status. So it might be better to increase this threshold to avoid (legit) long running threads to be considered Stuck. The recommended values by Oracle are: [table id=2 /] To modify these values use the Weblogic Administration Console and go to the Tuning section of your managed and admin servers. 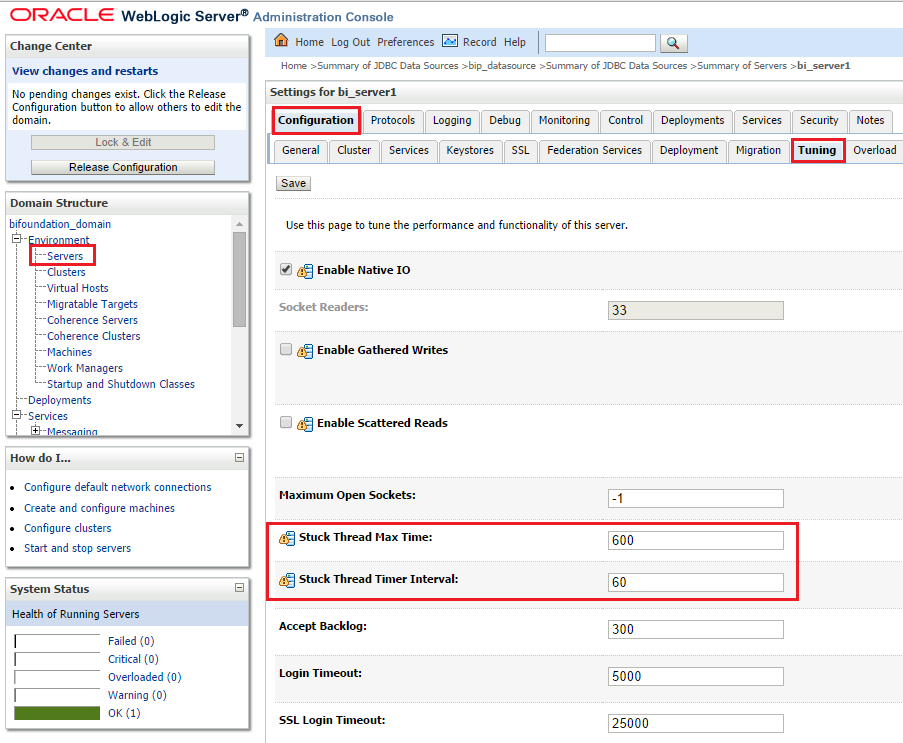
Java Virtual Machines (Sun – 64 bits)
This is one of the first things that we do for a new enterprise OBIEE installation. Depending of the memory available on the server is important to increase the amount of available memory to JVMs that the WebLogic servers will use. By default, the OBIEE configuration for 64 Sun JVM will allocate a minimum heap of 256MB and a maximum heap of 1024MB. If you have a server with enough memory, you should allocate 4096MB both as minimum and maximum heap size. As per the tuning guide: [table id=1 /] To change this Java arguments modify the file: $MWHOME/user_projects/domains/<your_bi_domain>/bin/setOBIDomainEnv.sh And make sure that you modify the arguments under your JVM vendor and bit word size.
echo "SVR_GRP = ${SVR_GRP}" if [ "${SVR_GRP}" = "obi" ] ; then if [ "${JAVA_VENDOR}" = "Sun" ] ; then if [ "${JAVA_USE_64BIT}" = "true" ] ; then SERVER_MEM_ARGS="-Xms4096m -Xmx4096m -XX:MaxPermSize=512m" export SERVER_MEM_ARGS fi if [ "${JAVA_VENDOR}" = "Oracle" ] ; then if [ "${JAVA_USE_64BIT}" = "true" ] ; then SERVER_MEM_ARGS="-Xms256m -Xmx2048m" export SERVER_MEM_ARGS else ...Increasing these values will result on a higher memory consumption right away, but it will get rid of any out-of-memory errors that your JVMs might have. So in general it’s a good idea to increase these values if your server has a good amount of memory, like 16+ GB.
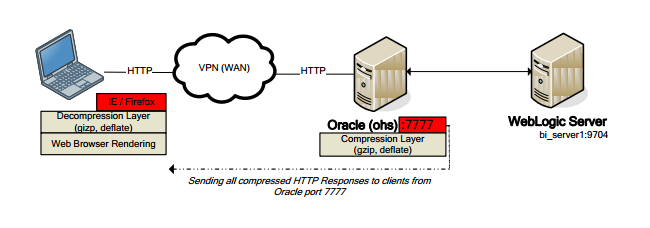
HTTP server compression/caching
If you are using a HTTP server such as OHS (Oracle HTTP server), IIS or Apache, you might want to enable the http compression settings. The basic idea behind this is that the contents (data, images, http code…) that the WebLogic server has to send to the users will be first compressed by OHS prior to sending and then de-compressed by the web browser of the user. To enable this feature you need to do some modifications to the http.conf file in the OHS installation. For detailed instructions for both OHS and ISS please refer to the Oracle tuning guide mentioned at the beginning of the section.
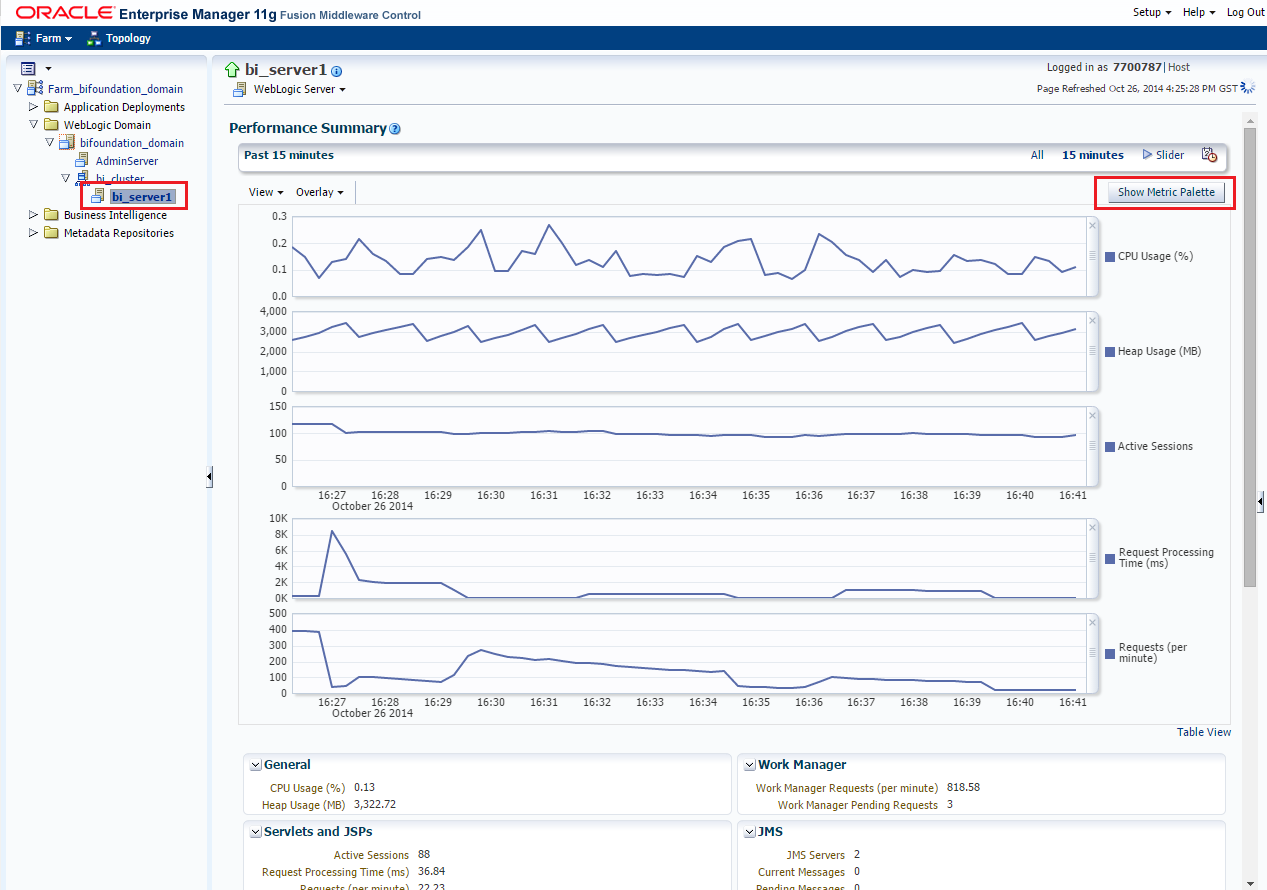
Performance monitoring of WebLogic/OBIEE
All the changes described above should be applied one at a time and in a very controlled way. As a matter of fact, you need to monitor the performance and the stability of your system after any change. There are many ways to monitor OBIEE performance, but normally you will use a combination of log files and built in monitoring tools available in Enterprise Manager like the Performance Summary monitor. To access this tool you have to log in to the Enterprise Manager and right click your bi_serverX under the WebLogic domain section. Once you are there, some metrics will be selected by default but you should go straight ahead to the Metric Selector to spice things a little bit.
The combination that I should use normally to have an eye to the performance and stability of the system is the following:
CPU Usage (%)
It should be pretty low at all times, but if you see spikes or a continuous high usage of the CPU is a good idea to go to your OS and check what is going on.
Heap Usage (%)
This metric is useful to check that we are not running out of memory on our JVMs. If you see that the heap usage is touching your maximum heap consistently this is an indicator that you should increase the memory of the JVM you still have memory available in your system. If you don’t have, you might think about scaling out your environment horizontally.
Active Sessions
The active sessions is there to provide context for the rest of the metrics. As the number of sessions goes up, you should expect more utilization of the whole system
Request Processing (ms)
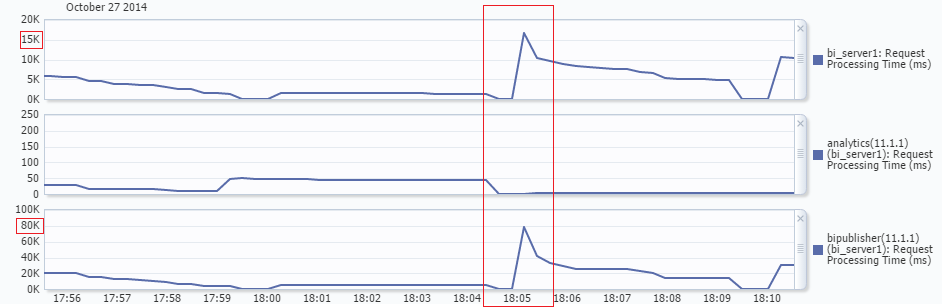
This is an interesting metric that gives an overall idea of how good is the performance of your environment. As per my experience, I have noticed that when users complains about the system being “slow” this metric is usually pretty high, the order of several thousand ms. It’s important here to notice that this metric is averaged for all the applications deployed in that server, and this might be misleading. For example, you might have your analytics working smoothly under <100 ms but maybe some crazy BI Publisher reports going on and generating thousand pages PDF files. In this case, you response time for BI Publisher will be way higher than for analytics, but the average of both will still be quite low, at least nothing that will turn your head. My recommendation in environments where there are more than one application used heavily is to add the response time metric of each application (or at least have a look at the table available below the graphs).
If your analytics application is consistently having a very high response time (>1000ms) you should check if there long queries running by checking the Manage Sessions link in the administration section of OBIEE. If this is the case, you can cancel the queries from there. In any case, stopping and starting the application from the deployments section of the WebLogic console will usually solve the problem, but this should be considered as your last resort because it will end the sessions and running reports of your users.
Request (per minute)
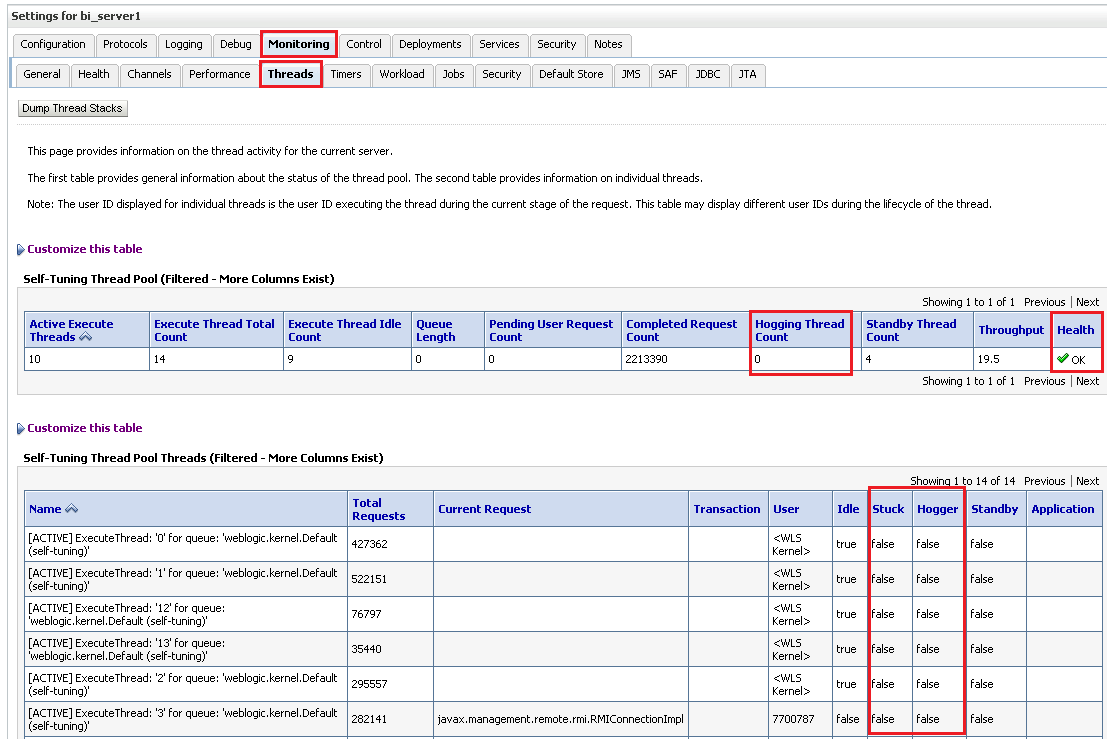
The request per minute is somehow related to the processing time. Basically when the response time is high, the number of requests per minute will decrease as the system will be able to process less request in the same time. What we are looking here is for high values. A sudden plunge on this metric normally is associated with a higher system load at that particular time. If it does not recover, will mean a performance decrease. For this metric we should also do the same as for the Processing Time above, and in case of having not only analytics application running in our server, add the related target based metrics for each application. In addition to the performance summary monitor it can be useful in some case to check the status of the server threads. All the work that is processed by the WebLogic server is carried out by threads, these threads are created and disposed depending of the current system load and the configuration of our server. Once a thread is created it will be in standby status until a work manager assigns some work to it. At this point of time the thread will be considered active until it finishes the job. A thread that is been running for long time will be tagged as a Hogging thread, and eventually (after the StuckThreadTime that we discussed above) it will marked as Stuck. The server failsafe configuration can be set up to restart automatically the WebLogic if there are many stuck threads, or you can bypass this behavior by changing the configuration of your Work Manager with the ignore stuck threads parameter. So, before we reach this point, is normally a good idea to check the threads status when we are experiencing performance issues. You can monitor the threads of the system from the WebLogic Console. Navigate to your server and then select the Threads tab under the Monitoring Tab.
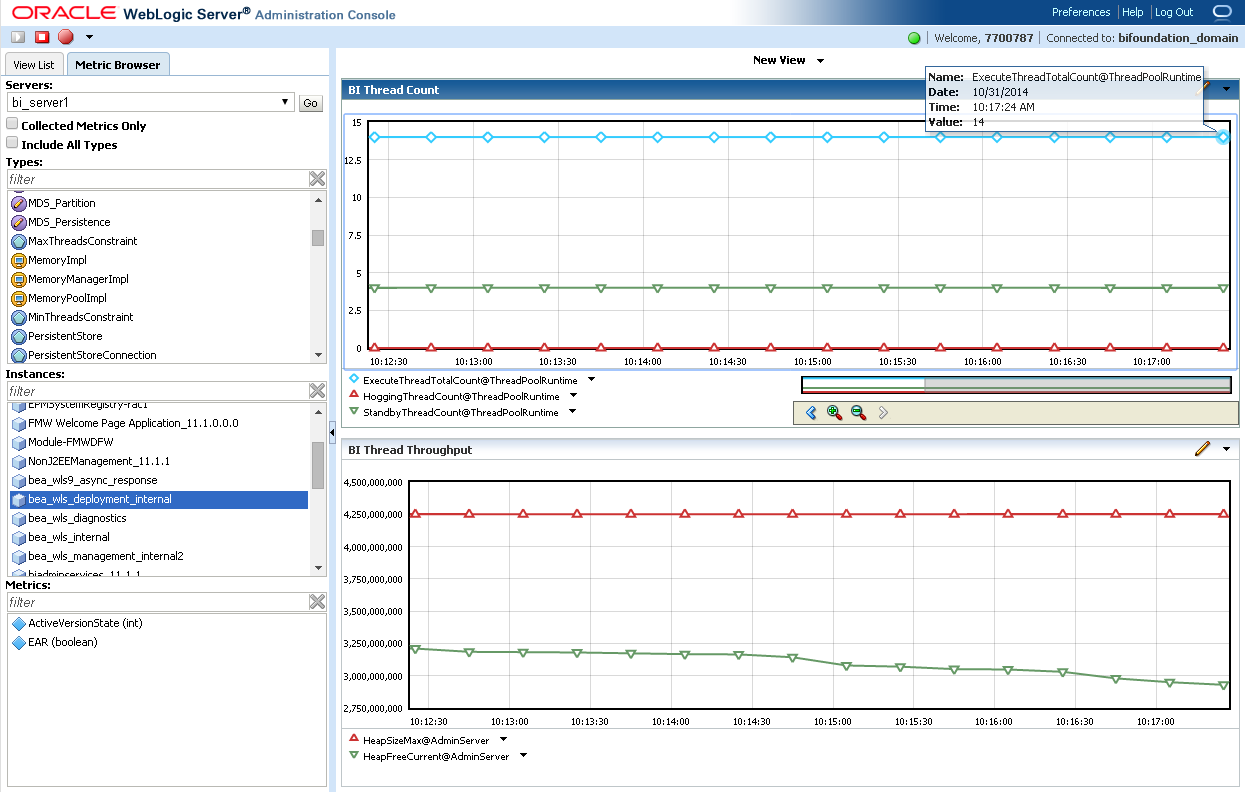
In the above screenshot I highlighted the areas that should get your attention. The main indicator of troubles is the “Health” column, which is related to the overall server Health indicator. If you see warning here (or worse) and this is related to the threads, then you’ll see how several of your threads are in the Stuck and Hogger status. Normally in these case there is no much to do other than restart the server. But the edge of coming here and check it first is that you can click that “Dump Thread Stacks” button at the top of the screen to get a stack trace of all your threads, so you’ll see what they were doing to become stuck. Another way to look at the thread information on graphical way is to use the Monitoring Dashboard available out of the box with the WebLogic console. To access point your browser to http://server:port/console/dashboard The interface is quite powerful, allowing you to create your own views with a rich set of metrics, which expose for example the Thread pool information, JVM metrics and even host OS metrics.
(Just remember to press the play button on top left or you won’t get any results! :P)
Conclusion
In this blog article we have explored some of the concepts related to solving, tuning and monitoring performance in an OBIEE instance. Please remember that any change to the performance configuration settings should be always done in a controlled test environment first and monitored closely for some time before applying it to a productive environment.